This weekend I took a look at FBL Financial Group Inc., which trades under the ticker FFG. FFG closed for trading on 9/11 at $49.75/share & offers many interesting advantages for investors & traders alike, as it has great fundamentals, as well as technicals too.
Breaking Down FBL Financial Group Inc. FFG’s Fundamentals
FBL Financial Group Inc.’s P/E (ttm) is 14.8, with a P/B of 0.78 and a low Beta of 0.22
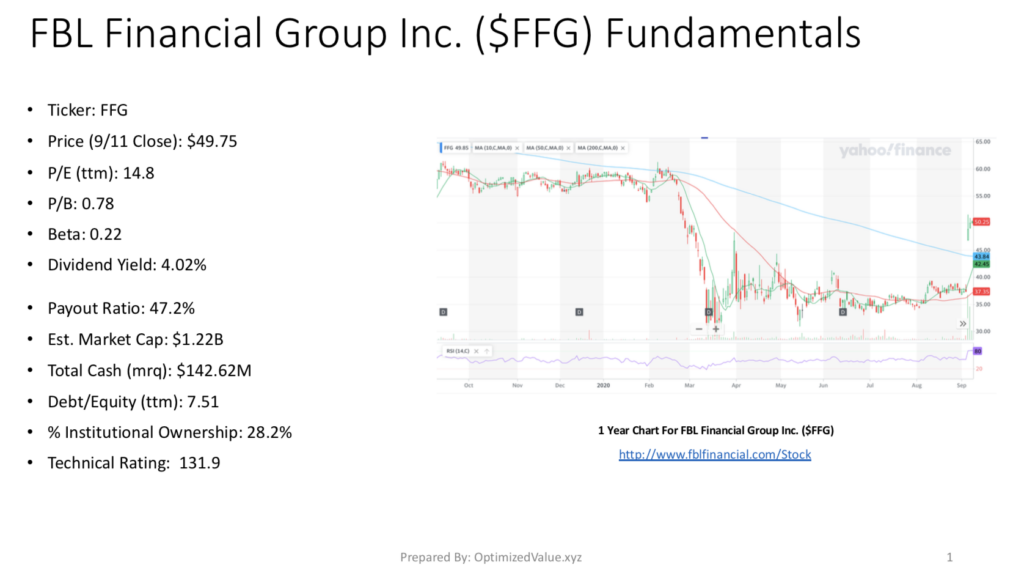
FFG offers a 4.02% annual Dividend, with a 47.2% Payout Ratio, showing that it has the strength to be sustained in the coming years.
While their Market Cap is only $1.22B (small compared to their peers), they have a Debt/Equity (ttm) of 7.51, which is very low, and $142.62M in Total Cash (mrq).
Due to their small cap status, they have a 28.2% % Institutional Ownership.
They also scored a high Technical Rating of 131.9, which is mostly attributed to strength from their recent gap up from $37.25 to $48.87 on 9/4/2020.
FBL Financial Group Inc. FFG’s Technical Strength Analyzed
FFG is currently showing a lot of technical strength, with their 10 Day Moving-Average at 42.45, 20 Day Moving-Average at 37.35 & their 200 Day Moving-Average is 43.84.
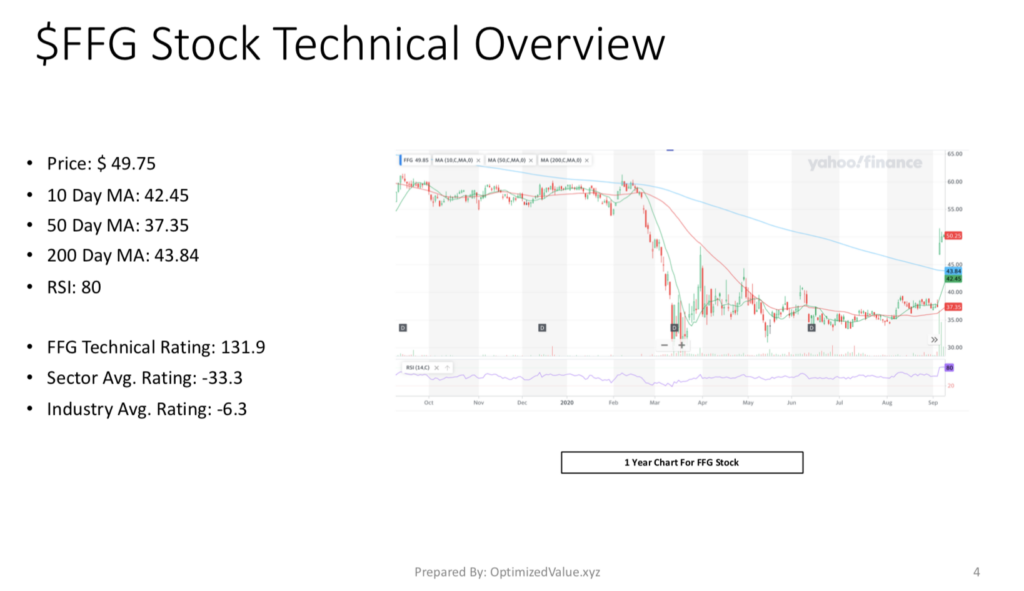
As mentioned prior, their recent gap up on 9/4 is the primary reason for their high RSI of 80, which will become a more normal level once they establish a new range.
FFG’s Technical Rating is 131.9, which is much higher than the Financials Sector’s (-33.3) and the Insurance Industry’s (-6.3).
This makes them very attractive from an active trader’s standpoint.
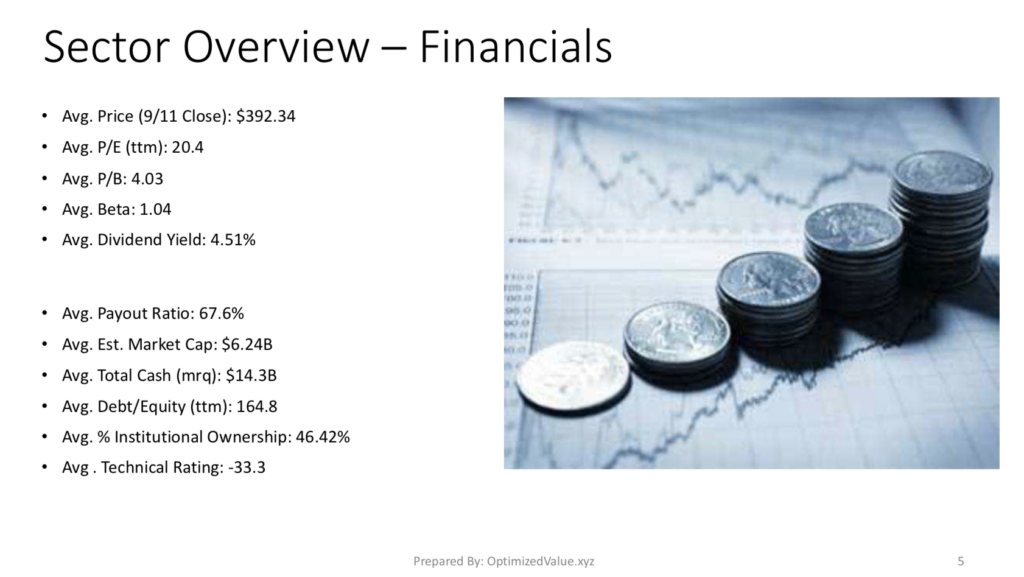
FBL Financial Group Inc. FFG’s Fundamentals Vs. The Financials Sector
FBL Financial Group Inc.’s stock fundamentals outperform their Financials Sector peers, making them appealing to investors.
FFG’s P/E (ttm) is 27.5% lower than average, and their P/B is 80.7% less than average. with a 78.8% lower Beta than their sector peers.
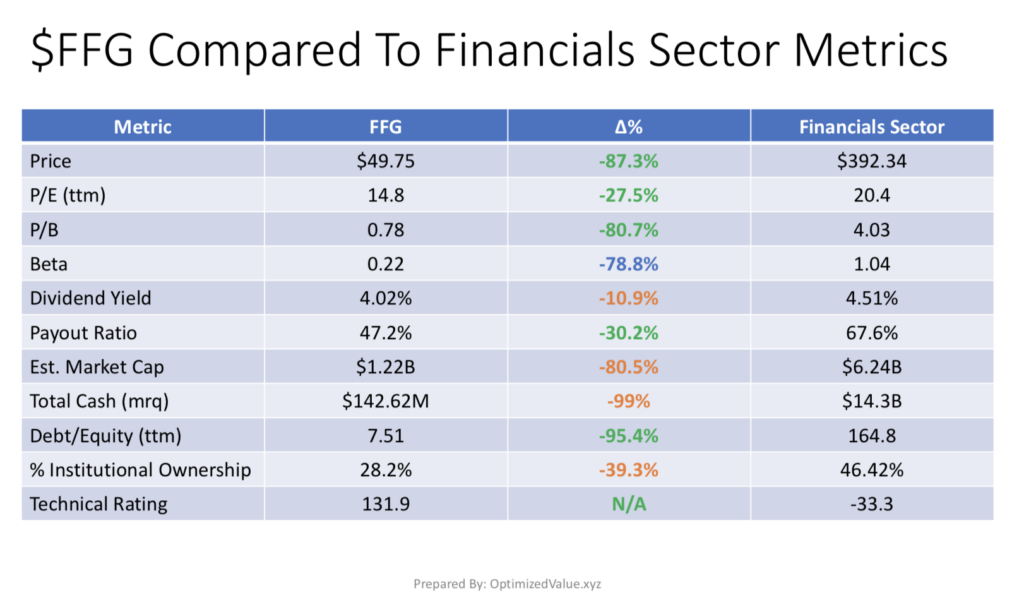
FFG’s Dividend Yield trails the average Financial Sector stock by 10.9%, but their Payout Ratio is 30% more sustainable than the sector average, another good sign to investors.
FFG’s Market Cap is 80.5% lower than the Financials Sector average, leading to their 99% less Total Cash (mrq) & 39.3% lower % Institutional Ownership.
Their impressive Debt/Equity (ttm) is 95.4% lower than average, and their Technical Rating of 131.9 is much higher & advantageous to the sector average of -33.3.
FBL Financial Group Inc. FFG Stock Fundamentals Vs. The Insurance Industry Averages
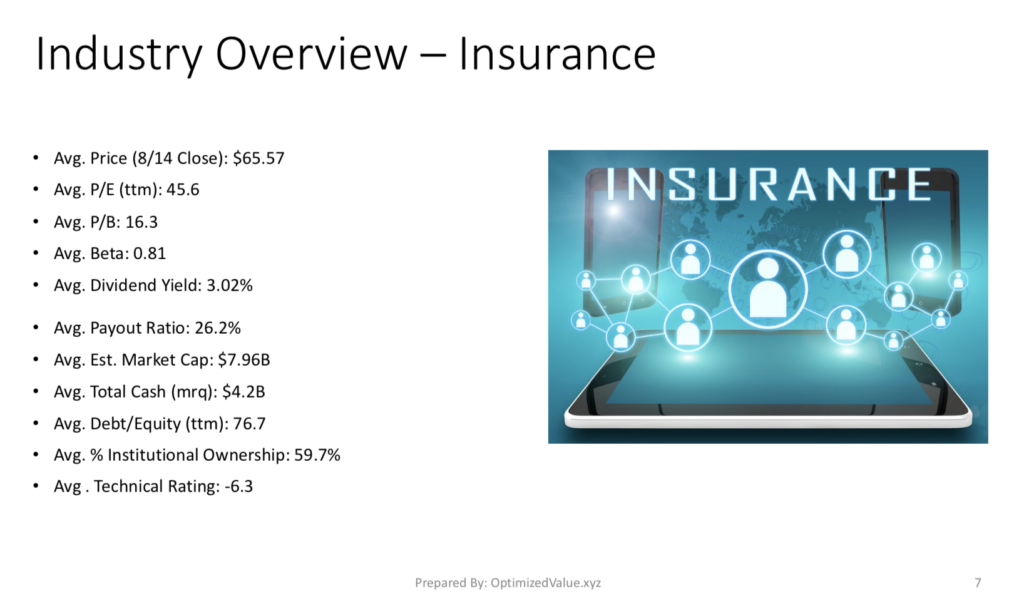
FBL Financial Group Inc.’s stock also has a leg up on its peers in the Insurance Sector. FFG’s P/E (ttm) is 67.5% lower than the Insurance Industry average, and their P/B is 95.2% less than average.
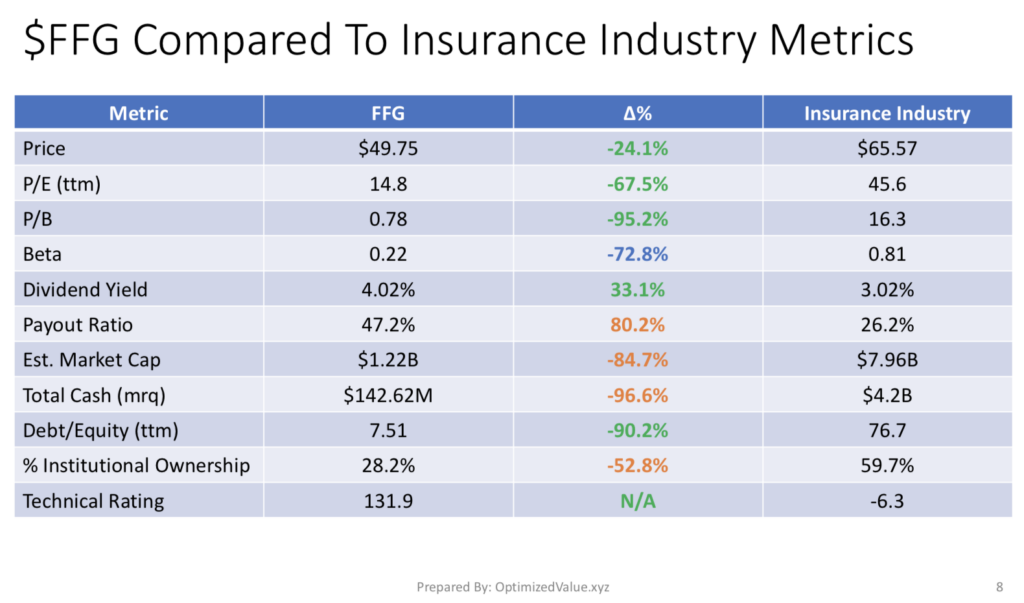
FFG’s Dividend Yield is 33.1% better than the Insurance Industry average & their Debt/Equity (ttm) is an incredible 90.2% better than average.
Their small Market Cap is 84.7% less than average, resulting in their 52.8% lower than average % Institutional Ownership & their 97% lower than average Total Cash (mrq).
FFG’s Technical Rating of 131.9 is much higher than the Insurance Industry Average of -6.3.
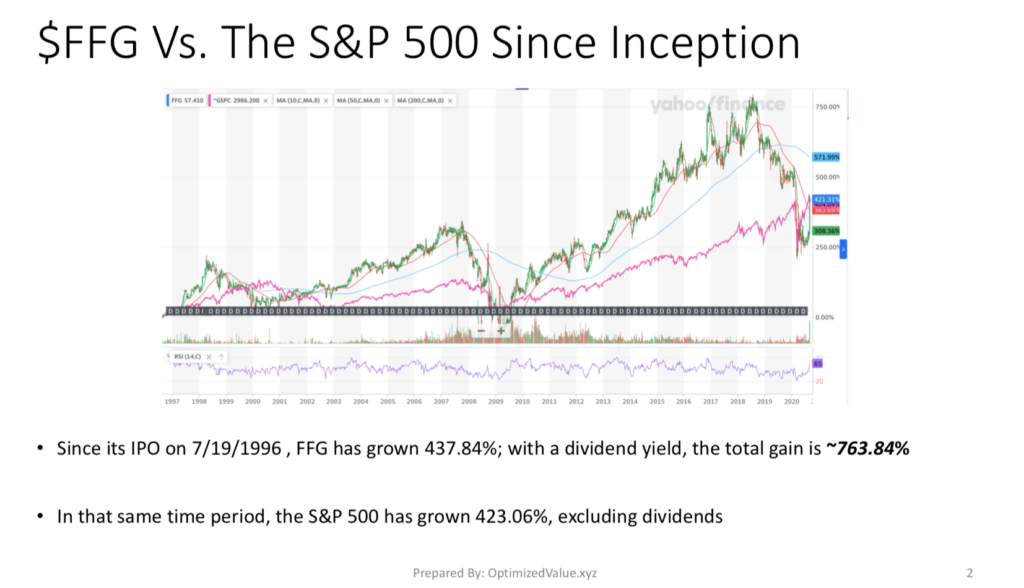
FBL Financial Group Inc. FFG’s Stock Has Outperformed The S&P 500 & Competes With NASDAQ For Total Lifetime Returns
Since FFG IPO’d on 7/19/1996, they have grown by 437.84%, which when collected dividends are included jumps to 763.84%. In that same time period the S&P 500 has only increased by 423.06% excluding dividends.
In that same time, the NASDAQ has grown 888.77%, excluding dividends.
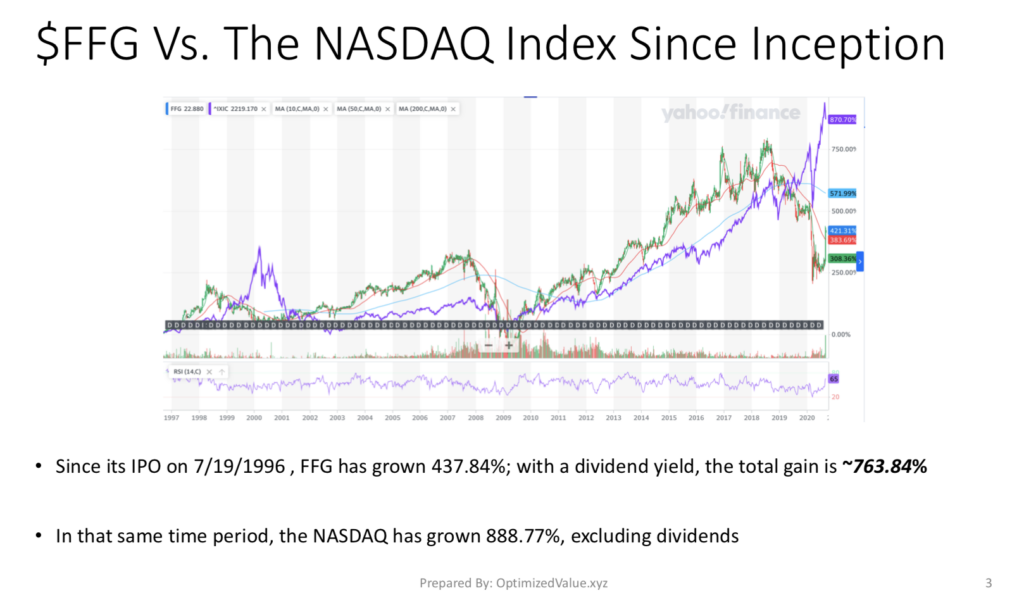
This ability to grow is a great sign for investors.
Tying It All Togeher
Overall, FFG’s stock offers a lot of advantages for both short term traders & long term investors. Their recent success has made their technicals very attractive, which is especially important in a time of minor corrections & pivots that we have seen over the last week.
Their fundamentals look great, especially the appeal of such low debt with a sustainable 4%+ dividend yield, and they have achieved consistent & solid enough growth since they IPO’d to make them worth considering for any investor’s portfolio.
I am going to begin looking at them once they begin to define their new range, as currently it is too early to pick a good entry point.
For Full PDF Report:
*** I DO NOT OWN SHARES OF FFG STOCK ***