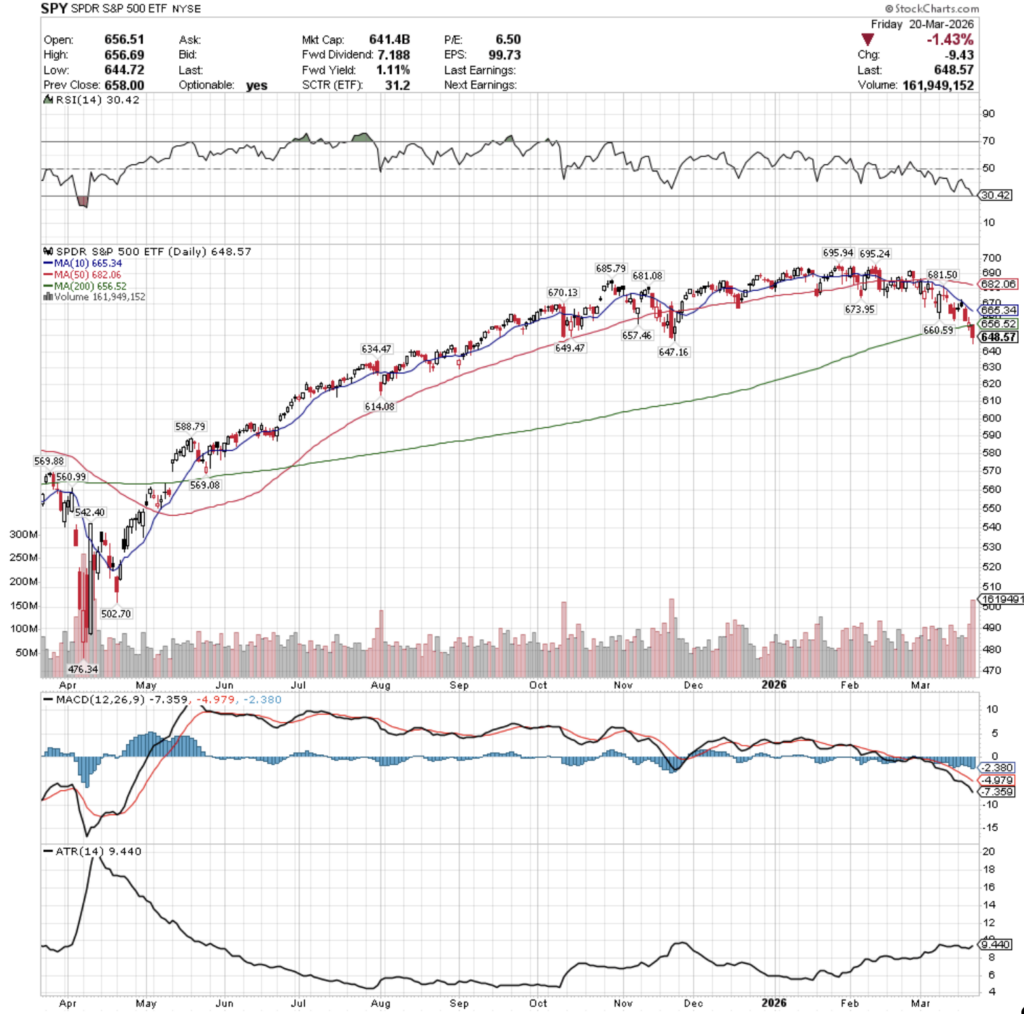
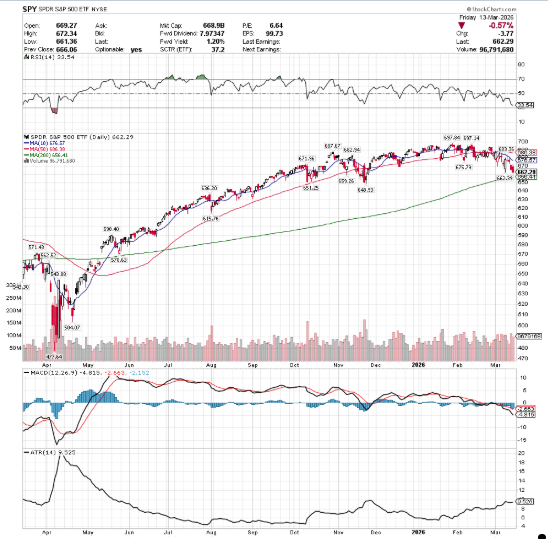
SPY, the SPDR S&P 500 ETF gained +3.6% last week, while the VIX closed at 19.23, indicating an implied one day move range of +/-1.21% & an implied one month move range of +/-5.56%.
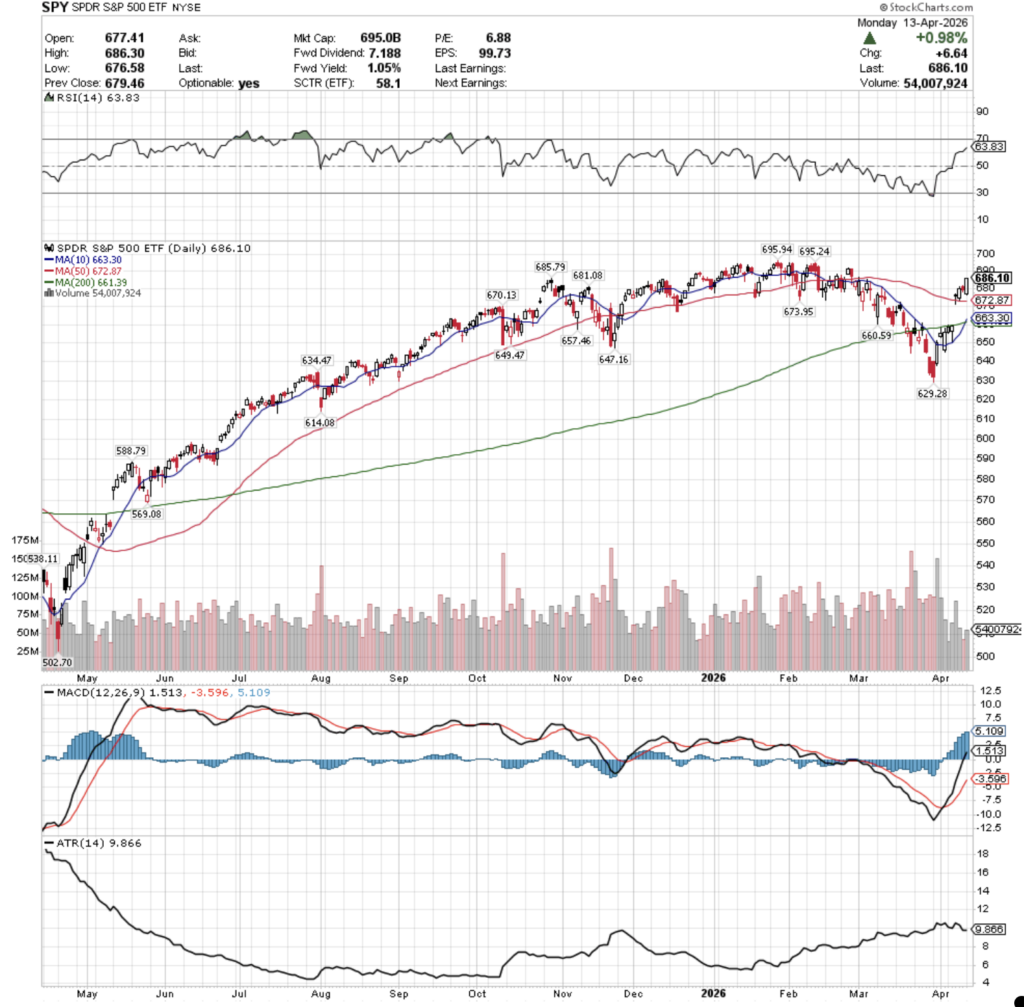
Their RSI istrending towards overbought conditions, currently at 63.83, while their MACD is extended higher bullishly.
Volumes were -22.2% lower than the prior year’s average (60,416,000 vs. 77,471,640), which casts doubts upon the strength of the mid-to-late week gap & rally that we saw, as even with Wednesday’s high volume the rest of the week was muted.
Monday the week opened up for SPY on a light volume slight gap higher open that tested & temporarily broke through the 200 day moving average’s resistance, but was unable to remain above it into the close, adding +0.47% on the day.
Tuesday opened lower, tested down to the support of the 10 day moving average, but it held up & pushed SPY higher on the day on the second highest volume of the week, but the resistance of the 200 DMA held up heading into the close.
Wednesday things really heated up, as exuberance surrounding the war in Iran forced a gap up open +2.6% above the resistance of the 50 DMA on the week’s highest volume, but there was something amiss.
While SPY did gain a little bit after the open, it also sunk throughout the session to form a hanging man candle & it closed lower than it opened; both of which are not bullish & express skittishness & speculative behavior.
Thursday’s open reflected this, as SPY opened lower, but the support of the 50 day moving average held strong & pumped SPY higher, albeit on mediocre volume, which proved to be a subpar follow up after such a grand gap up session the previous day.
Friday opened higher, but the second lowest volume session of the week sunk throughout the session as profits were taken off of the table & risk was reassessed heading into the weekend.
Heading into the new week, SPY’s upside case relies on an increase in advancing volume to push forward prices following Wednesday’s big gap session.
There will likely need to be some major developments on the war-front, as January’s all-time high that is <2% higher has remained in-tact & not much has changed for the better since, making it seem unlikely that we will see a new ATH this week, particularly given where SPY’s RSI sits.
The consolidation case focuses on the support of the 50 DMA holding up, whereby SPY will oscillate range bound around it as we await an upside/downside catalyst & the 10 DMA catches up to price.
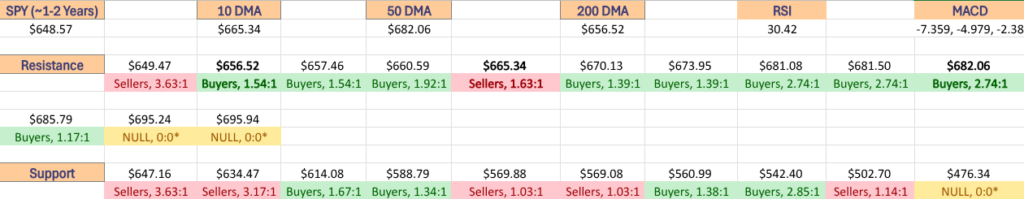
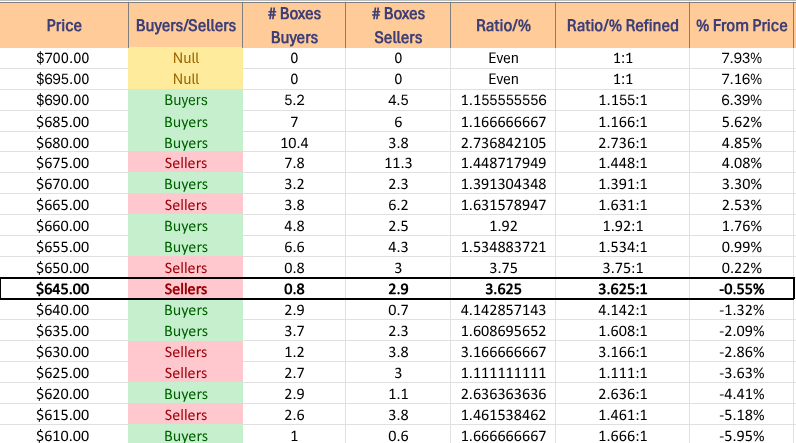
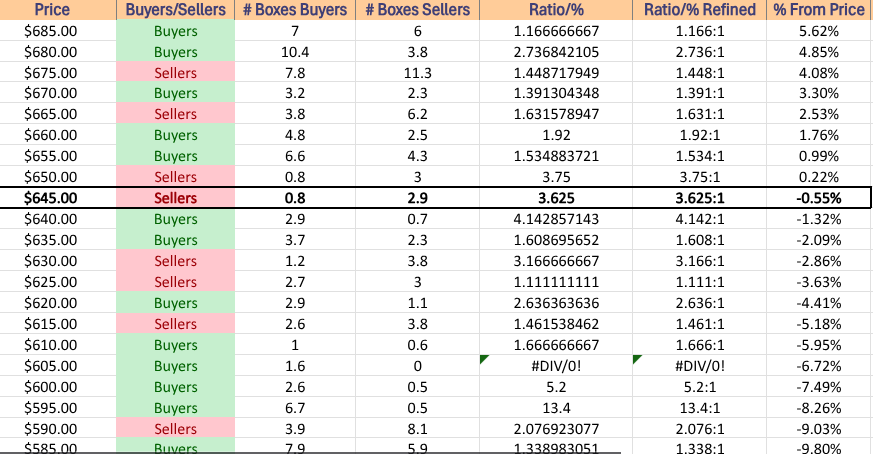
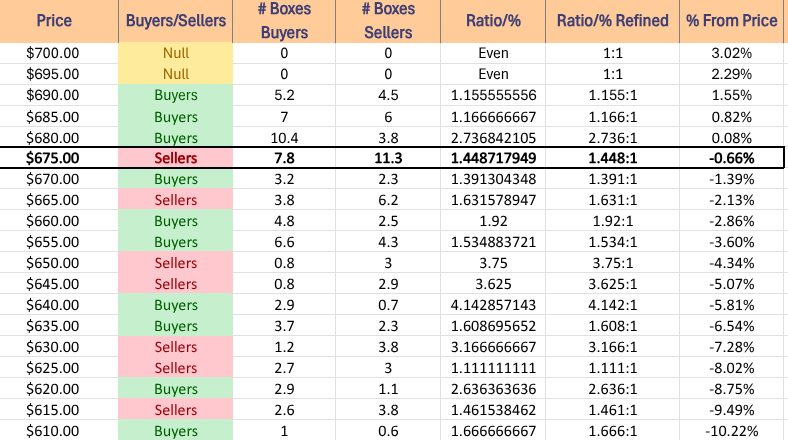
To the downside, the 50 DMA’s support will be a critical level if retested, as if the medium-term trendline is unable to keep price propped up the $665-659.99/share price level is Seller oriented historically, which would then push price down towards the 10 DMA’s support which is rapidly approaching from below.
It will be interesting to see where these averages are when SPY begins filling in Wednesday’s window, particularly given earnings calls may be the catalyst.
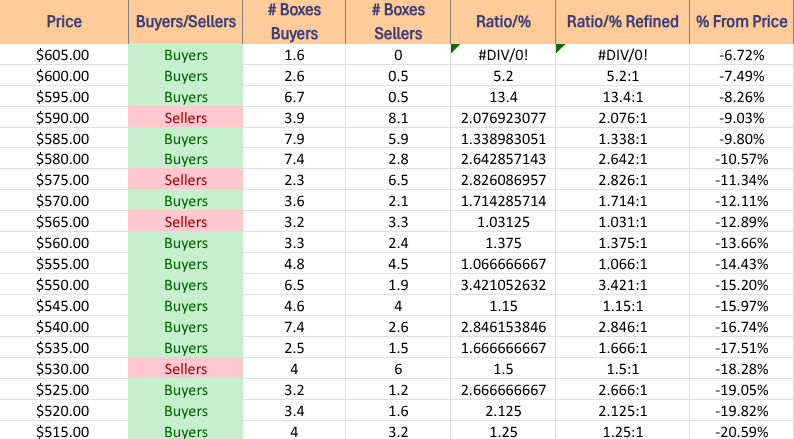
SPY has support at the $673.95 (Volume Sentiment: Buyers, 1.39:1), $672.87 (50 Day Moving Average, Volume Sentiment: Buyers, 1.39:1), $670.13 (Volume Sentiment: Buyers, 1.39:1) & $663.30/share (10 Day Moving Average, Volume Sentiment: Buyers, 1.92:1) price levels, and resistance at the $681.08 (Volume Sentiment: Buyers, 2.74:1), $685.79 (Volume Sentiment: Buyers, 1.17:1), $695.24 (Volume Sentiment: NULL, 0:0*) & $695.94/share (All-Time High, Volume Sentiment: NULL, 0:0*) price levels.
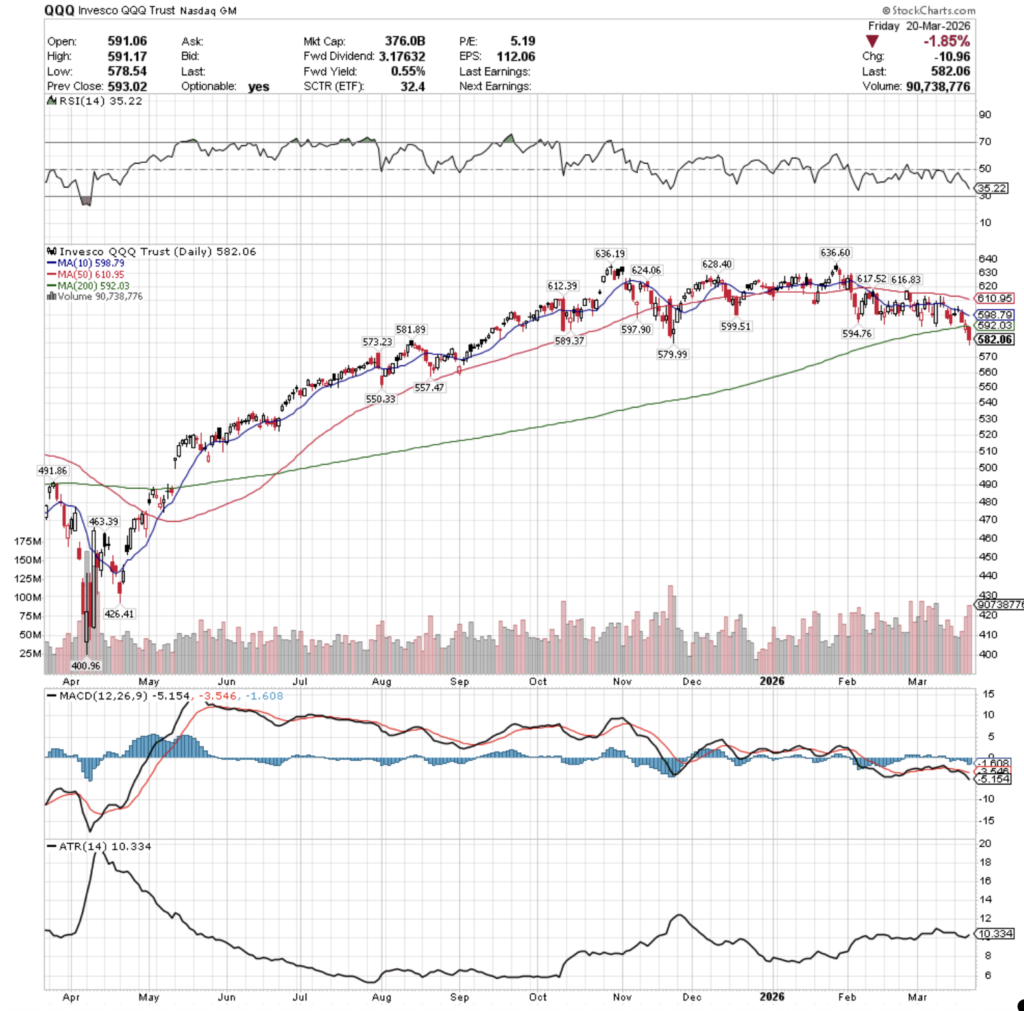
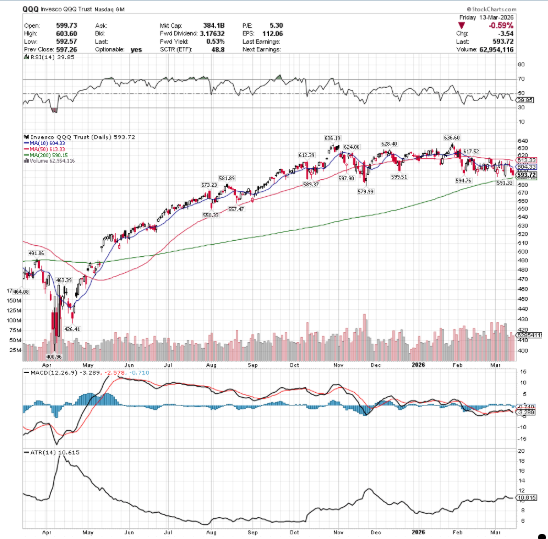
QQQ, the Invesco QQQ Trust ETF advanced +4.46% for the week, as the tech-heavy index had the strongest week of the four majors.
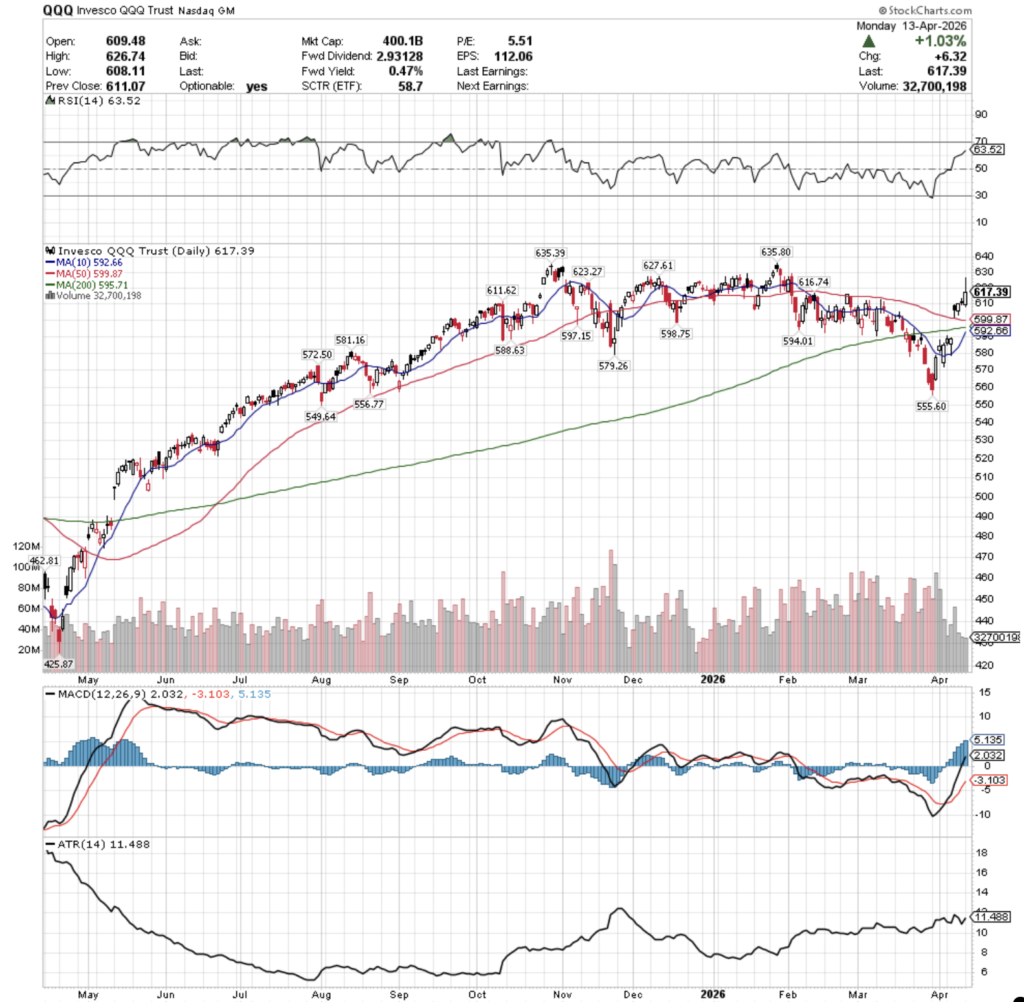
Their RSI is trending towards overbought conditions, currently at 63.52, while their MACD is bullishly extended.
Volumes were -18.52% lower than the prior year’s average (44,006,000 vs. 54,006,560), which like SPY’s is questionable given the magnitude of Wednesday’s gap up move.
Monday QQQ opened on a gap up, tested lower, before running higher on the week’s lowest volume.
Tuesday opened lower, tested down to the support of the 10 day moving average, to run higher and close the day as an advancing session on the week’s second highest volume.
Wednesday opened on a +3.42% gap higher, the major contributing factor for QQQ’s weekly outperformance, but like SPY sunk throughout the session to test the support of the 50 day moving average before closing lower than it opened on the week’s highest volume.
Thursday opened lower, tested lower, before rallying higher to close on a daily advance just above Wednesday’s open.
Friday opened on a gap higher, but a sense of foreboding crept into the air as after a brief test higher investors went risk-off temporarily breaking below the $610/share level & closing as a spinning top that favored the lower end of the day’s range.
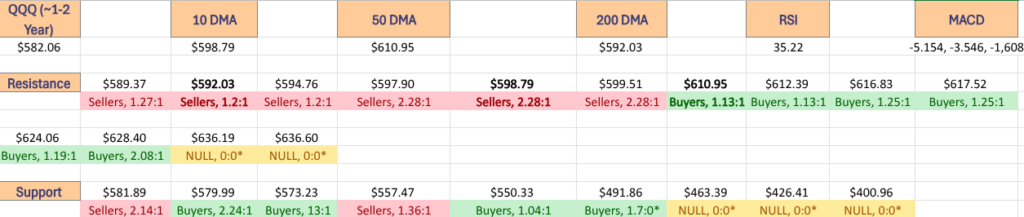
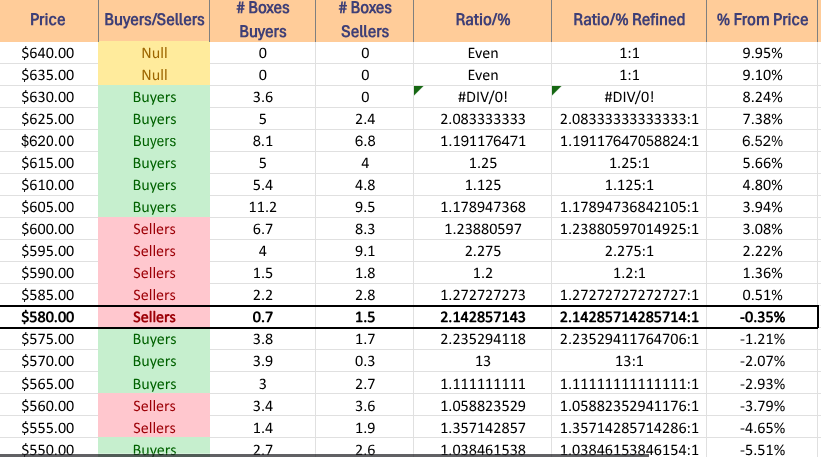
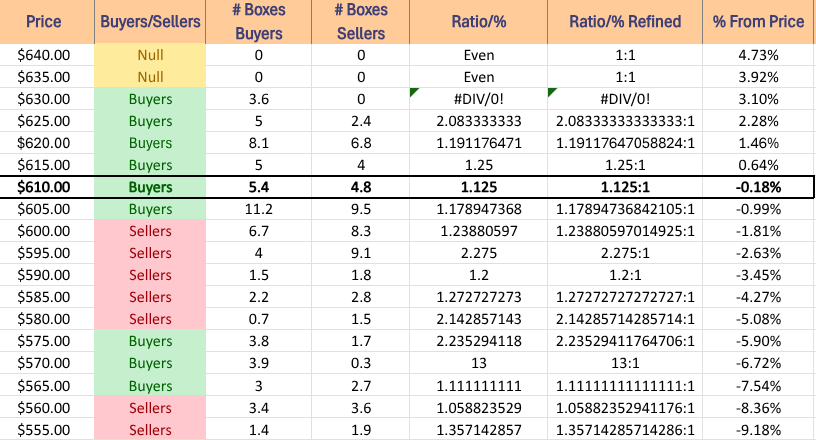
Heading into the new week, the upside case sees the $627.61/share as the gatekeeper to QQQ all-time high, and crossing it to make a realistic sustainable run at the ATH will require an increase in advancing volume.
The consolidation case will likely see oscillations around the 10 & 50 day moving averages (maybe even 200 DMA depending on how long it lasts for) as we await an upside or downside catalyst (likely the war in Iran or earnings).
To the downside the moving averages mentioned above will play a critical role in providing support to stop any declines.
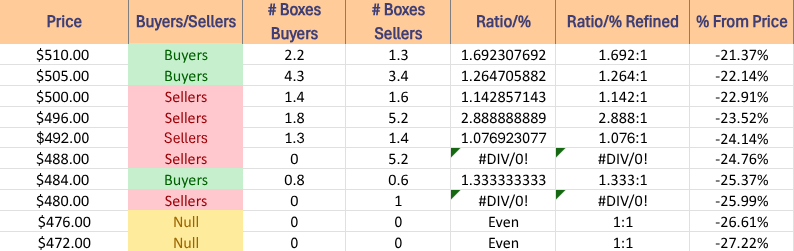
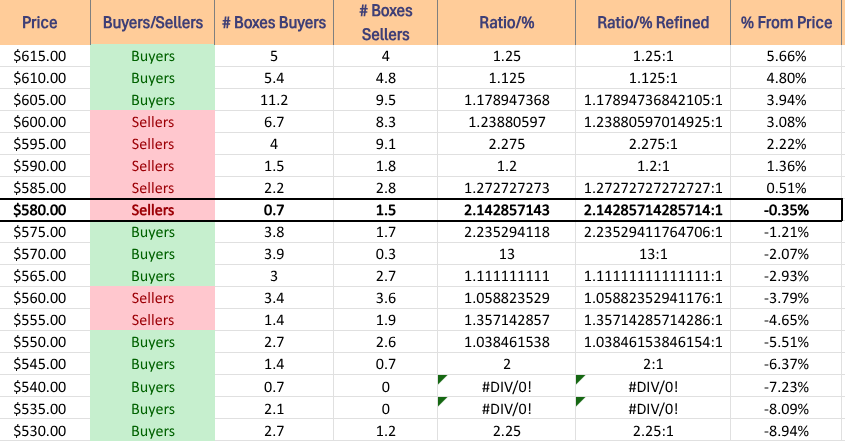
The trouble here is that those retests will likely prove daunting as they are all in Seller zones & Seller zones can see price walked down to $579.99/share before we enter another Buyer zone, which will be important to watch for as the window from last week begins to fill to the downside.
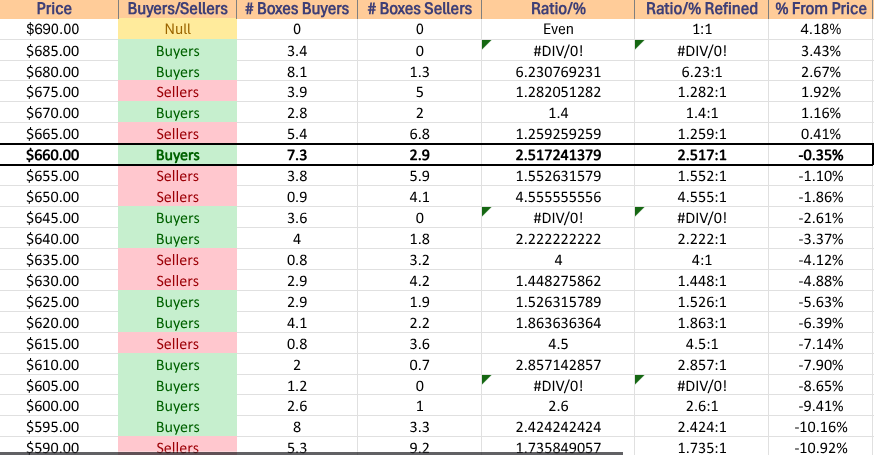
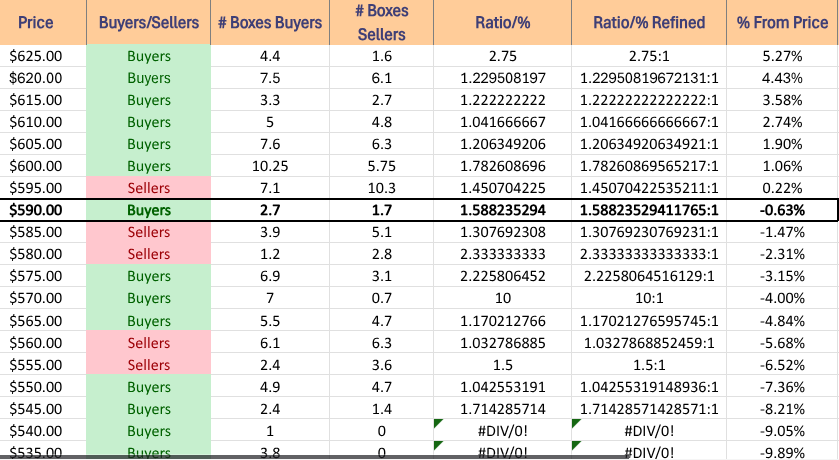
QQQ has support at the $599.87 (50 Day Moving Average, Volume Sentiment: Sellers, 2.28:1), $598.75 (Volume Sentiment: Sellers, 2.28:1), $597.15 (Volume Sentiment: Sellers, 2.28:1) & $595.71/share (200 Day Moving Average, Volume Sentiment: Sellers, 2.28:1) price levels, and resistance at the $611.62 (Volume Sentiment: Buyers, 1.13:1), $616.74 (Volume Sentiment: Buyers, 1.25:1), $623.27 (Volume Sentiment: Buyers, 1.19:1) & $627.61/share (Volume Sentiment: Buyers, 2.08:1) price levels.
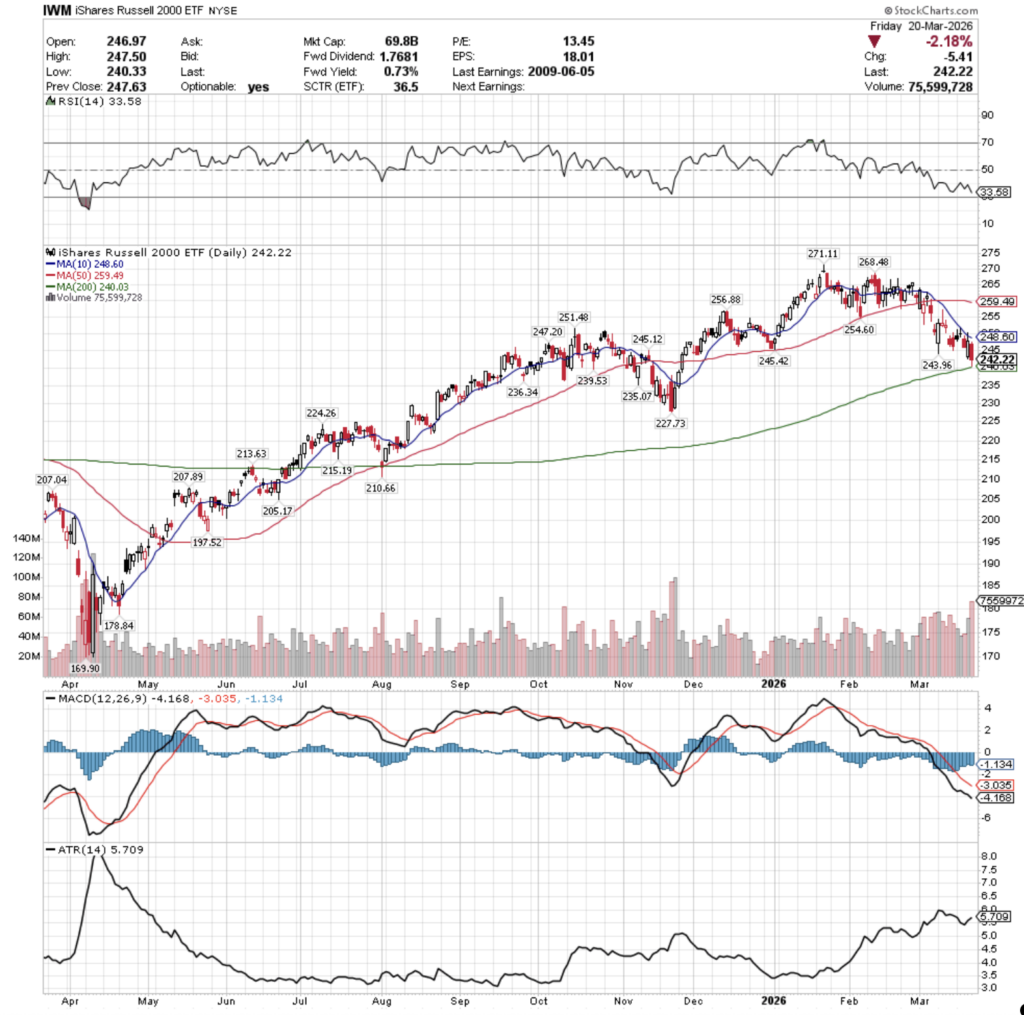
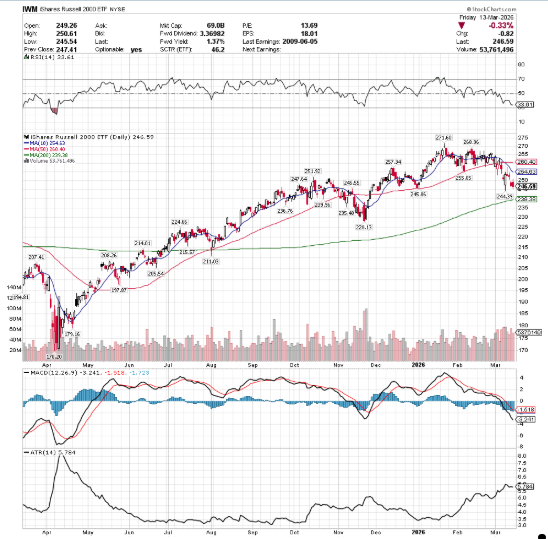
IWM, the iShares Russell 2000 ETF climbed +3.98% for the week, as the small cap index was the second favorite of the major four indexes.
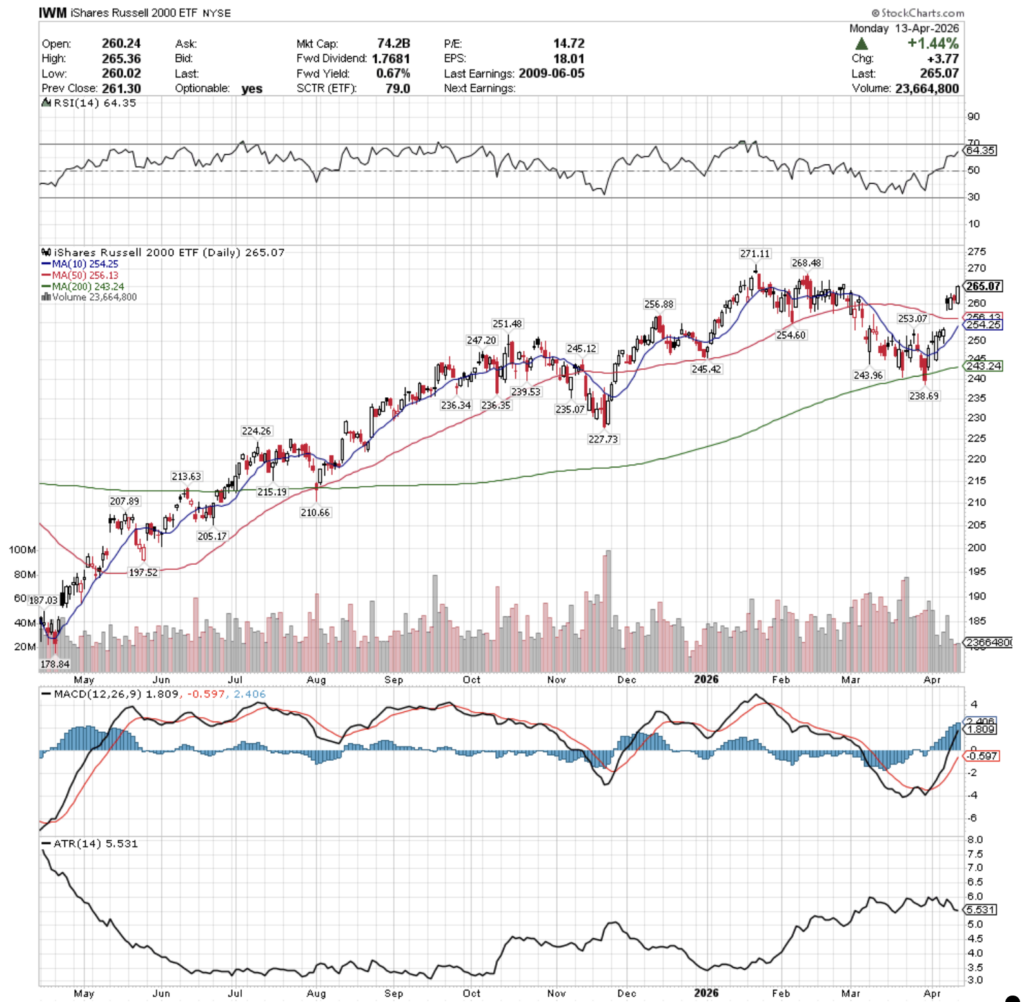
Their RSI is trending towards overbought conditions at currently is at 64.35, while their MACD is extended bullishly.
Volumes were -20.28% lower than the prior year’s average (30,568,000 vs. 38,345,520), which casts doubts upon the strength of Wednesday’s gap up session.
Monday opened the week on a higher note, but on low volume.
Tuesday opened lower, tested down to the 10 DMA’s support before trending higher to close the day positive.
Wednesday opened on a gap up above the 50 day moving average, but like SPY & QQQ, IWM sunk throughout the session, with a long lower shadow as profits were taken from the early morning gap up open.
Thursday opened lower, but promptly ran higher to close just below Wednesday’s open, which also casts doubt upon the strength of the gap up.
Friday opened on a gap higher, but promptly sunk lower as risk was taken off heading into the weekend & profits for the week were collected.
For IWM the upside case this week involves breaking above the $268.48/share gatekeeper level to make a run for their all-time high.
This will require an increase in advancing volume that is sustainable if there is to be a meaningful breakout.
The consolidation case see IWM beginning to fill in Wednesday’s window & then oscillate around the 10 DMA inside the window as we await an upside or downside catalyst.
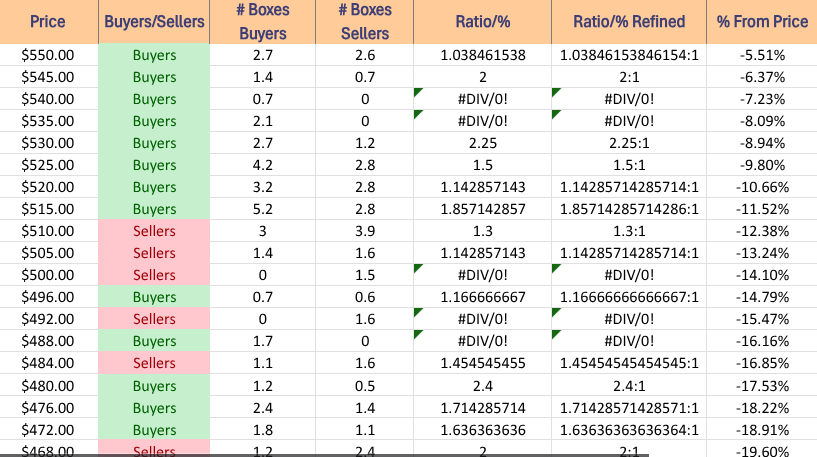
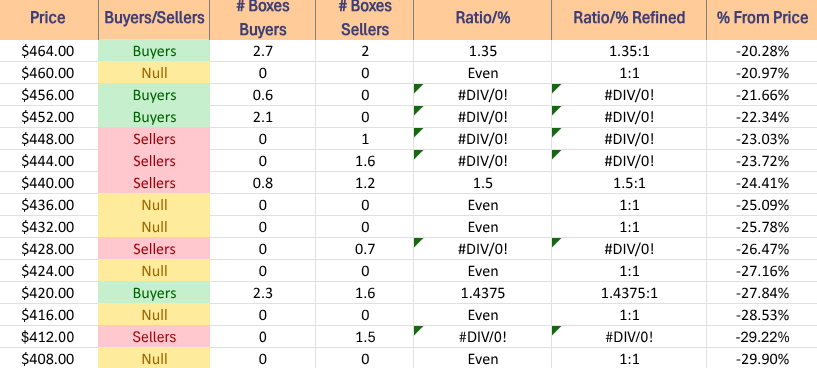
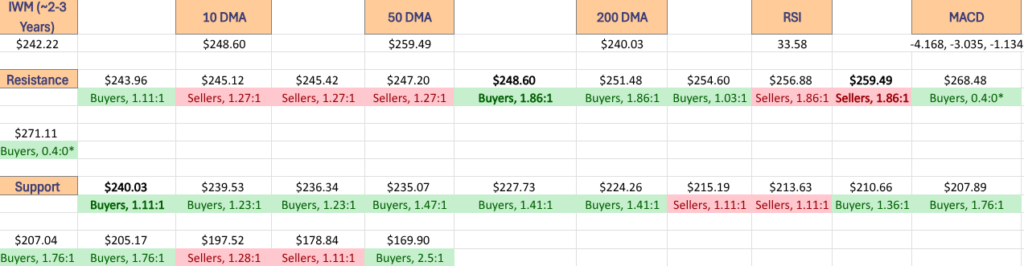
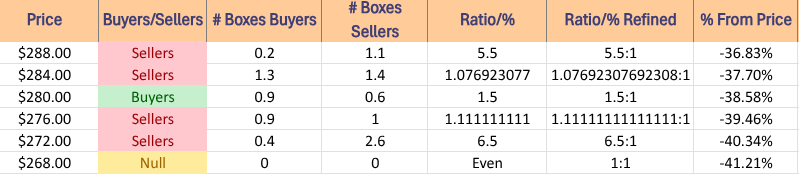
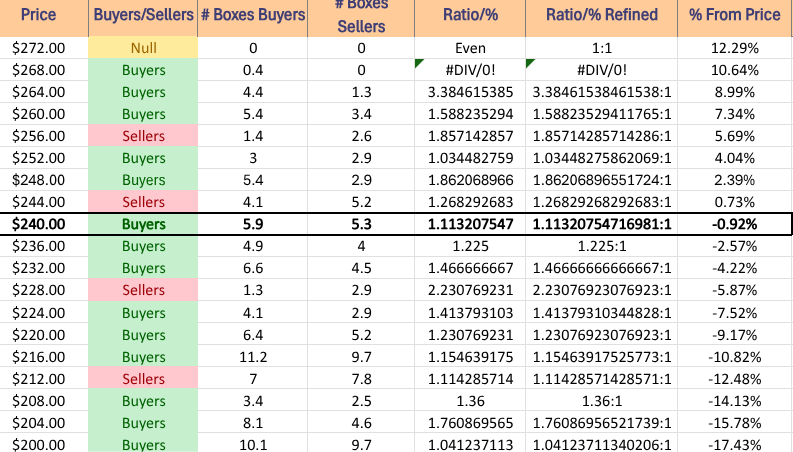
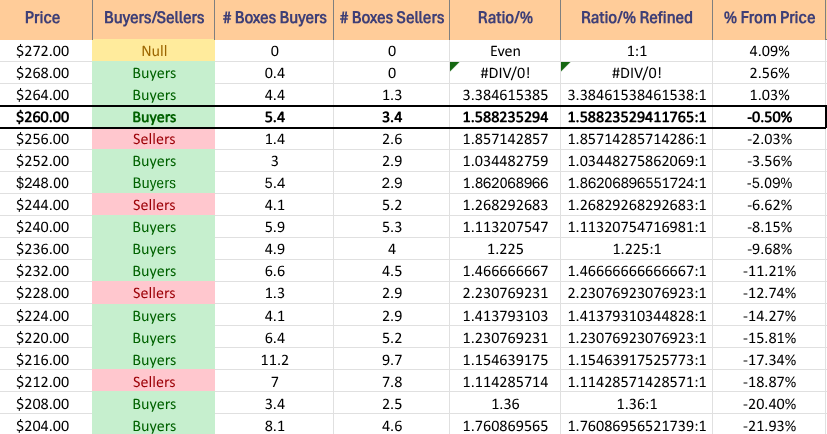
To the downside there is a Seller zone that begins at $259.99-256 which leads to a retest of the support of the 50 DMA, should that break down the $251.48/sharelevel will be an area of interest to keep an eye on, as it is the gatekeeper to the $240’s & the low $250’s support levels that are above $252 are in a Seller zone.
IWM has support at the $256.88 (Volume Sentiment: Sellers, 1.88:1), $256.13 (50 Day Moving Average, Volume Sentiment: Sellers, 1.88:1), $254.60 (Volume Sentiment: Buyers, 1.03:1) & $254.25/share (10 Day Moving Average, Volume Sentiment: Buyers, 1.03:1) price levels, and resistance at the $268.48 (Volume Sentiment: Buyers, 0.4:0*) & $271.11/share (All-Time High, Volume Sentiment: Buyers, 0.4:0*) price levels.
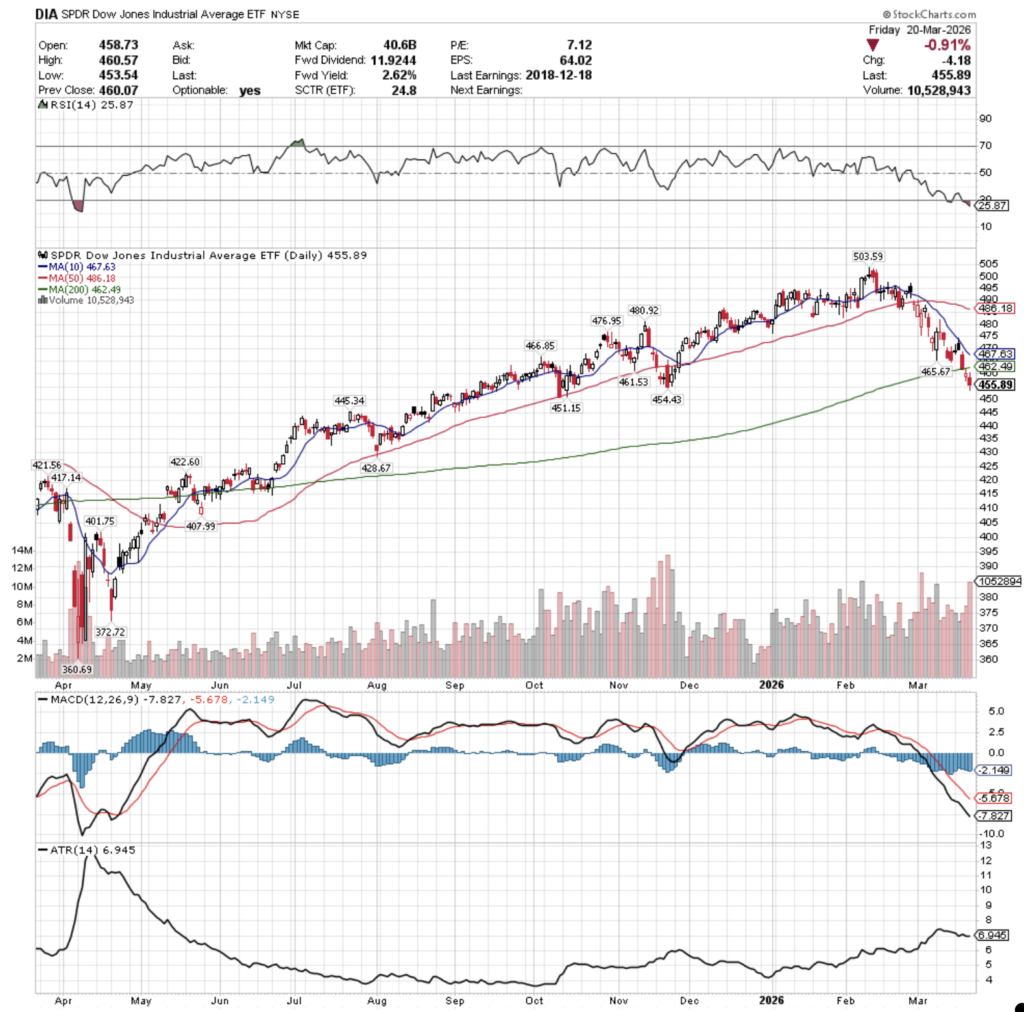
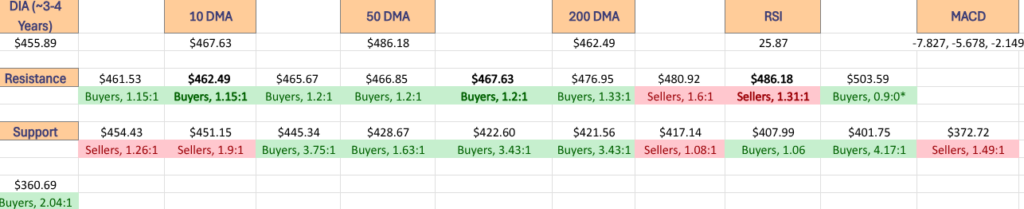
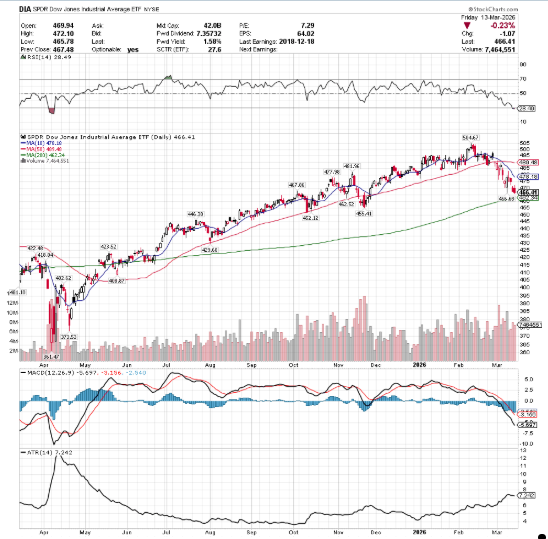
DIA, the SPDR Dow Jones Industrial Average ETF added +3.05% for the week, as the blue chip index was the least favored of the majors.
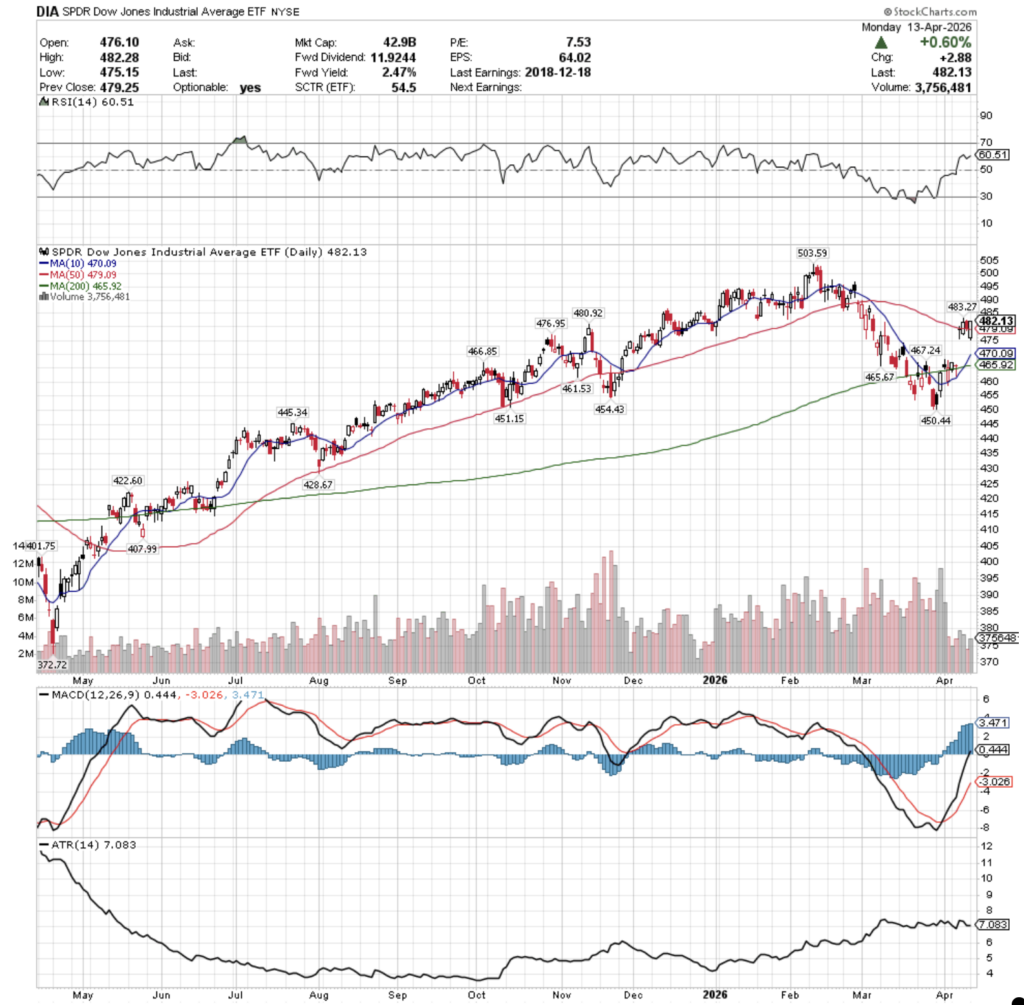
Their RSI is trending towards overbought at 60.51, while their MACD is heavily extended bullishly.
Volumes were -30.2% lower than the prior year’s average (3,684,000 vs. 5,278,120), which either reflects a wait & see approach for the blue chip stocks, or is a sign that we may see investors begin jumping out of the pool.
Monday saw DIA open higher, test below the 200 DMA briefly, before rising to close above it.
Tuesday opened lower, broke below the 200 DMA, but managed to rise up to close as a dragonfly doji, a sign of optimism paired with caution.
Wednesday opened on a gap higher to be in-line with the 50 DMA, but it did test lower and ultimately close as a dragonfly doji candle.
Thursday opened lower, tested slightly lower, before breaking out above the 50 DMA’s resistance to close above it.
Friday managed a higher open, but risk was taken from the table & investors forced DIA’s price down to rest just atop the support of the 50 DMA.
This week’s upside case relies on more advancing volume among the “buy & hold” blue chip crowd, with $483.27 being the gatekeeper to break above if there is to be a run at their all-time high.
The consolidation case focuses on oscillations around the 50 DMA as we await the 10 DMA to catch up to price & or an upside/downside catalyst.
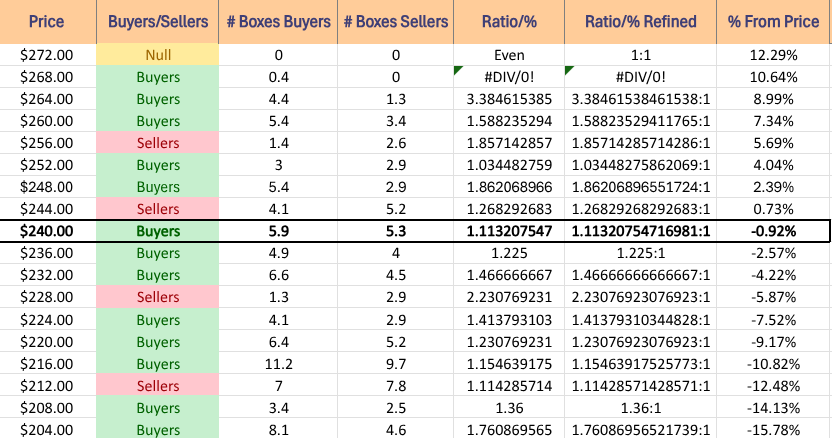
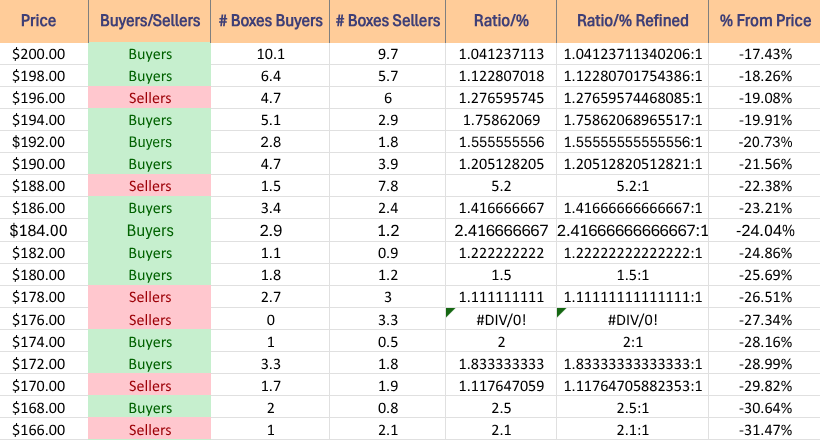
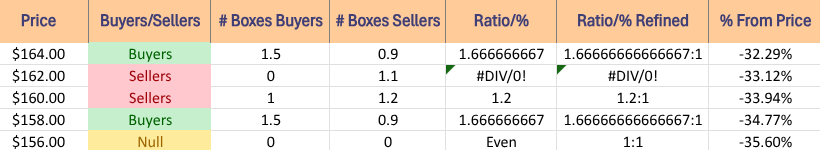
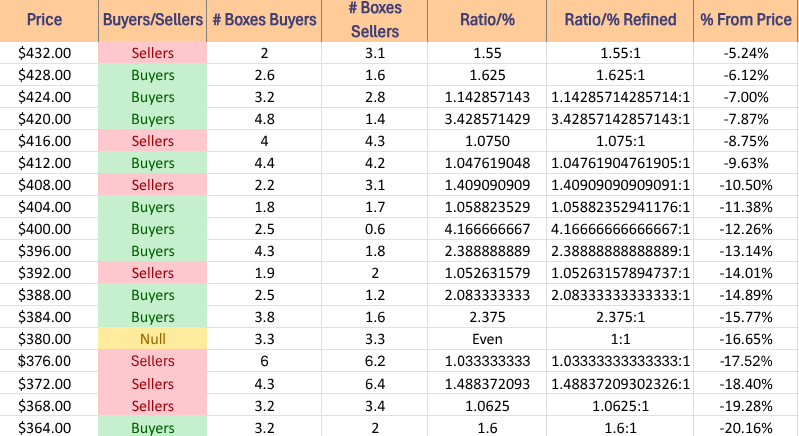
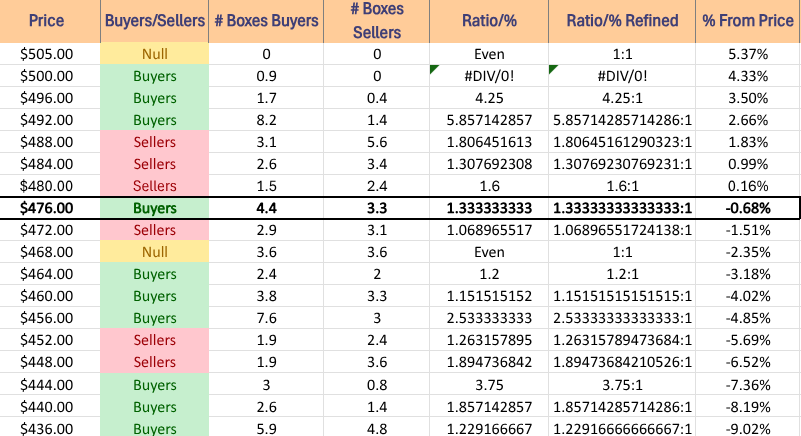
To the downside, if the window from Wednesday begins to fill it will come down to the 200 DMA’s support, especially given that there is Seller & Even Buyer:Seller pressure within the window itself.
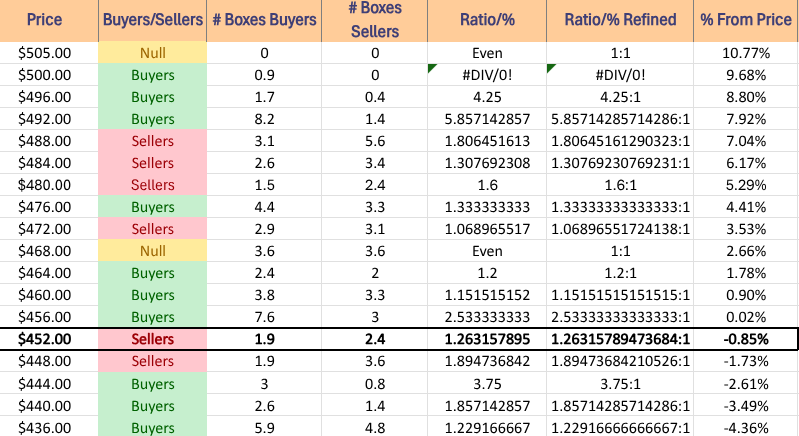
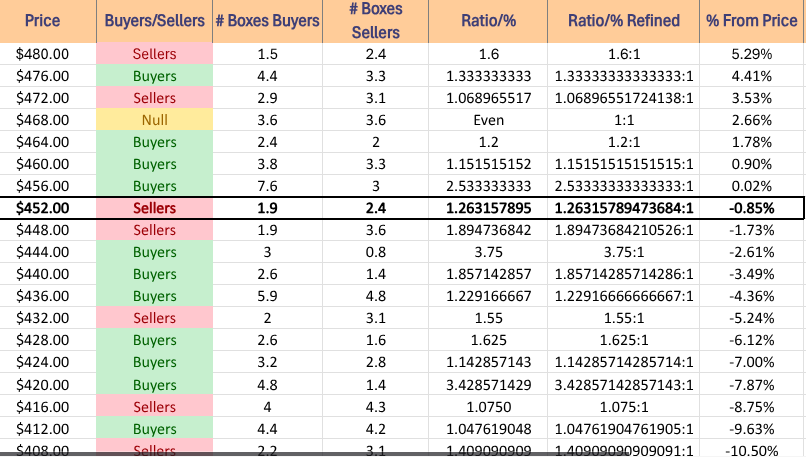
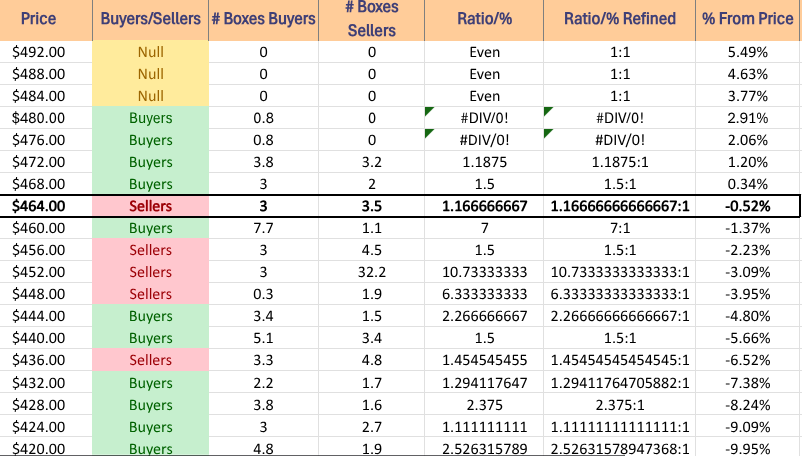
DIA has support at the $479.09 (50 Day Moving Average, Volume Sentiment: Buyers, 1.33:1), $476.95 (Volume Sentiment: Buyers, 1.33:1), $470.09 (10 Day Moving Average, Volume Sentiment: Even, 1:1*) & $467.24/share (Volume Sentiment: Buyers, 1.2:1) price levels, and resistance at the $480.92 (Volume Sentiment: Sellers, 1.6:1), $483.27 (Volume Sentiment: Sellers, 1.6:1) & $503.59/share (All-Time High, Volume Sentiment: Buyers, 0.9:0*) price levels.
The Week Ahead
Monday the week begins with Existing Home Sales data at 10 am, before Fed Governor Miran speaks at 6:20 pm.
Goldman Sachs & Fastenal report earnings Monday morning before the opening bell, with FB Financial reporting after the session’s close.
NFIB Optimism Index data comes out at 6 am on Tuesday, followed by Producer Price Index, Core PPI, PPI Year-over-Year & Core PPI Year-over-Year at 8:30 am, Fed Presidents Collins, Barkin & Paulson speak on a panel about the rural economy at 1 pm & Fed Governor Barr speaks at 5:50 pm.
Tuesday morning’s earnings reports begin with news from Albertsons, BlackRock, CarMax, Citigroup, Johnson & Johnson, JP Morgan Chase & Wells Fargo.
Wednesday brings us Import Price Index, Import Price Index minus Fuel, Empire State Manufacturing Survey data & Fed Governor Barr speaking at 8:30 am, before Home Builder Confidence Index data at 10 am, Fed Vice Chair for Supervision Bowman speaks at 1:45 pm & Fed Beige Book data comes out at 2 pm.
Wednesday morning’s earnings include ASML, Bank of America, First Horizon, M&T Bank, Morgan Stanley, PNC & Progressive,with Home Bancshares, J.B. Hunt Transport & SL Green Realty after the closing bell.
Initial Jobless Claims & Philadelphia Fed Manufacturing Survey data come out Thursday at 8:30 am, followed by Fed President Williams speaking at 8:35 am, Industrial Production & Capacity Utilization data come out at 9:15 am and Fed Governor Miran speaks at 10:35 am.
Thursday morning’s earnings calls feature PepsiCo, Abbott Laboratories, BNY Mellon, Charles Schwab, Citizens Financial Group, Insteel Industries, KeyCorp, Manpower, Marsh McLennan, Prologis, Taiwan Semiconductor Manufacturing, Travelers, U.S. Bancorp & Wealthfront, with Netflix, Alcoa, Cohen & Steers & Simmons First National reporting in the evening.
Friday the week winds down with Fed President Daly speaking at 11:30 am, Fed President Barkin speaking at 12:15 pm & Fed Governor Waller speaking at 2 pm.
Ally Financial, Autoliv, Badger Meter, Fifth Third, Regions Financial, State Street & Truist all report earnings before Friday’s session’s open.
See you back here next week!
*** I DO NOT OWN SHARES OR OPTIONS CONTRACT POSITIONS IN SPY, QQQ, IWM OR DIA AT THE TIME OF PUBLISHING THIS ARTICLE ***