Kroger Co. stock trades under the ticker KR & has shown recent bullish behavior that traders & investors should research further into for when they establish an uptrend.
KR stock closed at $45.90/share on 6/14/2023.
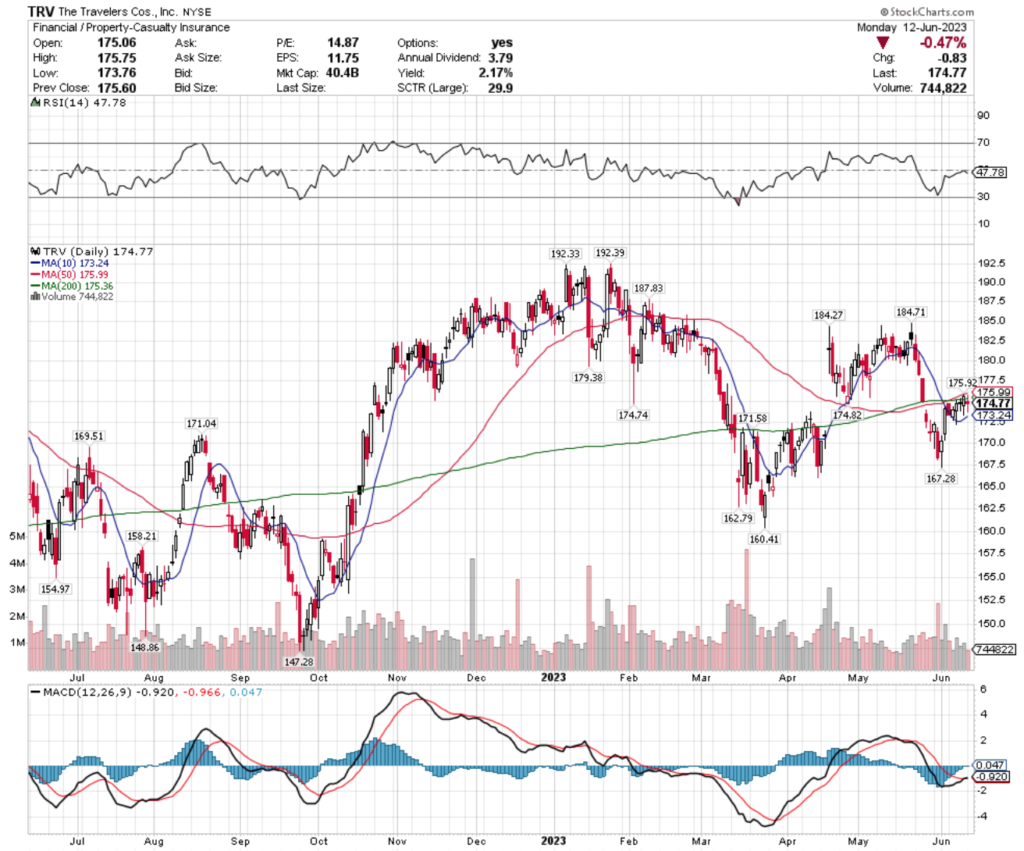
Kroger Co. KR Stock’s Technical Performance Broken Down
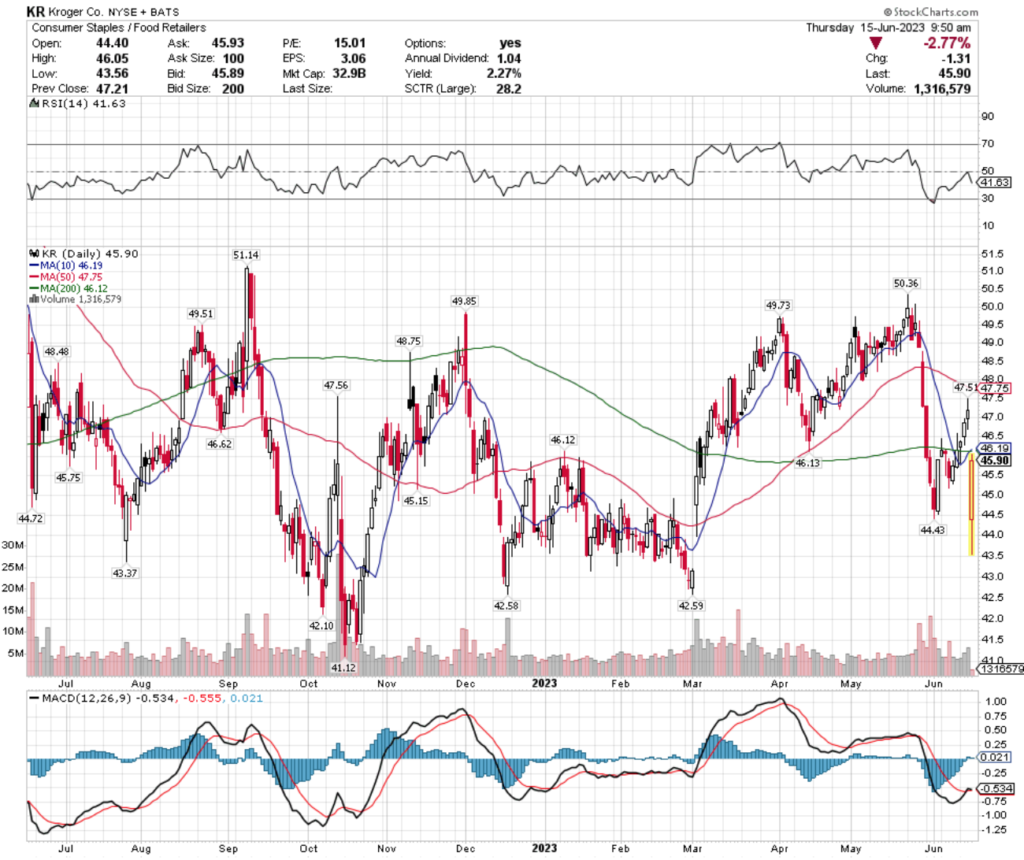
KR Stock Price: $45.90
10 Day Moving Average: $46.19
50 Day Moving Average: $47.75
200 Day Moving Average: $46.12
RSI: 41.63
MACD: -0.534, -0.555, 0.021
Yesterday, KR stock completed a bullish MACD crossover, however their price gapped down -2.77% this morning.
Their RSI is at 41.63, which is trending back towards oversold, after being around the neutral 50 point before today’s session.
Recent trading volumes have been lighter than average compared to the year prior, as investors are digesting the Federal Reserve rates decision that was delivered yesterday & figuring out how it will impact their allocations in the near-term, with the uncertainty being further underscored by yesterday’s spinning top candlestick.
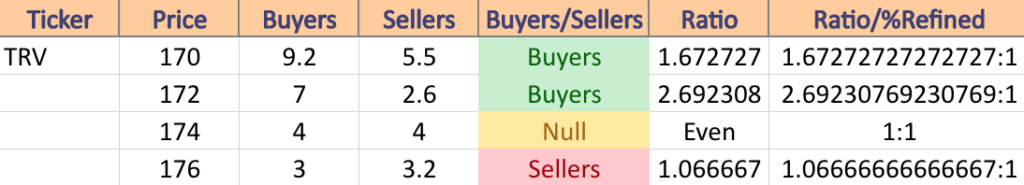
Investors should be watching how KR stock behaves at support levels in the near-term to assess where they might like to make an entry into a position once the market returns to a stable uptrend.
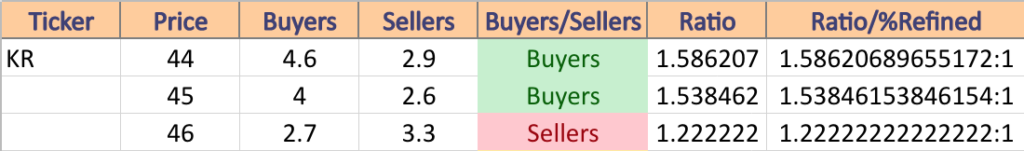
KR stock has support at the $45.75 (Volume Sentiment: Buyers, 1.54:1), $45.15 (Volume Sentiment: Buyers, 1.54:1) , $44.72 (Volume Sentiment: Buyers, 1.59:1) & $44.43/share (Volume Sentiment: Buyers, 1.59:1) price levels, with resistance at the $46.12 (Multiple Touch-points, including 200 Day Moving Average; Volume Sentiment: Sellers, 1.22:1), $46.13 (Volume Sentiment: Sellers, 1.22:1) , $46.19 (10 Day Moving Average; Volume Sentiment: Sellers, 1.22:1) & $46.62/share (Volume Sentiment: Sellers, 1.22:1) price levels.
Kroger Co. KR Stock As A Long-Term Investment
Long-term oriented investors will like KR stock’s 15.43 P/E (ttm), but may find their 3.37 P/B (mrq) to be a bit higher than they’d like.
They recently reported 5.4% Quarterly Revenue Growth Y-o-Y, with -20.2% Quarterly Earnings Growth Y-o-Y, which investors may want to dig deeper into.
Their balance sheet will also require a more thorough review, with $1.01B of Total Cash (mrq) & $20.48B of Total Debt (mrq).
KR stock pays a 2.1% dividend, which appears to be sustainable in the long-term, as their payout ratio is 30.72%.
80.98% of KR stock’s outstanding share float is owned by institutional investors.
Kroger Co. KR Stock As A Short-Term Trade Using Options
Traders with shorter time horizons can trade options to profit from movements in KR stock’s price, while protecting their portfolio from broader market volatility.
I am looking at the contracts with the 7/21 expiration date.
The $45, $42 & $44 call options are all in-the-money, listed from highest to lowest level of open interest.
The $46, $48 & $47 puts are also all in-the-money, with the former strike being more liquid than the latter two.
Tying It All Together
KR stock has many interesting characteristics that traders & investors will find appealing.
Investors will like their dividend yield & valuation metrics, but may want to look more deeply into their recent growth performance & balance sheet structure before investing.
Traders will like their recent technical performance, as well as how liquid their options are.
All-in-all, it is worth taking a closer look into how KR stock fits into your portfolio strategy.
*** I DO NOT OWN SHARES OR OPTIONS CONTRACT POSITIONS IN KR STOCK AT THE TIME OF PUBLISHING THIS ARTICLE ***