XLK, the Technology Select Sector SPDR Fund ETF has had a seesaw of a year, gaining +16.72% over the past year, including a remarkable +51.89% since their 52-week low in April of 2025, while sitting just -2.54% below their 52-week high set last week (all figures are ex-distributions).
Much of this is due to the hype surrounding Artificial Intelligence, chips & Semiconductors, as well as many of the other cloud, hardware & software names that have been prominent for many years.
Some of their largest holdings include NVIDIA Corp. (NVDA), Microsoft Corp. (MSFT), Apple Inc. (AAPL), Broadcom Inc. (AVGO), Palantir Technologies Inc. (PLTR), Advanced Micro Devices (AMD), Cisco Systems Inc. (CSCO), Salesforce Inc. (CRM) & International Business Machines Corp. (IBM).
Markets are hovering near all-time highs, which means it is wise to be prepared for a pull-back, which as I’ve noted before will likely be lead by the NASDAQ & the tech names that heavily comprise the index, making it a wise idea to check in on volume sentiments from recent history for XLK.
The note below can be beneficial for understanding the broader market, as well as for assessing the strength or weakness of any component stock holdings.
It is also designed for analyzing the strength/weakness of support/resistance levels for XLK, which can be beneficial for making decisions about positioning.
It is not intended as financial advice, just something to consider when performing your own due diligence.
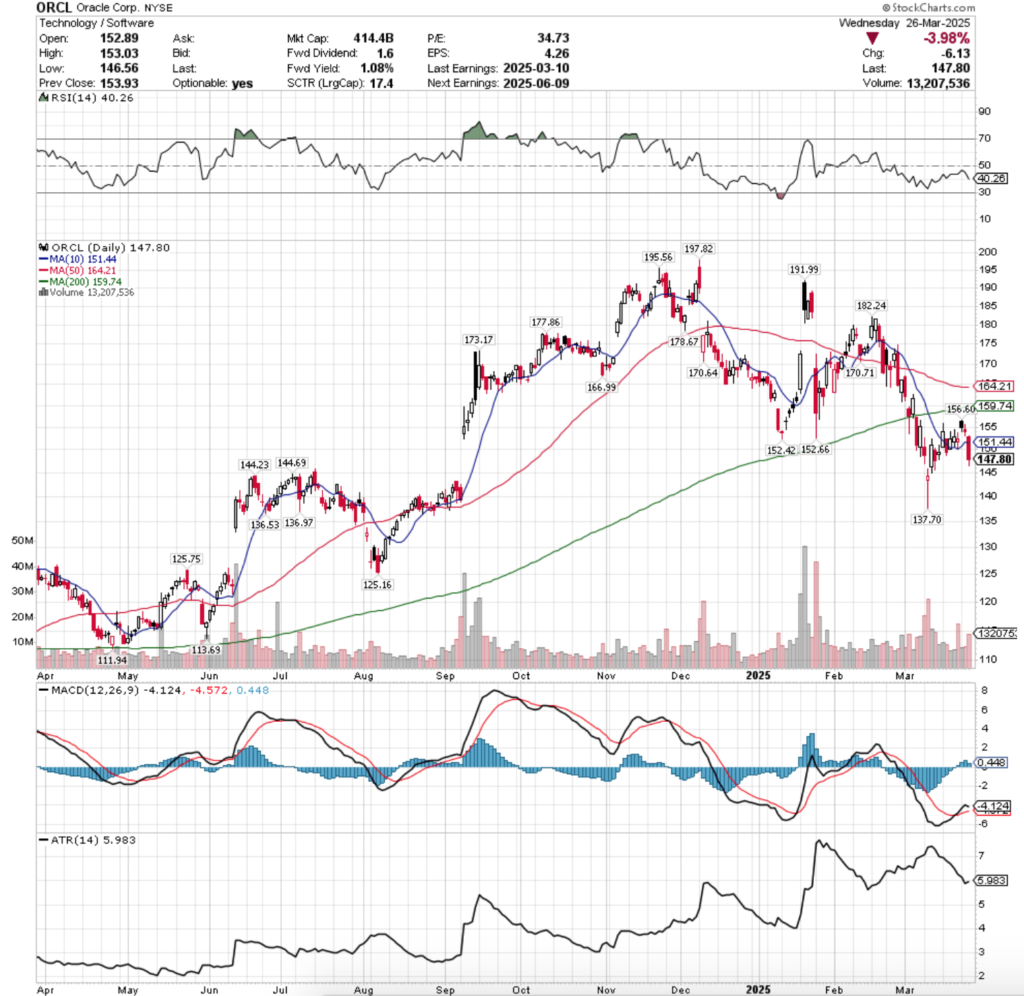
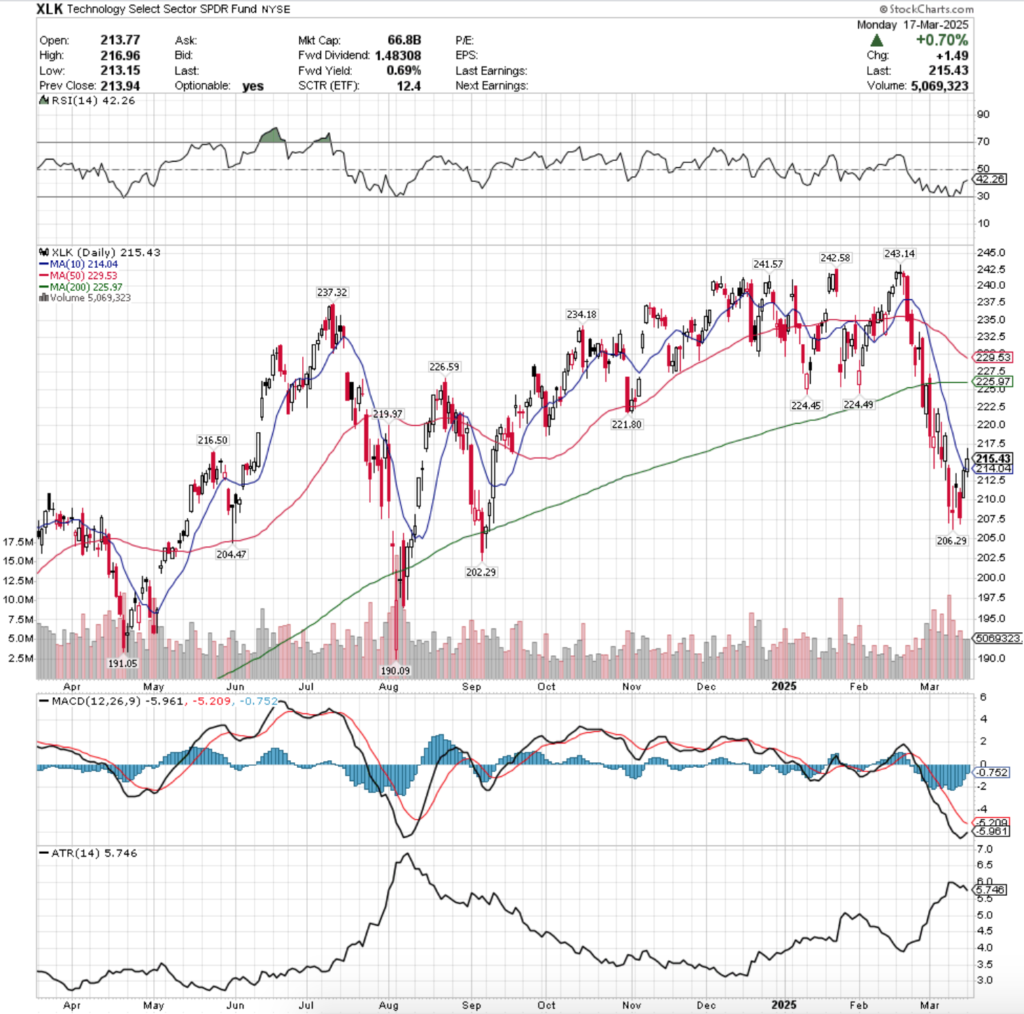
Technical Analysis Of XLK, The Technology Select Sector SPDR Fund ETF

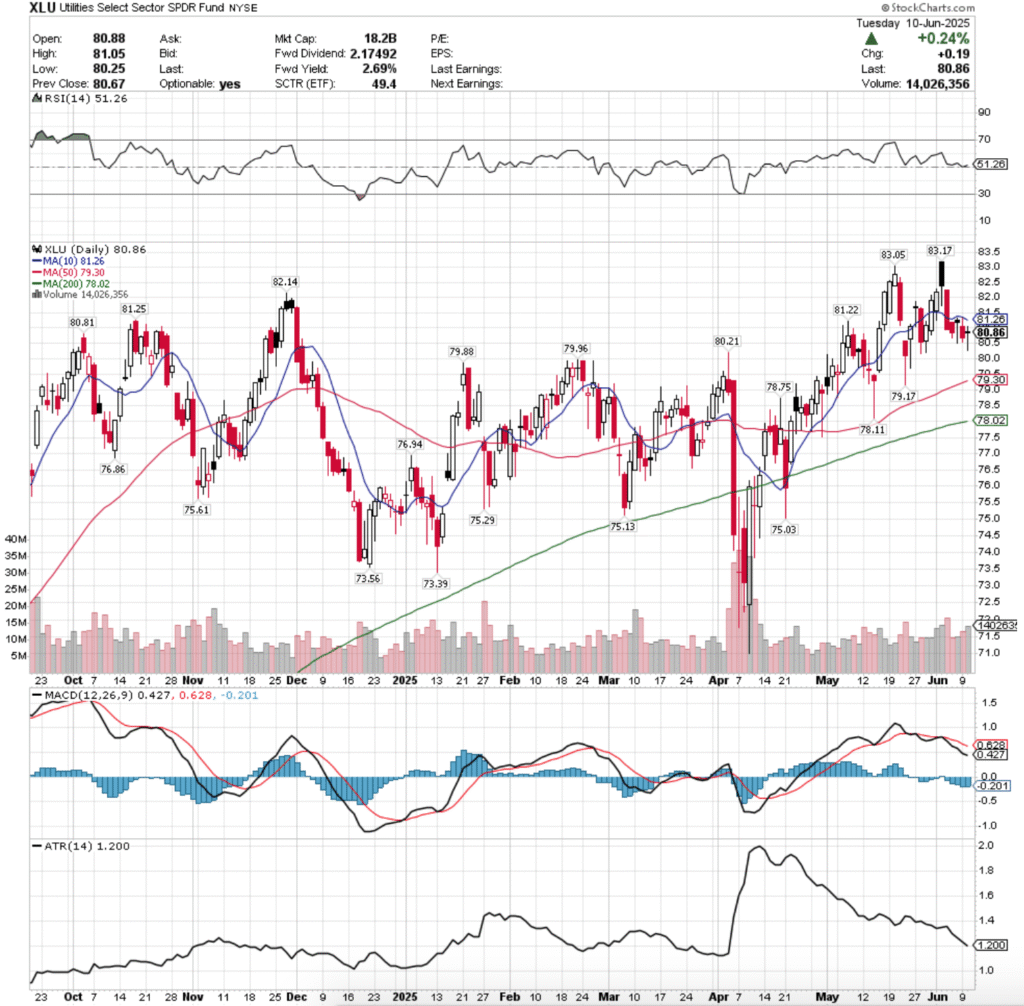
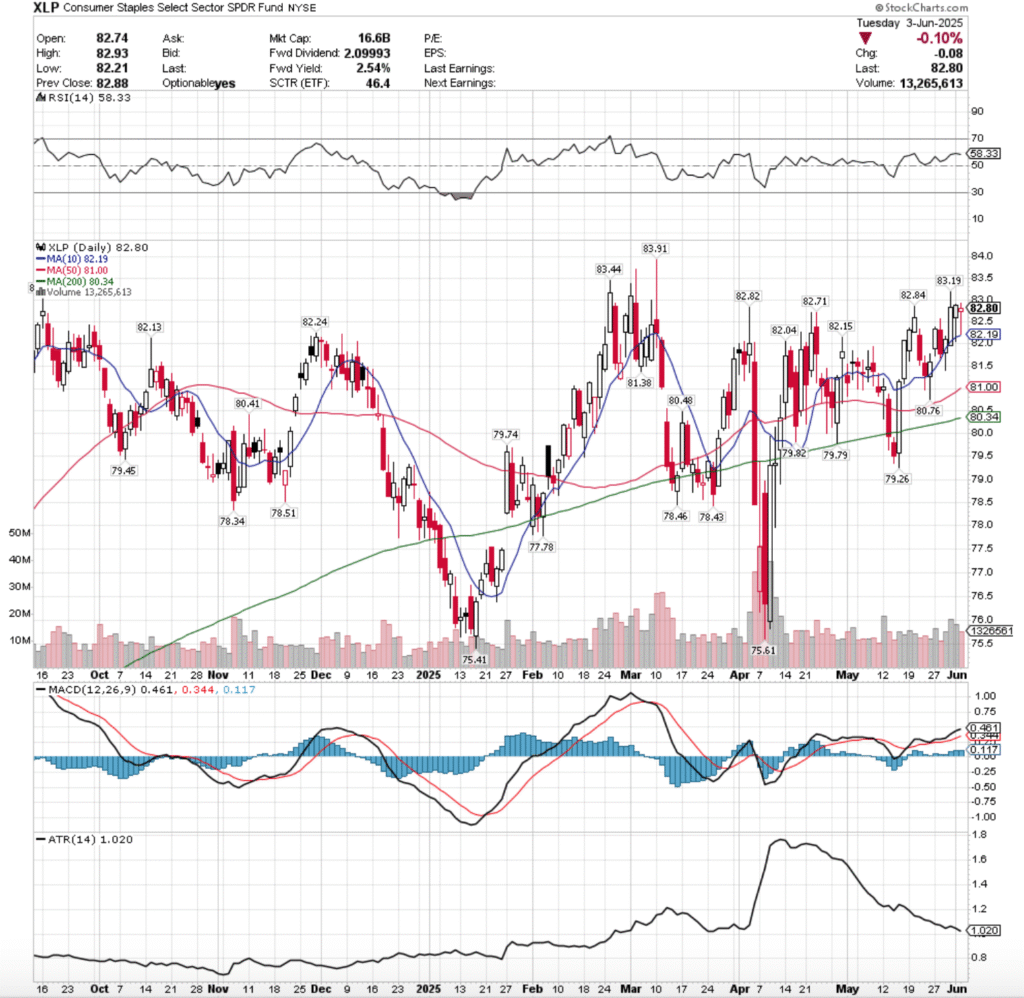
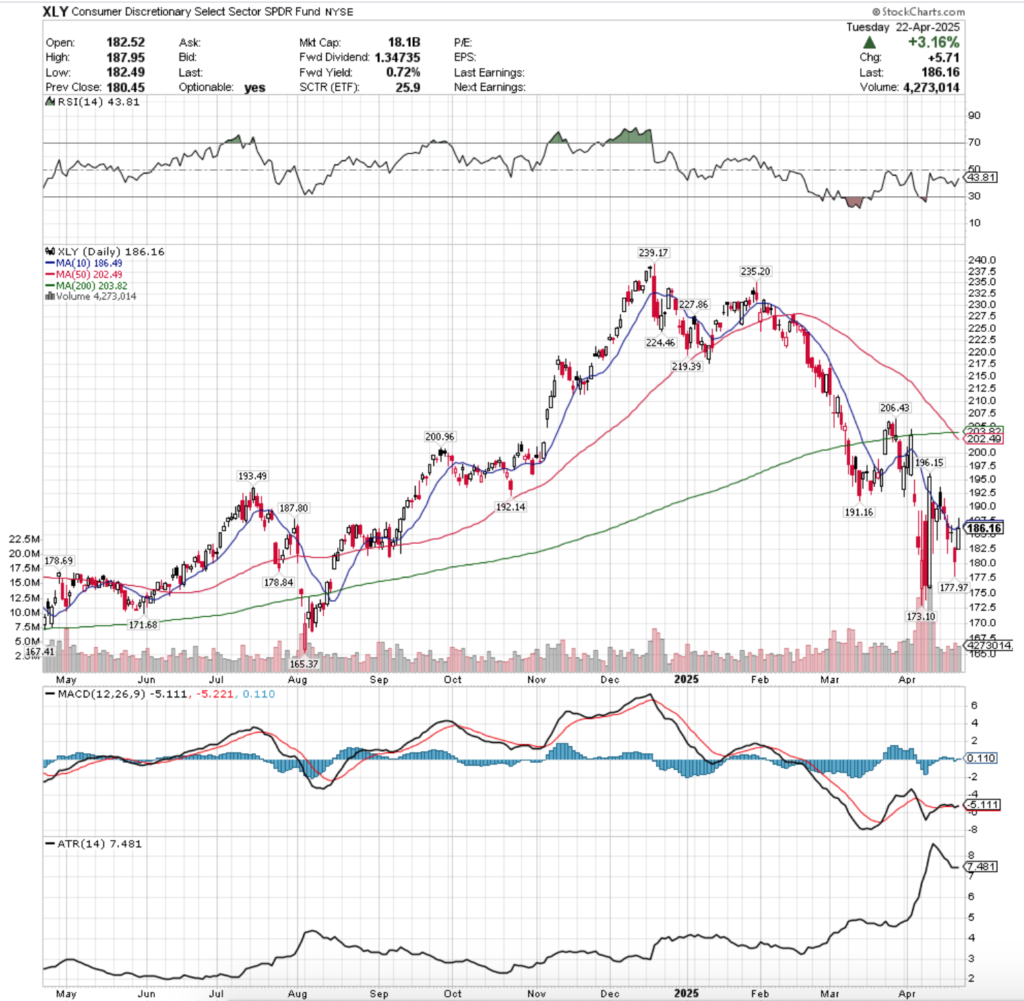
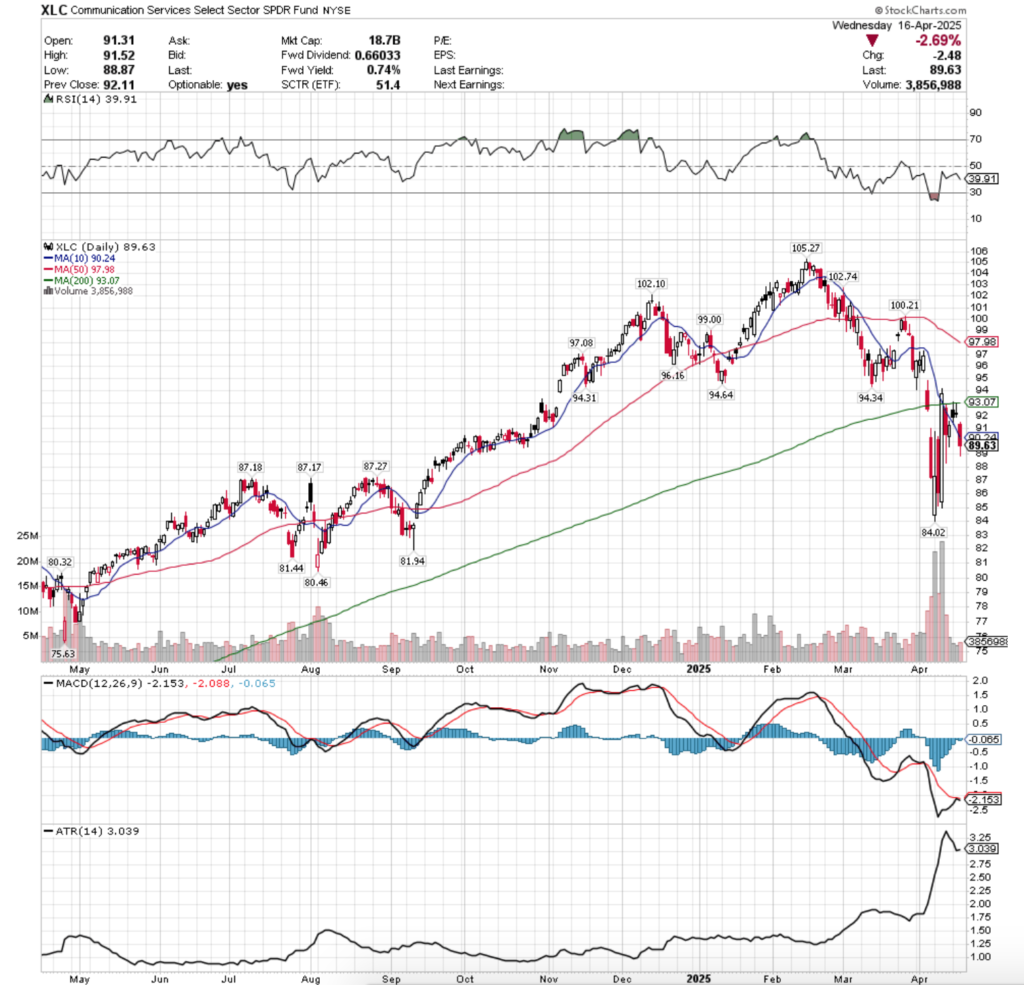
Their RSI is a hair above the neutral mark, sitting at 50.14, while their MACD is bearish & its histogram suggests that this will be the prevailing trend in the near-to-mid-term.
Volumes have been +27.2% higher than the prior year’s average this past week & a half (6,645,714 vs. 5,224,622), which should raise eyebrows given that three of the top four highest volume sessions in that time were on declines.
Last week began on a note similar to QQQ & the other major indexes (weekly note here), with the day’s candle being just shy of forming a bearish engulfing pattern with the prior Friday’s, with light volume adding to the uncertainty.
Tuesday opened lower, declined down to test the support of the 10 day moving average, before plowing higher for a daily advance of +1.55%, but again, volume was lackluster & it became clear that there was a bit of fear in the air.
Wednesday opened on a gap higher to set a new all-time high, but profits were taken & the highest advancing session of the period described wound up closing lower than it opened, again signaling that market participants were looking for the door.
Thursday brought the beginning of the exodus, when the highest volume session of the week & a half period opened on a gap down, and was only able to close higher than it opened due to the high volume of traders, but the bearish sentiment had entered the room.
Friday opened lower & set the stage for a cool down period, declining to test the 10 DMA’s support, but not breaking down through it & it was able to close above the support level heading into the weekend, but it appeared wounded.
Monday opened the new week up in-line with the 10 day moving average, & managed to squeak out an advance of +0.21%, but the low volume was unconvincing & forebode that there was trouble on the horizon.
Tuesday featured the 10 day moving average’s support giving out on elevated volume, likely indicating that there is more pain on XLK’s near-term horizon & their RSI/MACD confirm that there’s a bit of room to run to the downside.
The upside case from here requires advances that are not due to gaps that have sustained high volume that is comparable to the past week & a half, but with less declining volume, as breaking through all-time highs eventually requires more steam to be maintained.
The consolidation case is XLK oscillates around the 10 DMA & then between the 10 & 50 DMA’s as the latter approaches closer to the price in the coming days.
The downside case begins with all eyes on the strength of the 50 day moving average, which resides in a historic Seller Zone (1.09:1), which is cause for caution as well, given that there is -5.3% between the 50 DMA & the next highest support level, which provides room for free fall.
The good news in the event that that happens is that between $240.75-242.31 there are a few support levels, but that loses meaning when you realize how close the 200 DMA is.
If that zone gets tested, the long-term trendline comes into play, which brings into play the possibility of the window created by the gap up in May being filled.
This makes it important to have a gauge as to how market participants have behaved historically at these price levels in order to gain insight into how they may behave again in the future.
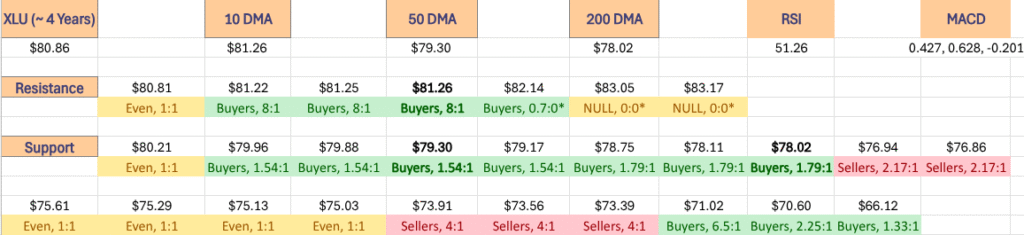
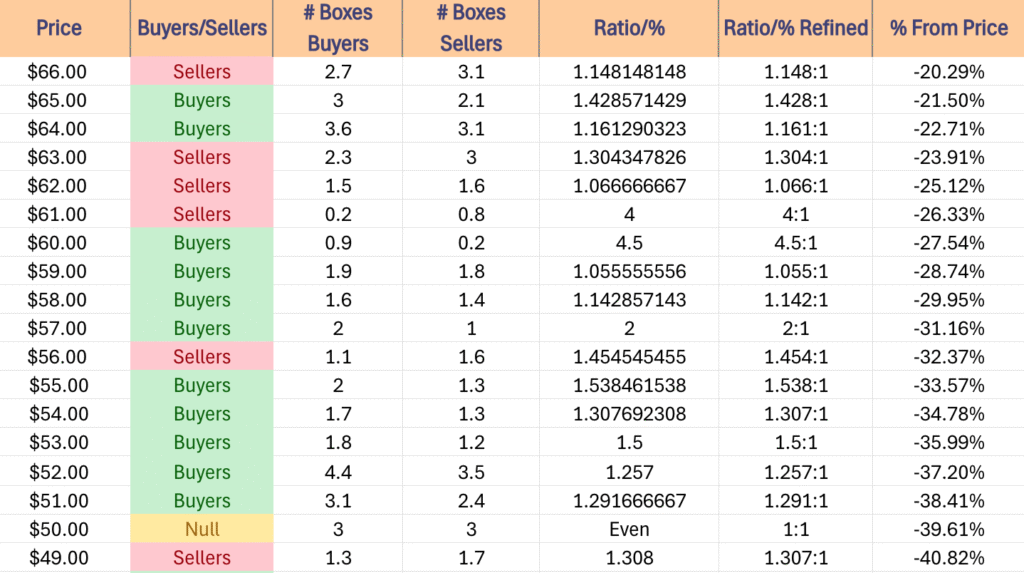
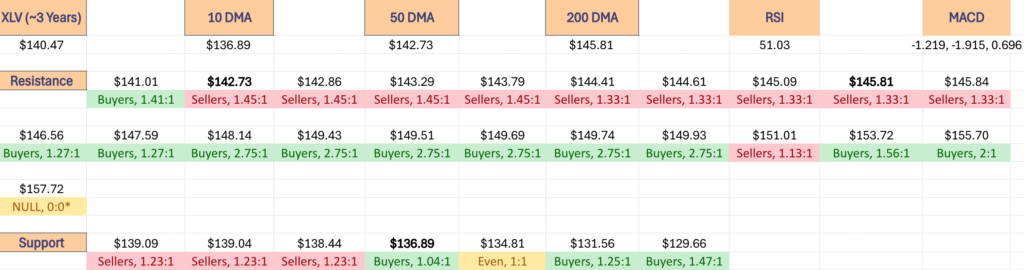
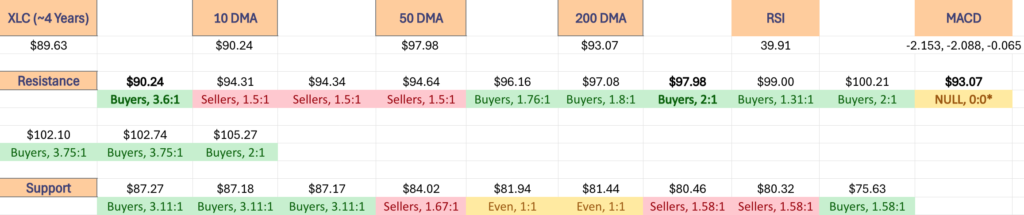
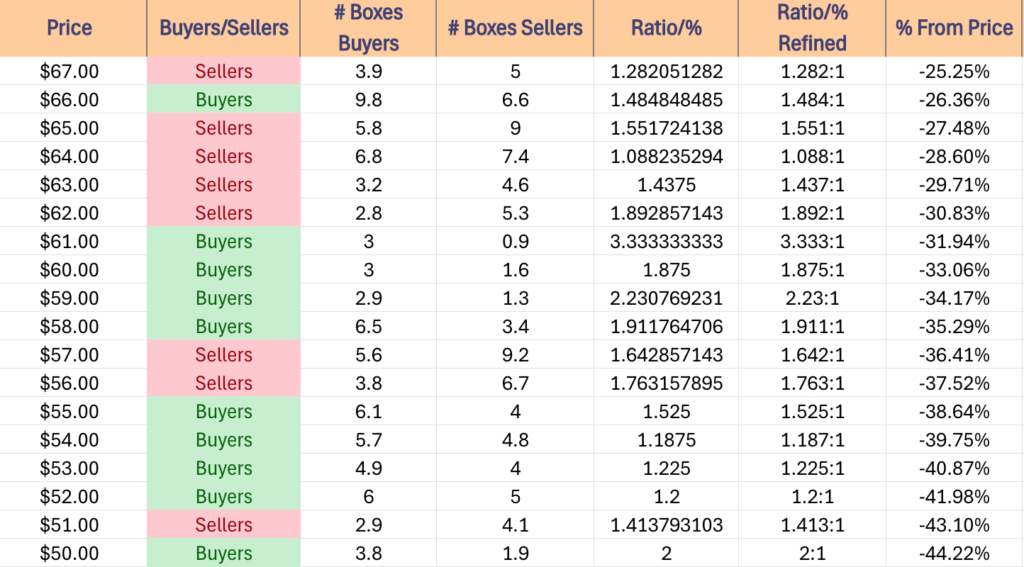
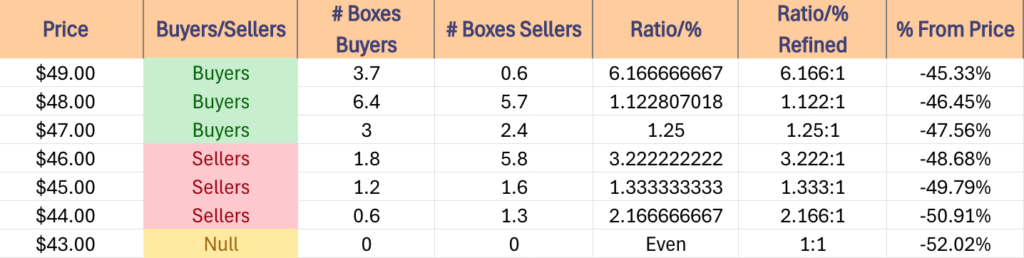
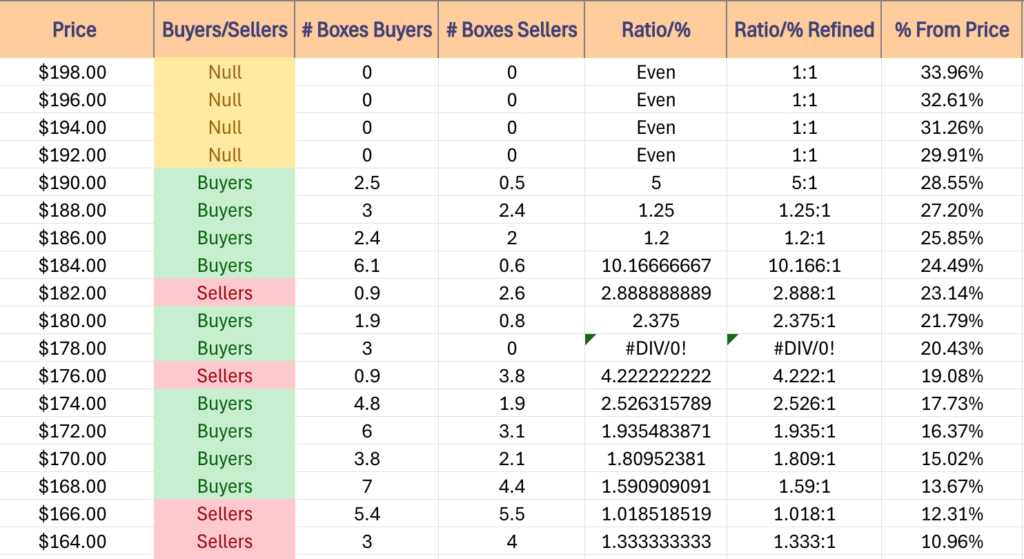
The section below lays out the one year support & resistance levels of XLK, as well as the volume sentiment of the price levels that they’ve traded at over the past ~3 years.
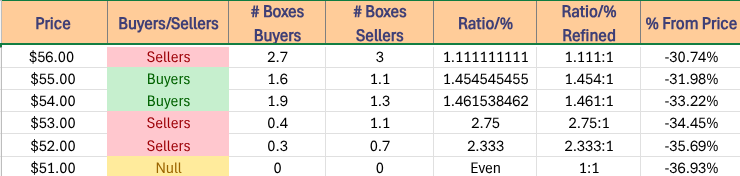
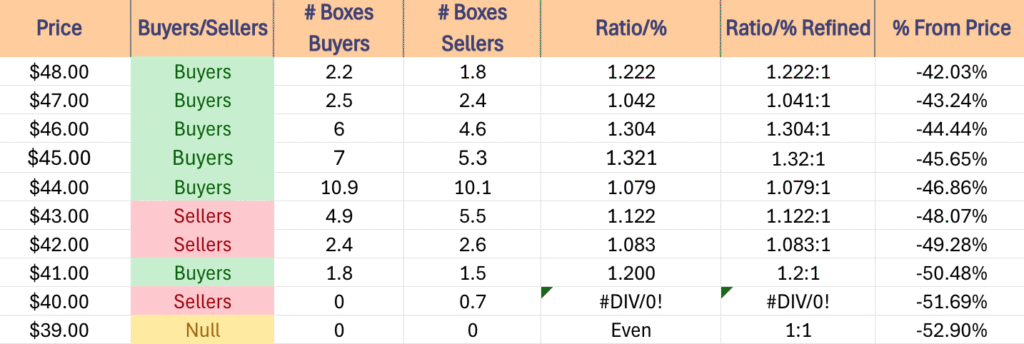
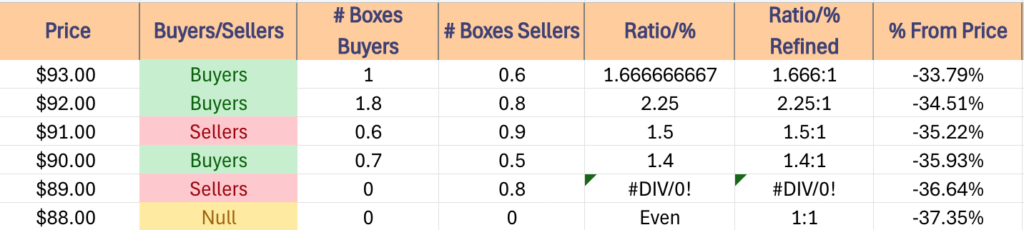
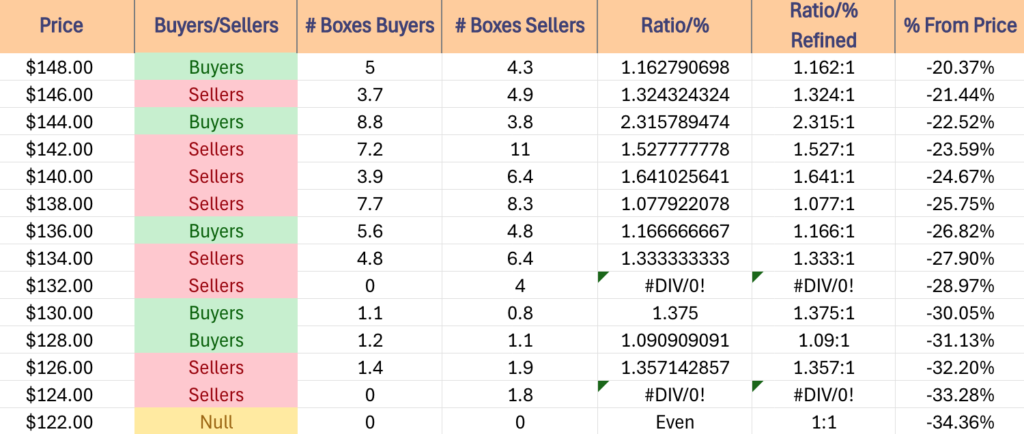
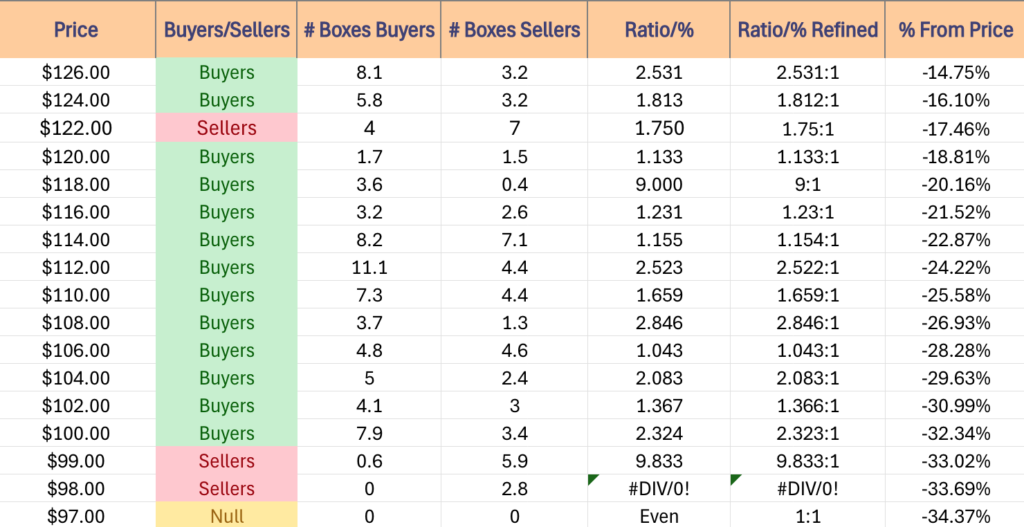
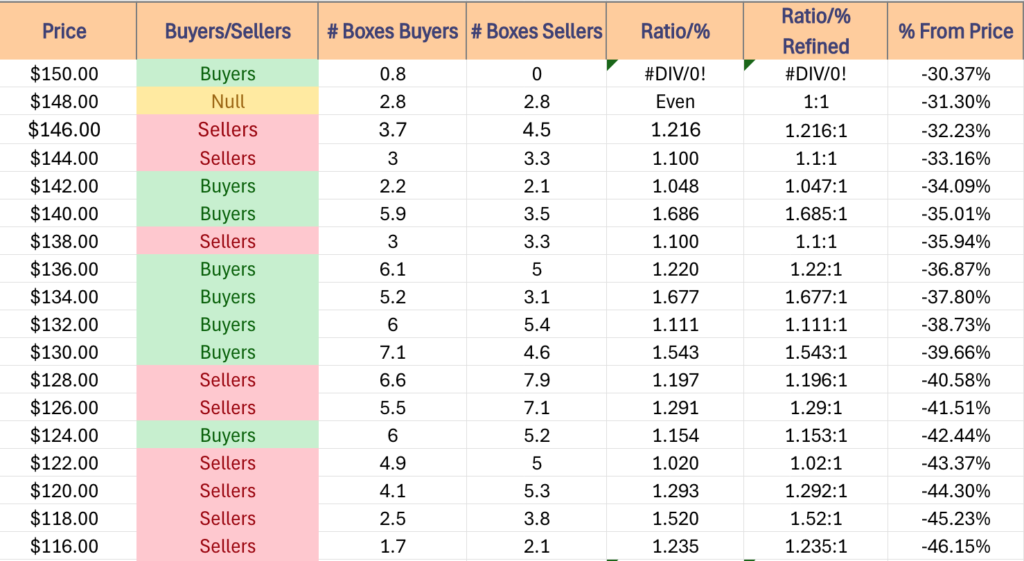
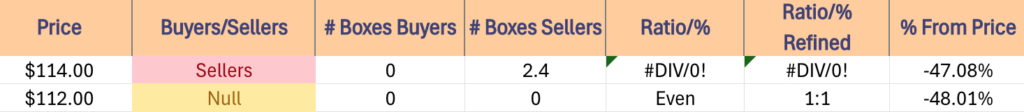
Note that while there were some prices in that range below the table’s cut off point, the volumes there relative to the volumes at the levels listed were neglible & would continue the “NULL, 0:0*”‘s shown at the $110/share zone.
Price Level:Volume Sentiment Analysis For XLK, The Technology Select Sector SPDR Fund ETF
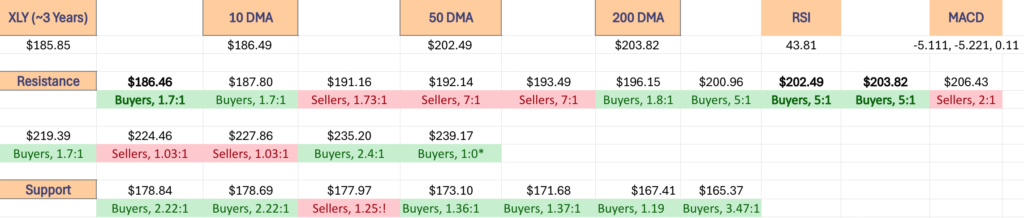
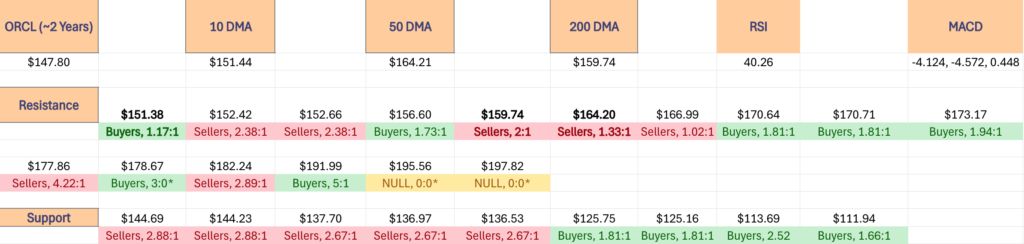
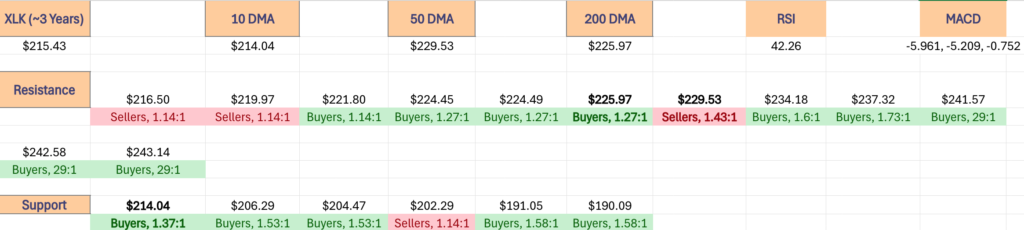
The top table below shows the support & resistance levels of XLK from the past year’s chart, as well as their price level:volume sentiment at each from data covering the past ~3 years, using Tuesday 8/19/2025’s closing data for their price & moving averages/other technicals, which can be used as a barometer for estimating the expected strength/weakness of each of the support/resistance levels.
The 10, 50 & 200 day moving averages are denoted with bold.
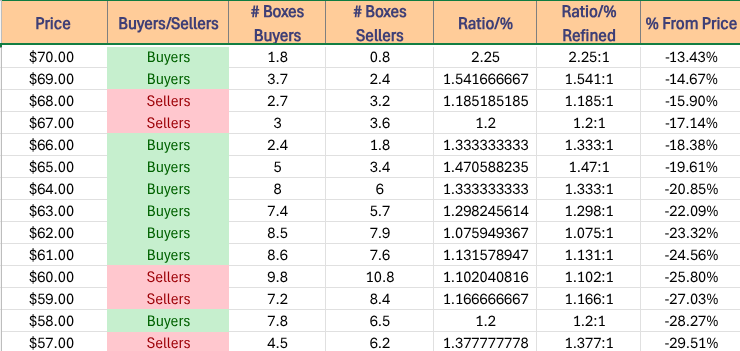
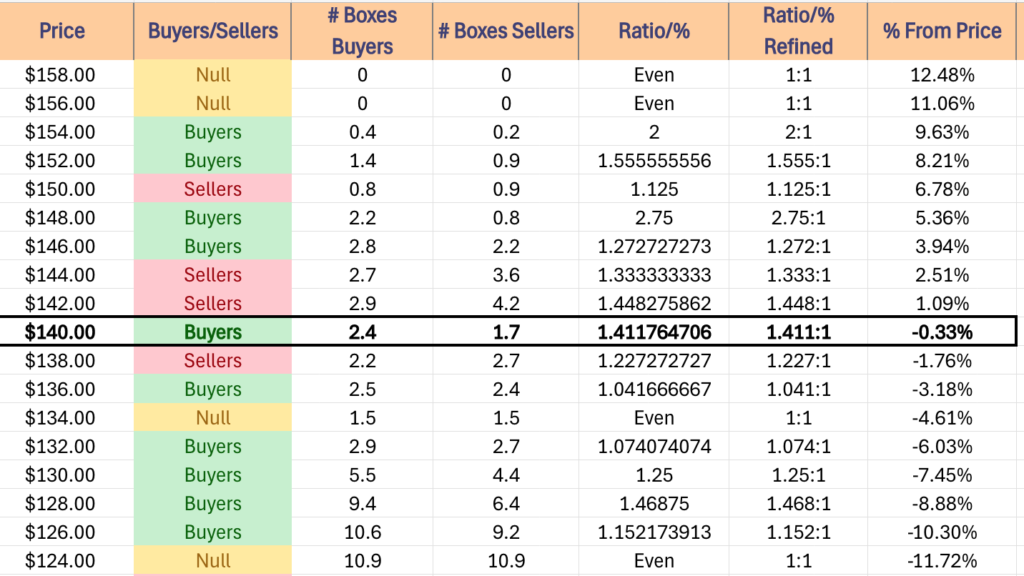
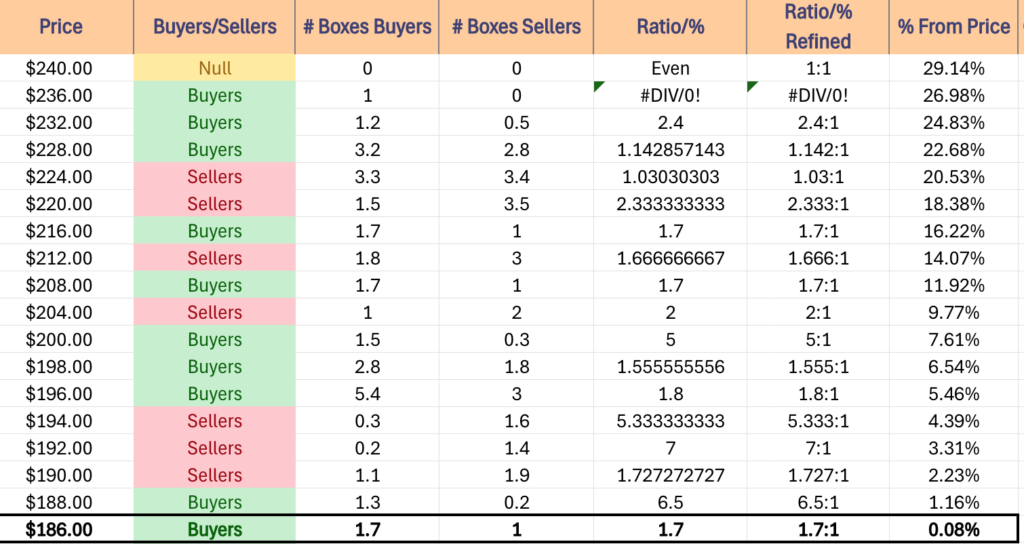
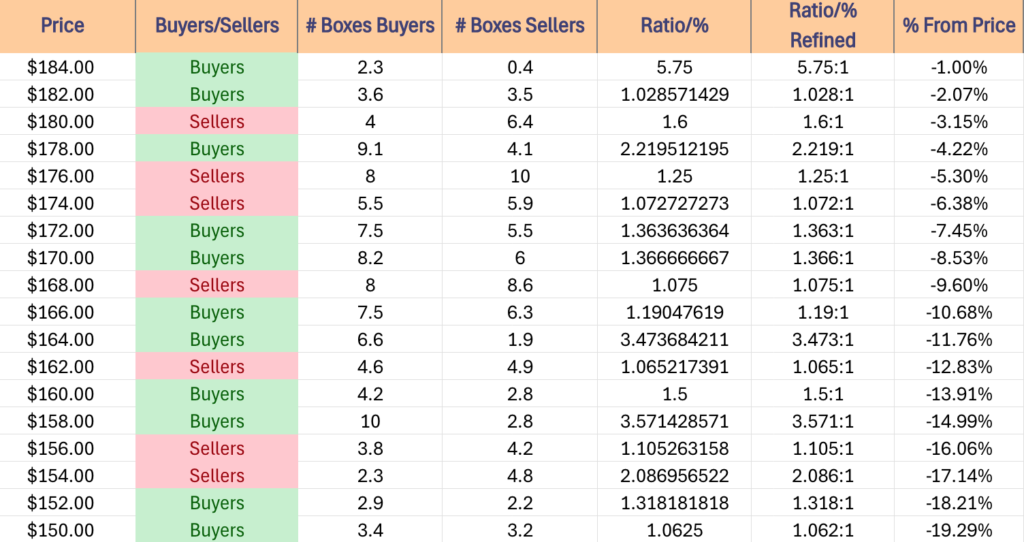
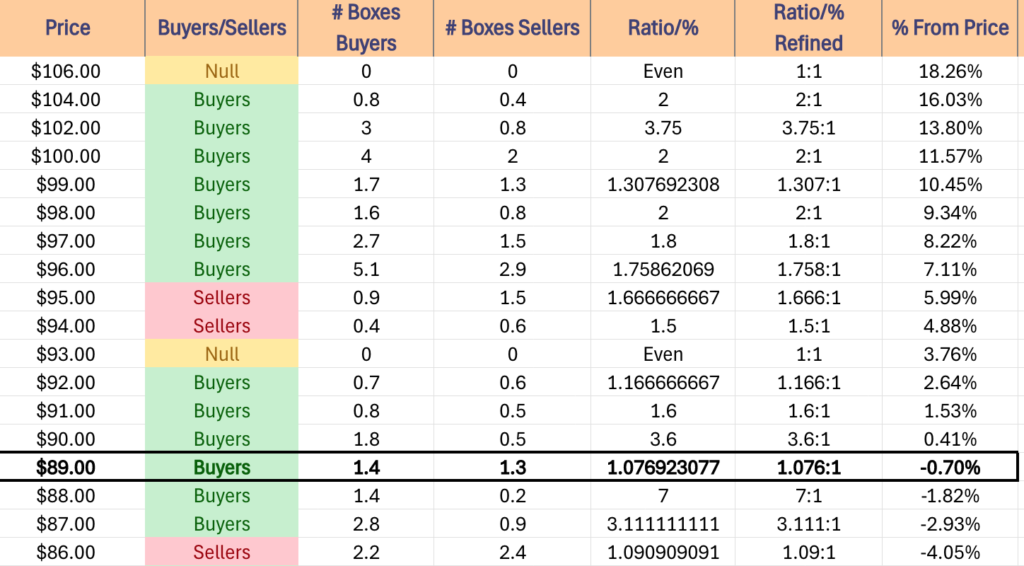
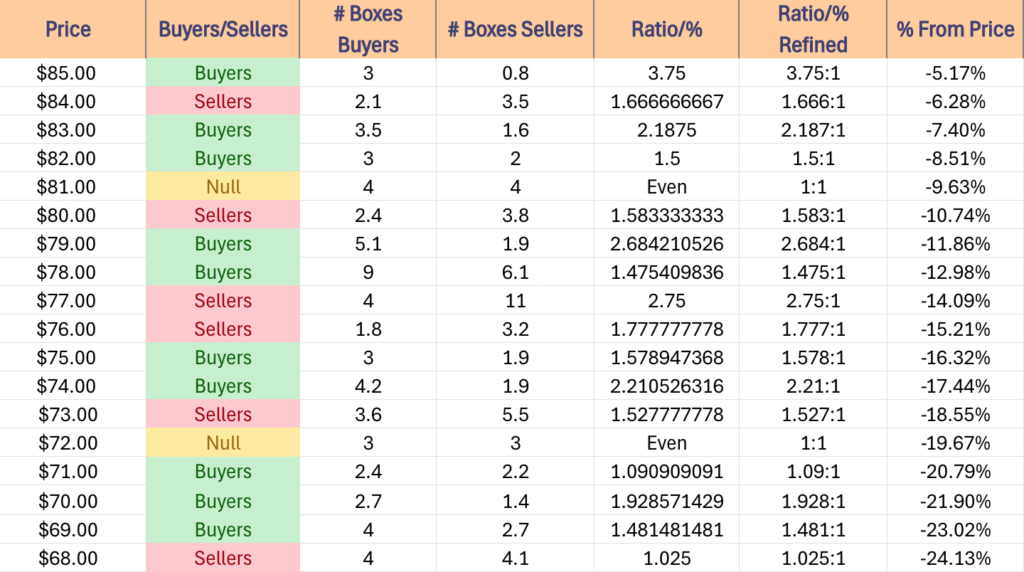
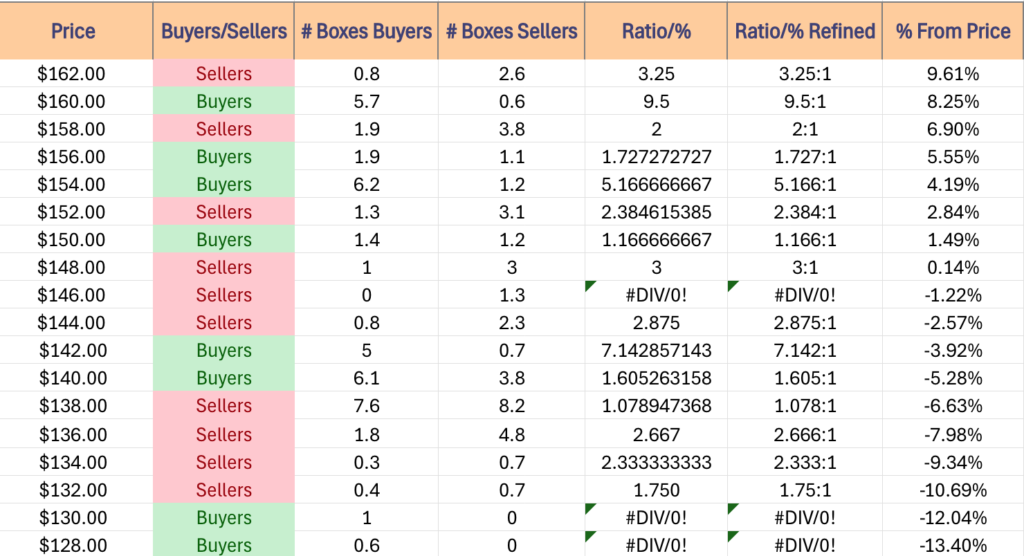
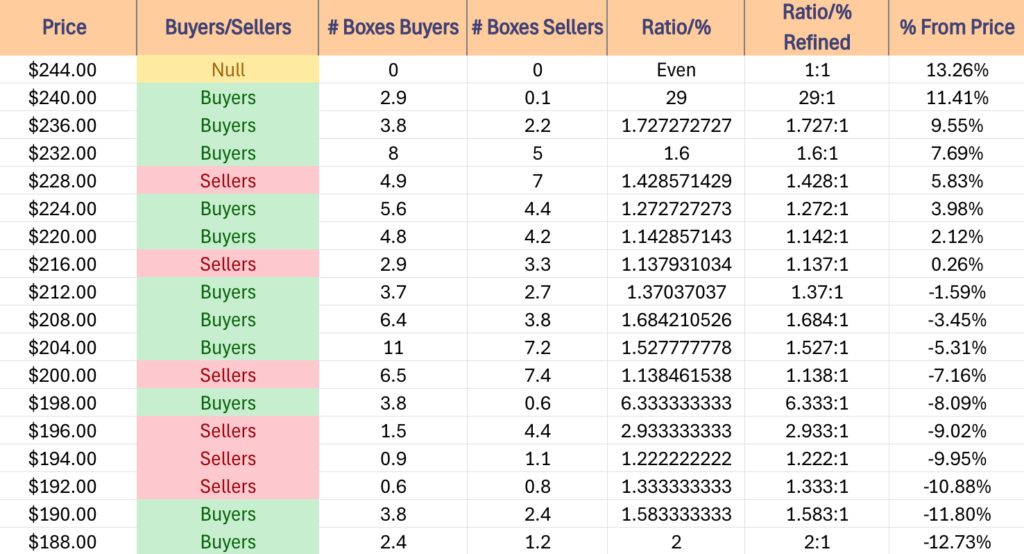
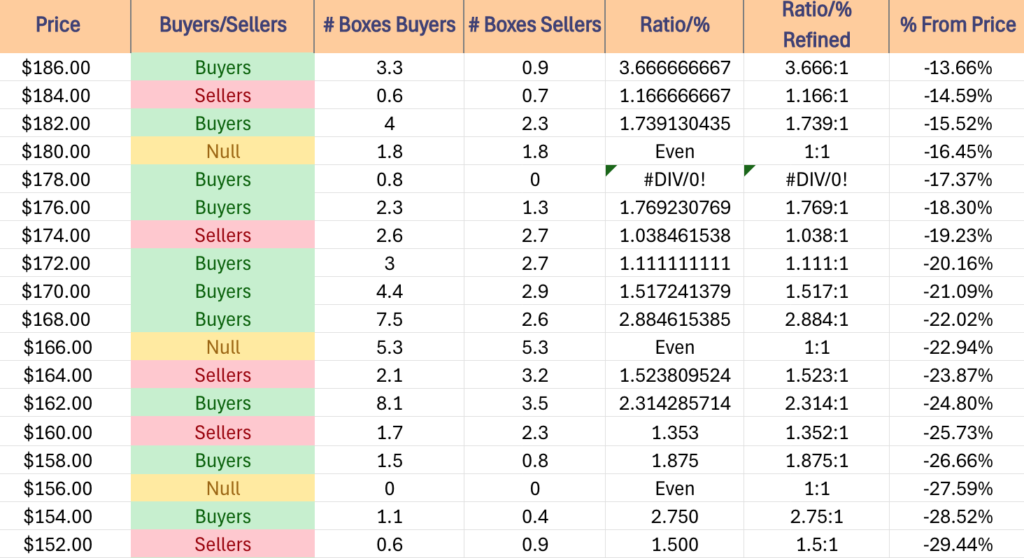
The next tables show the volume sentiment at each individual price level XLK has traded at over the past ~3 years.
Beneath them is a copy & pasteable list of the same data, where the support/resistance levels are denoted in bold.
All ratios with “0” in the denominator are denoted with a “*”.
NULL values are price levels that had limited trading volume, whether it be due to gaps, quick advances or they are at price extremes; in the event that they are retested & there is more data they would have a distinct “Buyers”, “Sellers” or “Even” title.
This is not intended as financial advice, but rather another tool to consider when performing your own research & due diligence on XLK.


$272 – NULL – 0:0*, +4.02% From Current Price Level
$268 – Buyers – 0.6:0*, +2.49% From Current Price Level
$264 – Buyers – 5.5:1, +0.96% From Current Price Level – 10 Day Moving Average*
$260 – Buyers – 2.31:1, -0.57% From Current Price Level – Current Price Level*
$256 – Buyers – 1.58:1, -2.1% From Current Price Level
$252 – Sellers – 1.09:1, -3.63% From Current Price Level – 50 Day Moving Average*
$248 – Even – 1:1, -5.16% From Current Price Level
$244 – Buyers – 0.6:0*, -6.69% From Current Price Level
$240 – Buyers – 3.23:1, -8.22% From Current Price Level
$236 – Buyers – 2.1:1, -9.75% From Current Price Level
$232 – Buyers – 1.53:1, -11.28% From Current Price Level – 200 Day Moving Average*
$228 – Sellers – 1.01:1, -12.81% From Current Price Level
$224 – Sellers – 1.02:1, -14.34% From Current Price Level
$220 – Buyer s- 1.23:1, -15.87% From Current Price Level
$216 – Buyers – 1.39:1, -17.4% From Current Price Level
$212 – Buyers – 1.18:1, -18.93% From Current Price Level
$208 – Buyers – 1.5:1, -20.46% From Current Price Level
$204 -Buyers – 1.49:1, -21.99% From Current Price Level
$200 – Buyers – 1.29:1, -23.52% From Current Price Level
$198 – Buyers – 1.84:1, -24.28% From Current Price Level
$196 – Sellers – 2.6:1, -25.04% From Current Price Level
$194 – Sellers – 4.45:1, -25.81% From Current Price Level
$192 – Buyers – 1.12:1, -26.57% From Current Price Level
$190 – Buyers – 1.32:1, -27.34% From Current Price Level
$188 – Buyers – 3.08:1, -28.1% From Current Price Level
$186 – Buyers – 2.11:1, -28.87% From Current Price Level
$184 – Buyers – 2.2:1, -29.63% From Current Price Level
$182 – Buyers – 1.55:1, -30.4% From Current Price Level
$180 – Sellers – 2.36:1. -31.16% From Current Price Level
$178 – Sellers – 1.38:1, -31.93% From Current Price Level
$176 – Buyers – 1.39:1, -32.69% From Current Price Level
$174 – Buyers – 2.4:0*, -33.46% From Current Price Level
$172 – Sellers – 1.44:1, -34.22% From Current Price Level
$170 – Buyers – 1.77:1, -34.99% From Current Price Level
$168 – Buyers – 2.24:1, -35.75% From Current Price Level
$166 – Buyers – 1.62:1, -36.52% From Current Price Level
$164 – Sellers – 1.85:1, -37.28% From Current Price Level
$162 – Buyers – 3.2:1, -38.05% From Current Price Level
$160 – Sellers – 1.17:1, -38.81% From Current Price Level
$158 – Sellers – 1.75:1, -39.58% From Current Price Level
$156 – Buyers – 0.9:0*, -40.34% From Current Price Level
$154 – Buyers – 3:1, -41.11% From Current Price Level
$152 – Sellers – 0.6:0*, -41.87% From Current Price Level
$150 – Buyers – 1.5:1, -42.64% From Current Price Level
$148 – Buyers – 1.65:1, -43.4% From Current Price Level
$146 – Even – 1:1, -44.17% From Current Price Level
$144 – Sellers – 6:1, -44.93% From Current Price Level
$142 – Buyers – 5:1, -45.7% From Current Price Level
$140 – Buyers – 1.96:1, -46.46% From Current Price Level
$138 – Sellers – 2.75:1, -47.23% From Current Price Level
$136 – Buyers- 1.9:1, -47.99% From Current Price Level
$134 – Buyers – 3:1, -48.76% From Current Price Level
$132 – Buyers – 1.06:1, -49.52% From Current Price Level
$130 – Buyers – 1.23:1, -50.28% From Current Price Level
$128 – Buyers – 2.5:1, -51.05% From Current Price Level
$126 – Sellers – 1.95:1, -51.81% From Current Price Level
$124 – Sellers – 1.04:1, -52.58% From Current Price Level
$122 – Buyers – 1.43:1, -53.34% From Current Price Level
$120 – Buyers – 1.44:1, -54.11% From Current Price Level
$118 – Sellers – 1.21:1, -54.87% From Current Price Level
$116 – Buyers – 1.6:1, -55.64% From Current Price Level
$114 – Sellers – 2.6:0*, -56.4% From Current Price Level
$112 – NULL – 0:0*, -57.17% From Current Price Level
$110 – NULL – 0:0*. -57.93% From Current Price Level
*** I DO NOT OWN SHARES OR OPTIONS CONTRACT POSITIONS IN XLK AT THE TIME OF PUBLISHING THIS ARTICLE***