Markets have spent a lot of time reaching new all-time (SPY, QQQ & DIA) & 52-week highs (IWM) since our last index ETF price level:volume sentiment check in in April.
Throw in political uncertainty, geo-political conflicts globally & earnings season that are coming with high expectations & there is a recipe for increased volatility in the coming months.
With this in mind, the article below outlines the Buyer:Seller (or Seller:Buyer) sentiment at the various price levels that SPY (S&P 500), QQQ (NASDAQ 100), IWM (Russell 2000) & DIA (Dow Jones Industrial Average) ETFs have traded at over the past few years to gain insight into how market participants may feel at different support & resistance levels.
Due to the aforementioned new high price levels that each index ETF has been experiencing & the subdued volumes that we have seen for the past ~10 weeks most of the higher range price levels are still “NULL”, meaning that they are not 0, but there is not enough data currently to work with.
Additionally, you will notice as you go through the numbers that the higher prices tend to skew more towards the buyers, as there have been limited downside tests against these price levels, and the low volumes have not helped this.
Similarly, you will notice that there tend to be more sellers towards the lower ends of the price ranges.
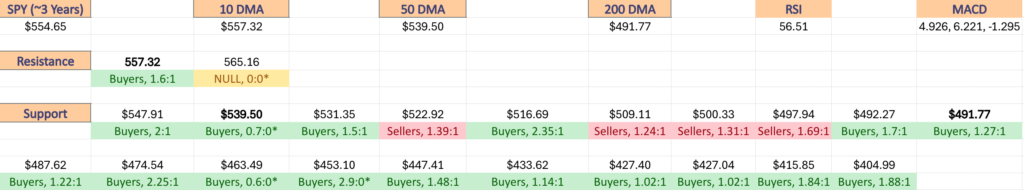
Each section below contains a view of each index ETF’s chart (for a technical breakdown of each ETF’s chart please see this past weekend’s market review note), as well as a list of their current one year support & resistance levels with the volume sentiment noted beneath it on the table.
There is an additional table beneath this table with each price level’s sentiment, as well as a typed text version below that is able to be copied & pasted.
Note that “NULL, 0:0*” values denote areas that each name has traded at but with limited volume data to work with from a comparison standpoint in terms of creating a ratio of buyers:sellers (or vice versa).
Also, prices that do have a ratio of buyers:sellers (or vice versa) where the denominator is 0 are denoted with an asterisk “*” as well.
In the written lists of the price levels & volume sentiments the price levels that contain support & resistance levels are marked in BOLD.
Recall that at price extremes such as the highs that we have recently hit there will tend to be skewed data due to the small sample size & factor that into how you interpret each price level’s reported sentiment.
This is intended to serve as an additional tool to use during your due diligence process & is not meant to replace doing your own research & is not financial advice.
Price Level:Volume Sentiment Analysis For SPY (S&P 500) ETF
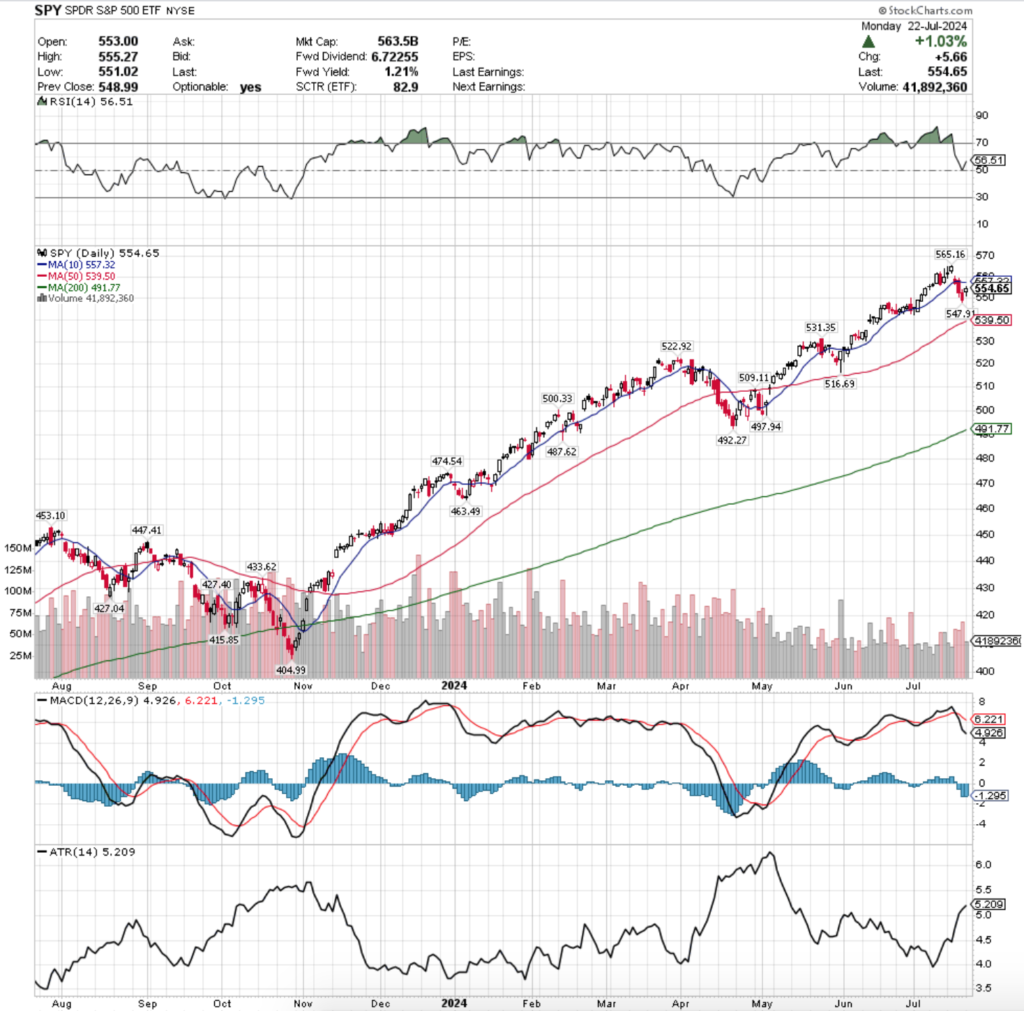
SPY, the SPDR S&P 500 ETF has been experiencing low volume levels since the last sentiment analysis note (4/24/24) & is coming off of a fresh all-time high.
They’ve got the least one year support levels due to the way their price has advanced, making the list below even more important to review in the near-term, especially as their 10 day moving average has curled over bearishly above the price & is applying downward pressure on it.
One interesting thing to note is that in the event of a 10% decline from their recent all-time high they dive into a seller dominated area in terms of their support levels, which get more & more seller oriented as the price gets lower.
Should that be tested it will be interesting to see if the seller ratio gets diluted & there is strong support, or if prices continue lower & find their footing & traction at one of the next support levels, which have much more buyer pressure hsitorically.
Below is the list of the volume sentiments for SPY at the price levels it has traded at over the past 2-3 years.
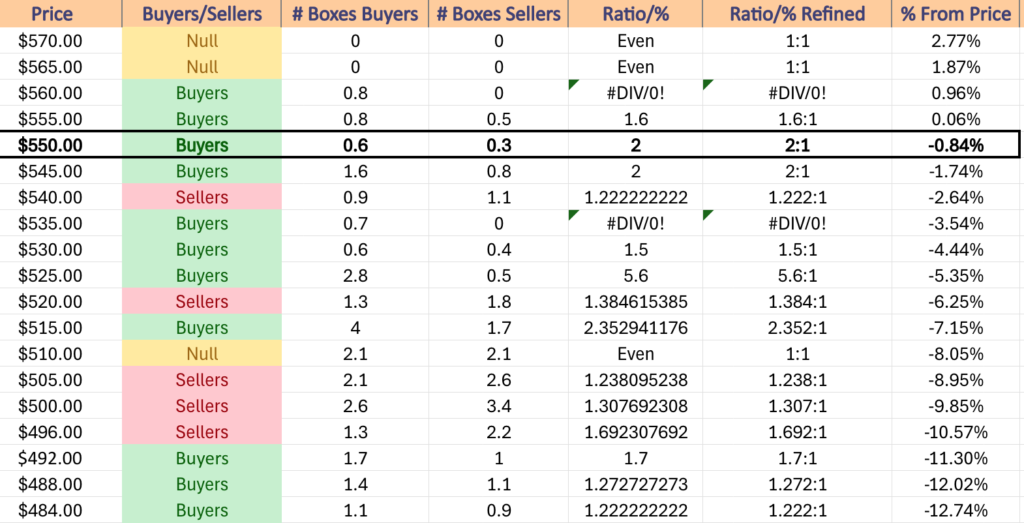
$570 – NULL – 0:0*, +2.77% From Current Price Level
$565 – NULL – 0:0*, +1.87% From Current Price Level
$560 – Buyers – 1.6:1, +0.96% From Current Price Level
$555 – Buyers – 2:1, +0.06% From Current Price Level – 10 Day Moving Average*
$550 – Buyers – 2:1, -0.84% From Current Price Level – Current Price Level*
$545 – Buyers – 2:1, -1.74% From Current Price Level
$540 – Sellers – 1.22:1, -2.64% From Current Price Level
$535 – Buyers – 0.7:0*, -3.54% From Current Price Level – 50 Day Moving Average*
$530 – Buyers – 1.5:1, -4.44% From Current Price Level
$525 – Buyers – 5.6:1, -5.35% From Current Price Level
$520 – Sellers – 1.38:1, -6.25% From Current Price Level
$515 – Buyers – 2.35:1, -7.15% From Current Price Level
$510 -Even – 1:1, -8.05% From Current Price Level
$505 – Sellers – 1.24:1, -8.95% From Current Price Level
$500 – Sellers – 1.31:1, -9.85% From Current Price Level
$496 – Sellers – 1.69:1, -10.57% From Current Price Level
$492 – Buyers – 1.7:1, -11.3% From Current Price Level
$488 – Buyers – 1.27:1, -12.02% From Current Price Level – 200 Day Moving Average*
$484 – Buyers – 1.22:1, -12.74% From Current Price Level
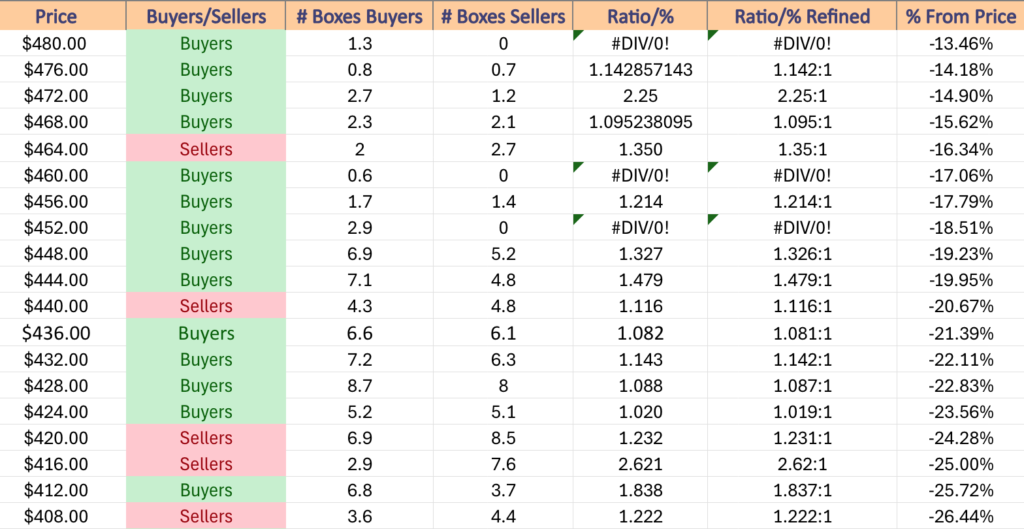
$480 – Buyers – 1.3:0*, -13.46% From Current Price Level
$476 – Buyers – 1.14:1, -14.18% From Current Price Level
$472 – Buyers – 2.25:1, -14.9% From Current Price Level
$468 – Buyers – 1.1:1, -15.62% From Current Price Level
$464 – Sellers – 1.35:1, -16.34% From Current Price Level
$460 – Buyers – 0.6:0*, -17.06% From Current Price Level
$456 – Buyers – 1.21:1, -17.79% From Current Price Level
$452 – Buyers – 2.9:0*, -18.51% From Current Price Level
$448 – Buyers – 1.33:1, -19.23% From Current Price Level
$444 – Buyers – 1.48:1, -19.95% From Current Price Level
$440 – Sellers – 1.12:1, -20.67% From Current Price Level
$436 – Buyers – 1.08:1, -21.39% From Current Price Level
$432 – Buyers – 1.14:1, -22.11% From Current Price Level
$428 – Buyers – 1.09:1, -22.83% From Current Price Level
$424 – Buyers – 1.02:1, -23.56% From Current Price Level
$420 – Sellers – 1.23:1, -24.28% From Current Price Level
$416 – Sellers – 2.62:1, -25% From Current Price Level
$412 – Buyers – 1.84:1, -25.72% From Current Price Level
$408 – Sellers – 1.22:1, -26.44% From Current Price Level
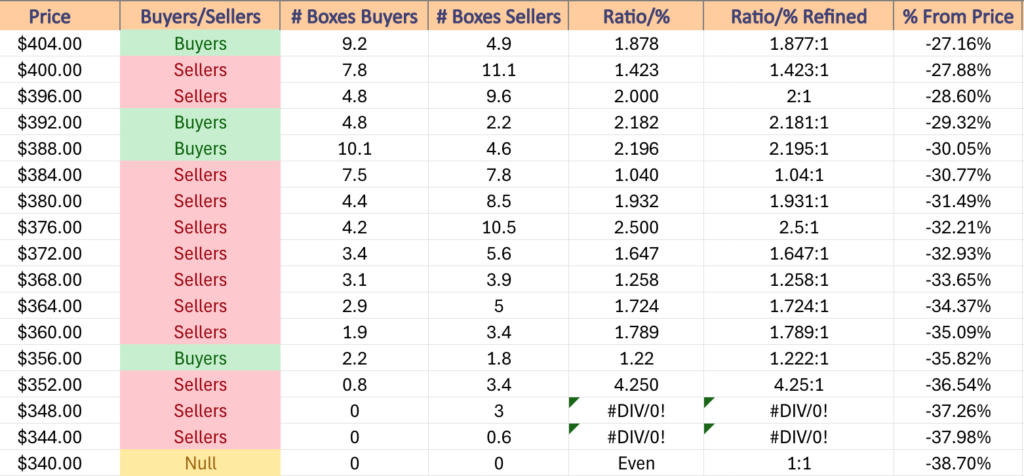
$404 – Buyers – 1.88:1, -27.16% From Current Price Level
$400 – Sellers – 1.42:1, -27.88% From Current Price Level
$396 – Sellers – 2:1, -28.6% From Current Price Level
$392 – Buyers – 2.18:1, -29.32% From Current Price Level
$388 – Buyers – 2.2:1, -30.05% From Current Price Level
$384 – Sellers – 1.04:1, -30.77% From Current Price Level
$380 – Sellers – 1.93:1, -31.49% From Current Price Level
$376 – Sellers – 2.5:1, -32.21% From Current Price Level
$372 – Sellers – 1.65:1, -32.93% From Current Price Level
$368 – Sellers – 1.26:1, -33.65% From Current Price Level
$364 – Sellers – 1.72:1, -34.37% From Current Price Level
$360 – Sellers – 1.79:1, -35.09% From Current Price Level
$356 – Buyers – 1.22:1, -35.82% From Current Price Level
$352 – Sellers – 4.25:1, -36.54% From Current Price Level
$348 – Sellers – 3:0*, -37.26% From Current Price Level
$344 – Sellers – 0.6:0*, -37.98% From Current Price Level
$340 – NULL – 0:0*, -38.7% From Current Price Level
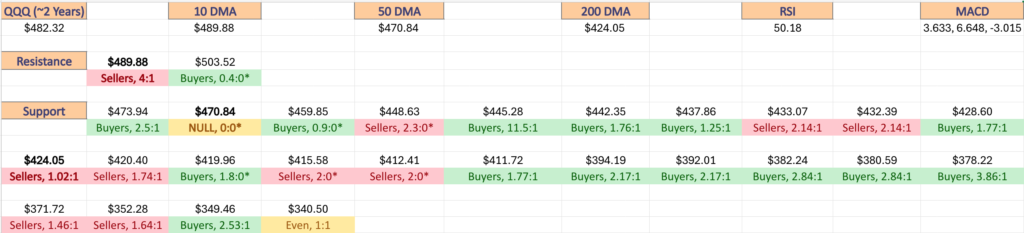
Price Level:Volume Sentiment Analysis For QQQ (NASDAQ 100) ETF
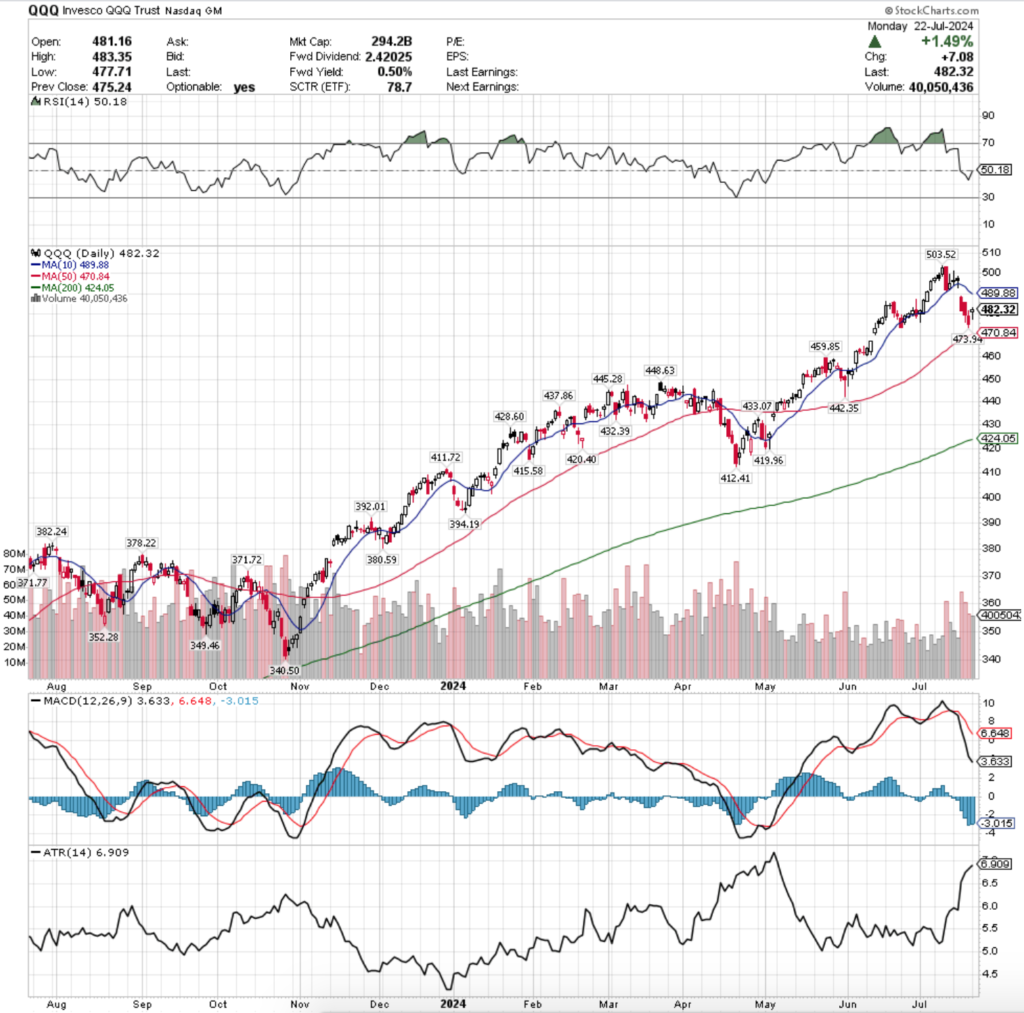
QQQ, the Invesco QQQ Trust ETF that tracks the NASDAQ 100 has also just come off of setting fresh all-time highs & is in a similar, but slightly more bearish technical position than SPY.
While QQQ’s ascent was more controlled than SPY’s which gives it more support levels, but if the 50 day moving average is crossed bearishly it will be imperative to assess the strength of each support level on its way down, especially as the top of the support from January-April’s trading range is at a Seller dominated price level (2.3:0*).
Below is a list of QQQ’s volume sentiment at each price level they’ve traded at for the last 2-3 years.
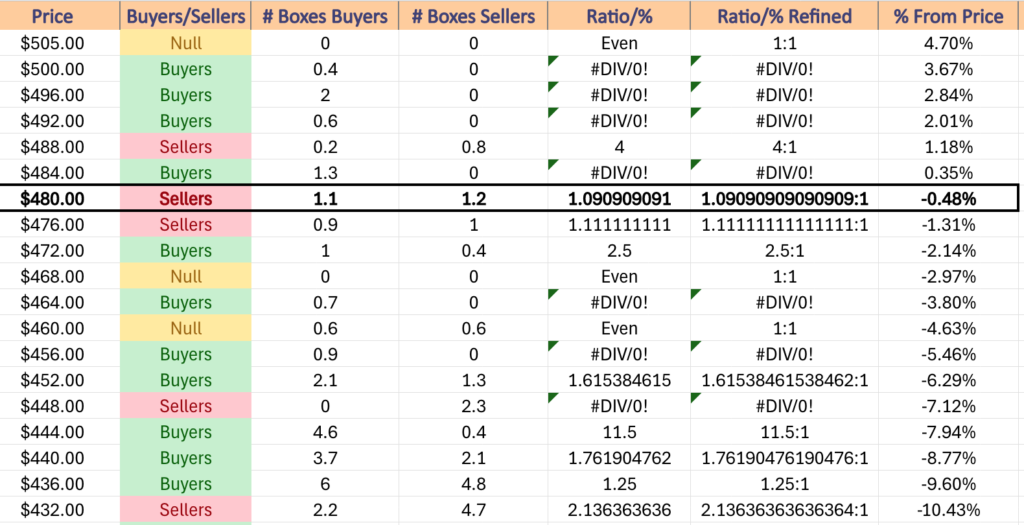
$505 – NULL – 0:0*, +4.7% From Current Price Level
$500 – Buyers – 0.4:0*, +3.67% From Current Price Level
$496 – Buyers – 2:0*, +2.84% From Current Price Level
$492 – Buyers – 0.6:0*, +2.01% From Current Price Level
$488 – Sellers – 4:1, +1.18% From Current Price Level – 10 Day Moving Average*
$484 – Buyers – 1.3:0*, +0.35% From Current Price Level
$480 – Sellers – 1.09:1, -0.48% From Current Price Level – Current Price Level*
$476 – Sellers – 1.11:1, -1.31% From Current Price Level
$472 – Buyers – 2.5:1, -2.14% From Current Price Level
$468 – NULL – 0:0*, -2.97% From Current Price Level – 50 Day Moving Average*
$464 – Buyers – 0.7:0*, -3.8% From Current Price Level
$460 – Even – 1:1, -4.63% From Current Price Level
$456 – Buyers – 0.9:0*, -5.46% From Current Price Level
$452 – Buyers – 1.62:1, -6.29% From Current Price Level
$448 – Sellers – 2.3:0*, -7.12% From Current Price Level
$444 – Buyers – 11.5:1, -7.94% From Current Price Level
$440 – Buyers – 1.76:1, -8.77% From Current Price Level
$436 – Buyers – 1.25:1, -9.6% From Current Price Level
$432 – Sellers – 2.14:1, -10.43% From Current Price Level
$428 – Buyers – 1.77:1, -11.26% From Current Price Level
$424 – Sellers – 1.02:1, -12.09% From Current Price Level – 200 Day Moving Average*
$420 – Sellers – 1.74:1, -12.92% From Current Price Level
$416 – Buyers – 1.8:0*, -13.75% From Current Price Level
$412 – Sellers – 2:0*, -14.58% From Current Price Level
$408 – Buyers – 1.77:1, -15.41% From Current Price Level
$404 – Buyers – 4.86:1, -16.24% From Current Price Level
$400 – Sellers – 1.04:1, -17.07% From Current Price Level
$396 – Buyers – 1.17:1, -17.9% From Current Price Level
$392 – Buyers – 2.17:1, -18.73% From Current Price Level
$388 – Buyers – 2.6:0*, -19.56% From Current Price Level
$384 – Sellers – 1.74:1, -20.38% From Current Price Level
$380 – Buyers – 2.84:1, -21.21% From Current Price Level
$376 – Buyers – 3.86:1, -22.04% From Current Price Level
$372 – Sellers – 1.04:1, -22.87% From Current Price Level
$368 – Sellers – 1.46:1, -23.7% From Current Price Level
$364 – Buyers – 1.55:1, -24.53% From Current Price Level
$360 – Buyers – 1.17:1, -25.36% From Current Price Level
$356 – Buyers – 1.21:1, -26.19% From Current Price Level
$352 – Sellers – 1.64:1, -27.02% From Current Price Level
$348 – Buyers – 2.53:1, -27.85% From Current Price Level
$344 – Buyers – 1.47:1, -28.68% From Current Price Level
$340 – Even – 1:1, -29.51% From Current Price Level
$336 – Buyers – 1:0*, -30.34% From Current Price Level
$332 – Buyers – 2:1, -31.17% From Current Price Level
$328 – Sellers – 1.23:1, -32% From Current Price Level
$324 – Buyers – 3.83:1, -32.82% From Current Price Level
$320 – Buyers – 2.5:1, -33.65% From Current Price Level
$316 – Buyers – 1.02:1, -34.48% From Current Price Level
$312 – Sellers – 2.75:1, -35.31% From Current Price Level
$308 – Buyers – 1.69:1, -36.14% From Current Price Level
$304 – Buyers – 2.55:1, -36.97% From Current Price Level
$300 – Sellers – 1.25:1, -37.8% From Current Price Level
$296- Buyers – 1.33:1, -38.63% From Current Price Level
$292 – Buyers – 2.5:1, -39.46% From Current Price Level
$288 – Sellers – 1.06:1, -40.29% From Current Price Level
$284 – Sellers – 1.11:1, -41.12% From Current Price Level
$280 – Sellers – 1.1:1, -41.95% From Current Price Level
$276 – Buyers – 1.17:1, -42.78% From Current Price Level
$272 – Sellers – 1.78:1, -43.61% From Current Price Level
$268 – Buyers – 1.03:1, -44.44% From Current Price Level
$264 – Sellers – 1.18:1, -45.26% From Current Price Level
$260 – Sellers – 1.84:1, -46.09% From Current Price Level
$256 – Sellers – 5.2:0*, -46.92% From Current Price Level
$252 – NULL – 0:0*, -47.75% From Current Price Level
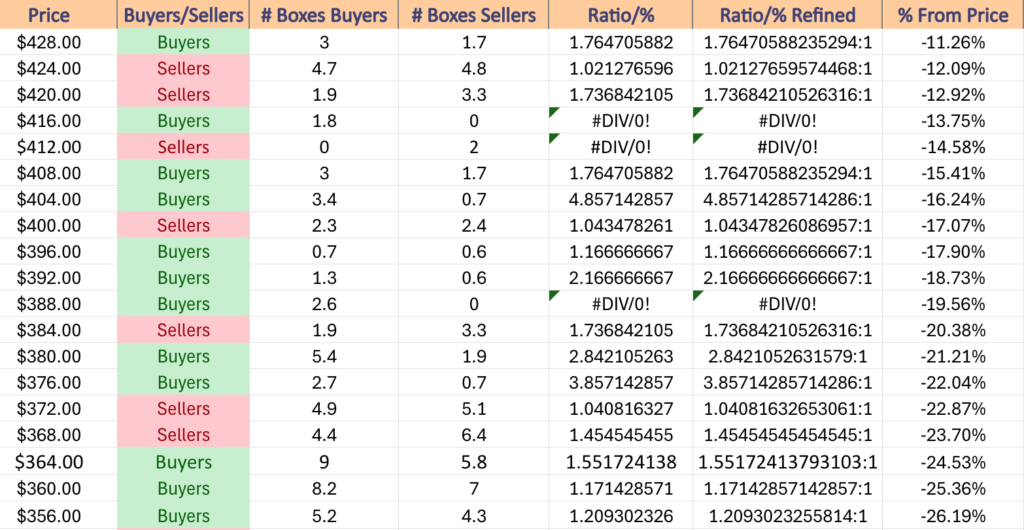
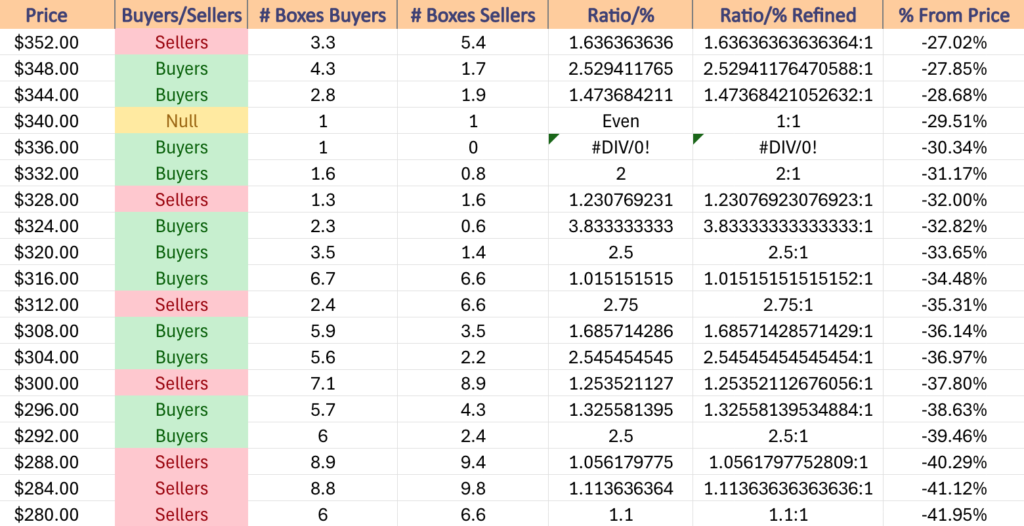
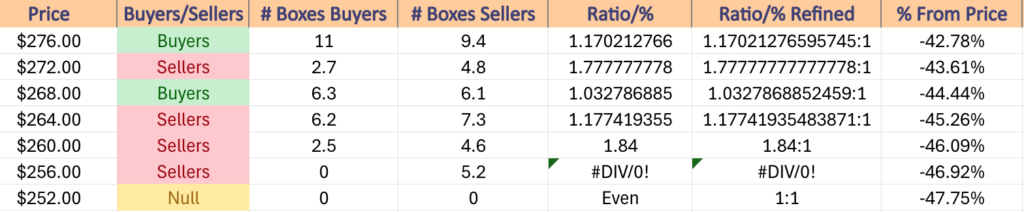
Price Level:Volume Sentiment Analysis For IWM (Russell 2000) ETF
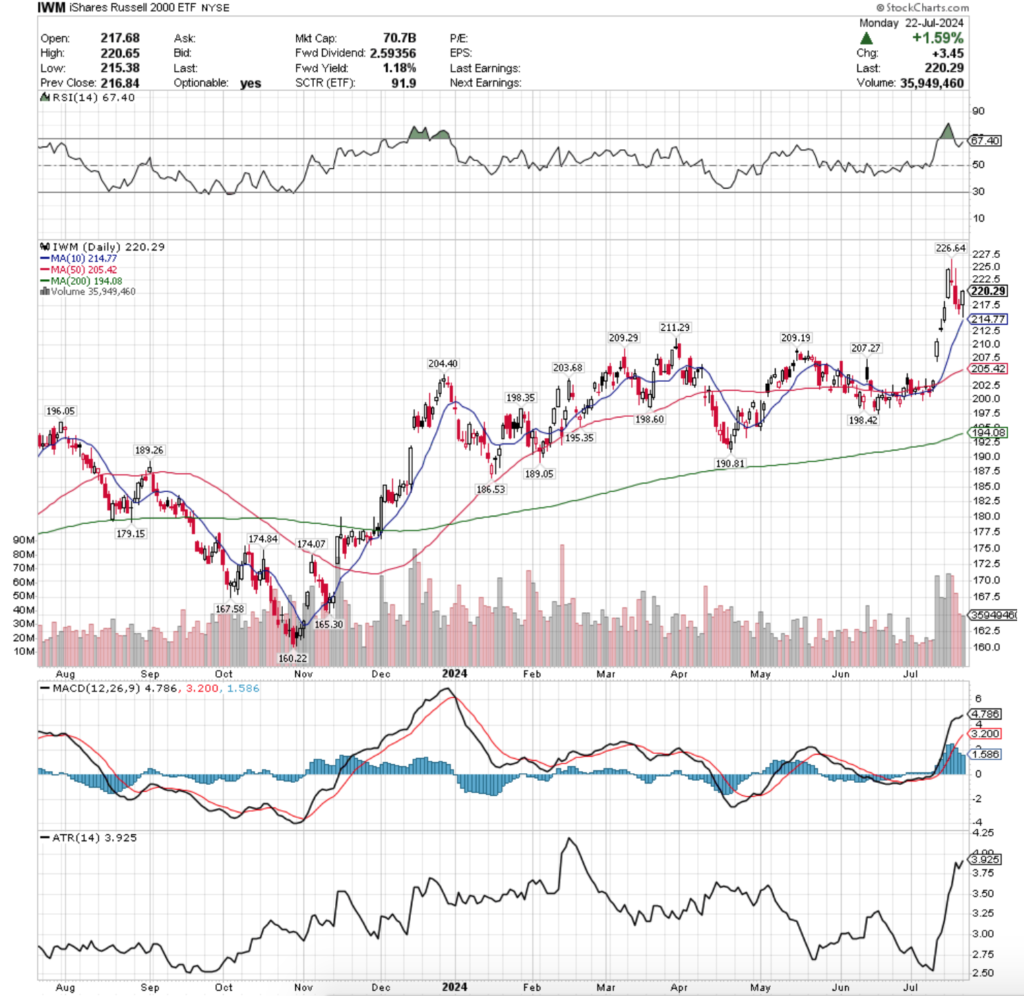
IWM, the iShares Russell 2000 ETF has set a fresh 52-week high recently, but has not reset its all-time high unlike the other three index ETFs.
The nature which IWM trades vs. SPY & QQQ is much more controlled & more like oscillations around a price range that steadily advance, whereas the other two ETFs favor more rapid ascents, which provides IWM with more support levels near their current price.
Below is a list of IWM’s volume sentiment at the price levels it’s traded at over the past 2-3 years.
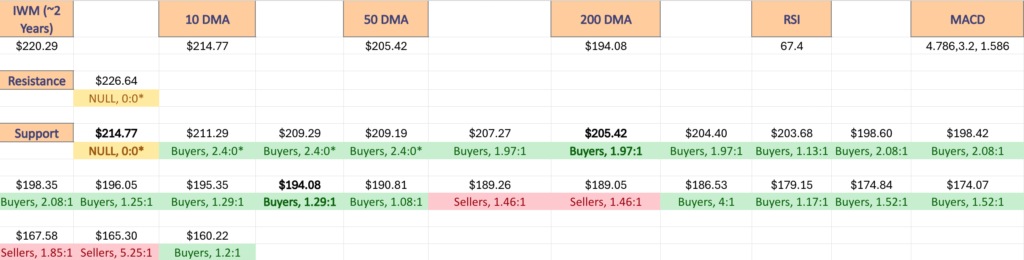
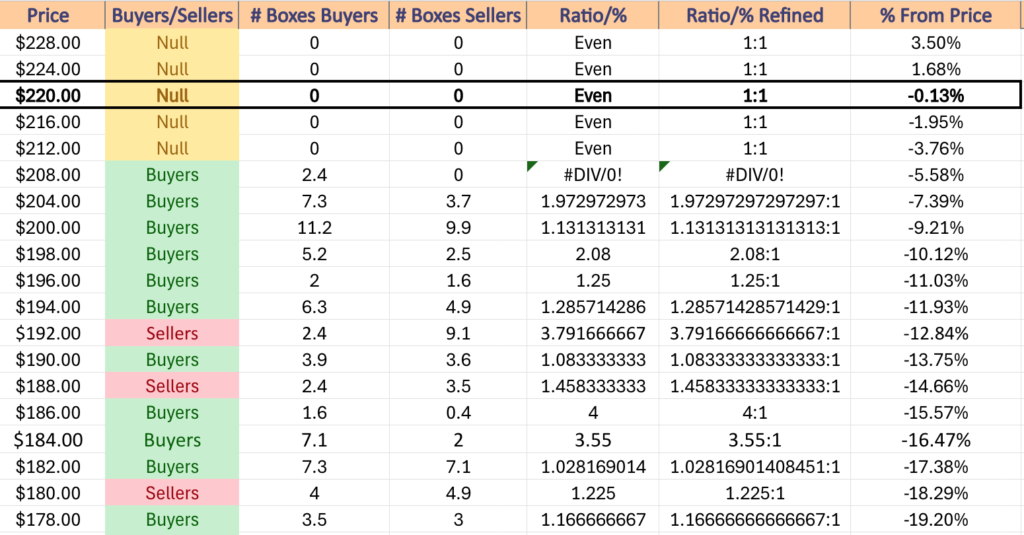
$228 – NULL – 0:0*, +3.5% From Current Price Level
$224 – NULL – 0:0*, +1.68% From Current Price Level
$220 -NULL – 0:0*, -0.13% From Current Price Level – Current Price Level*
$216 – NULL – 0:0*, -1.95% From Current Price Level
$212 – NULL – 0:0*, -3.76% From Current Price Level – 10 Day Moving Average*
$208 – Buyers – 2.4:0*, -5.58% From Current Price Level
$204 – Buyers – 1.97:1, -7.39% From Current Price Level – 50 Day Moving Average*
$200 – Buyers – 1.13:1, -9.21% From Current Price Level
$198 – Buyers – 2.08:1, -10.12% From Current Price Level
$196 – Buyers – 1.25:1, -11.03% From Current Price Level
$194 – Buyers – 1.29:1, -11.93% From Current Price Level – 200 Day Moving Average*
$192 – Sellers – 3.79:1, -12.84% From Current Price Level
$190 – Buyers – 1.08:1, -13.75% From Current Price Level
$188 – Sellers – 1.46:1, -14.66% From Current Price Level
$186 – Buyers – 4:1, -15.57% From Current Price Level
$184 – Buyers – 3.55:1, -16.47% From Current Price Level
$182 – Buyers – 1.03:1, -17.38% From Current Price Level
$180 – Sellers – 1.23:1, -18.29% From Current Price Level
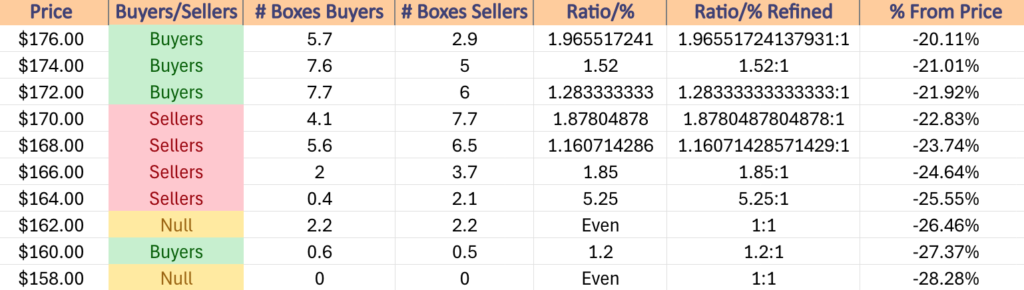
$178 – Buyers – 1.17:1, -19.2% From Current Price Level
$176 – Buyers – 1.97:1, -20.11% From Current Price Level
$174 – Buyers – 1.52:1, -21.01% From Current Price Level
$172 – Buyers – 1.28:1, -21.92% From Current Price Level
$170 – Sellers – 1.88:1, -22.83% From Current Price Level
$168 – Sellers – 1.16:1, -23.74% From Current Price Level
$166 – Sellers – 1.85:1, -24.64% From Current Price Level
$164 – Sellers – 5.25:1, -25.55% From Current Price Level
$162 – Even – 1:1, -26.46% From Current Price Level
$160 – Buyers – 1.2:1, -27.37% From Current Price Level
$158 – NULL – 0:0*, -28.28% From Current Price Level
Price Level:Volume Sentiment Analysis For DIA (Dow Jones Industrial Average) ETF
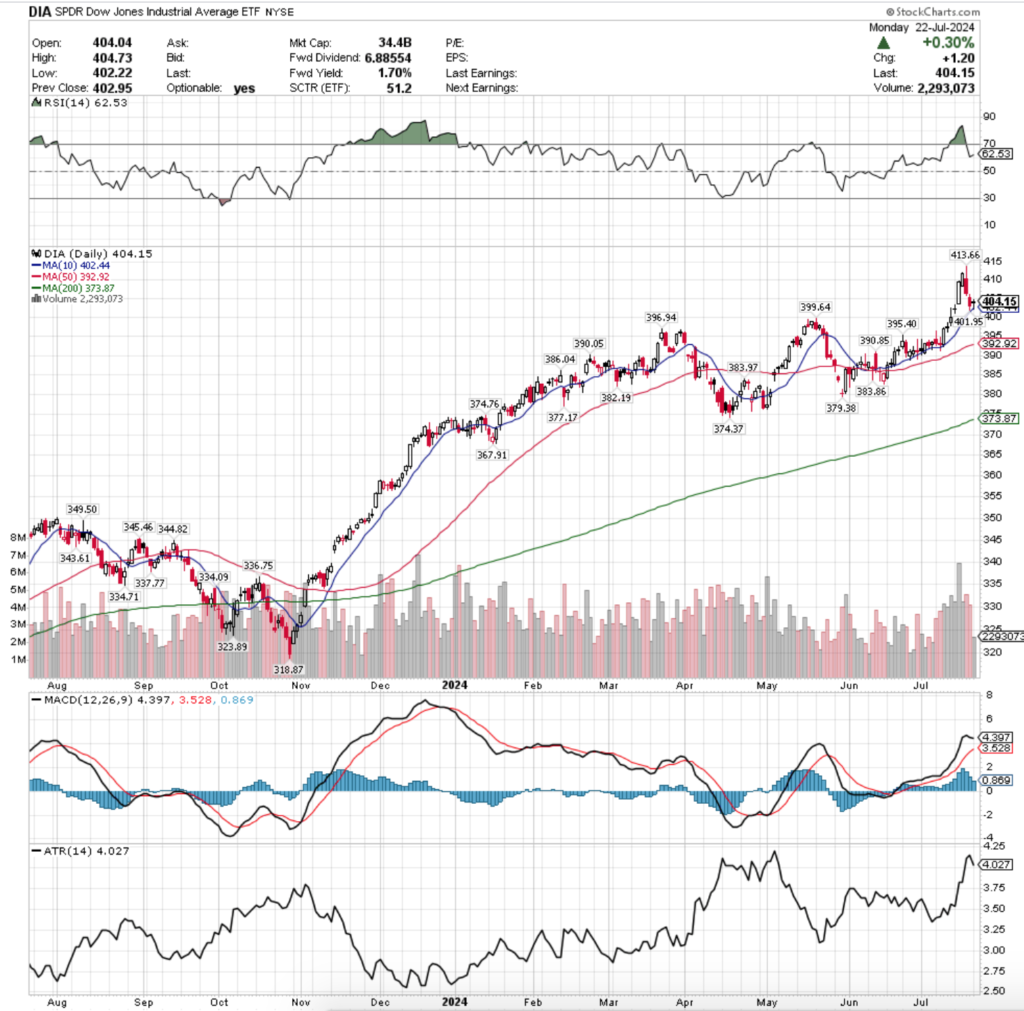
DIA, the SPDR Dow Jones Industrial Average ETF‘s chart is much closer to IWM’s than SPY or QQQ’s, primarily because the latter have benefitted greatly from NVDA & other AI oriented components that the former two do not have.
As a result, they too have more local support levels, but it is important to note that the overwhelming majority of them are heavily buyer dominated, which means in the event of a decline we’ll see these figures become diluted
Below is a list of the volume sentiment at each of the price levels DIA has traded at for the last 3-4 years.
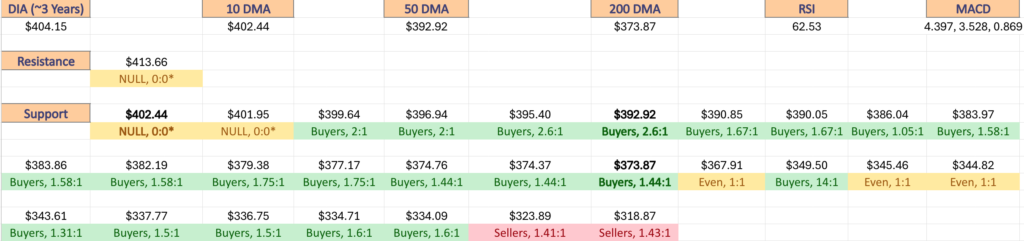
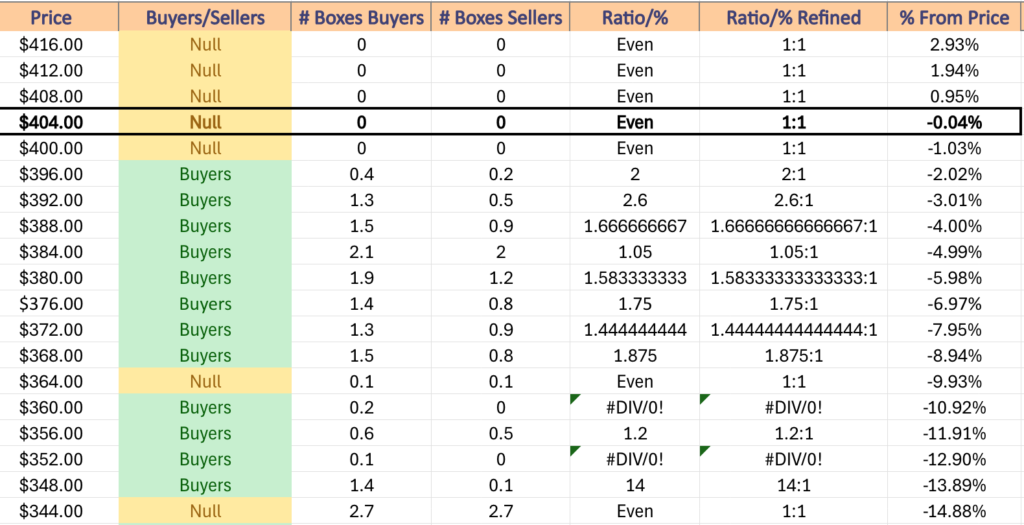
$416 – NULL – 0:0*, +2.93% From Current Price Level
$412 – NULL – 0:0*, +1.94% From Current Price Level
$408 – NULL – 0:0*, +0.95% From Current Price Level
$404 – NULL – 0:0*, -0.04% From Current Price Level
$400 – NULL – 0:0*, -1.03% From Current Price Level – 10 Day Moving Average*
$396 – Buyers – 2:1, -2.02% From Current Price Level
$392 – Buyers – 2.6:1, -3.01% From Current Price Level – 50 Day Moving Average*
$388 – Buyers – 1.67:1, -4% From Current Price Level
$384 – Buyers – 1.05:1, -4.99% From Current Price Level
$380 – Buyers – 1.58:1, -5.98% From Current Price Level
$376 – Buyers – 1.75:1, -6.97% From Current Price Level
$372 – Buyers- 1.44:1, -7.95% From Current Price Level – 200 Day Moving Average*
$368 – Buyers – 1.88:1, -8.94% From Current Price Level
$364 – Even, 1:1, -9.93% From Current Price Level
$360 – Buyers – 0.2:0*, -10.92% From Current Price Level
$356 – Buyers – 1.2:1, -11.91% From Current Price Level
$352 – Buyers – 0.1:0*, -12.9% From Current Price Level
$348 – Buyers – 14:1, -13.89% From Current Price Level
$344 – Even – 1:1, -14.88% From Current Price Level
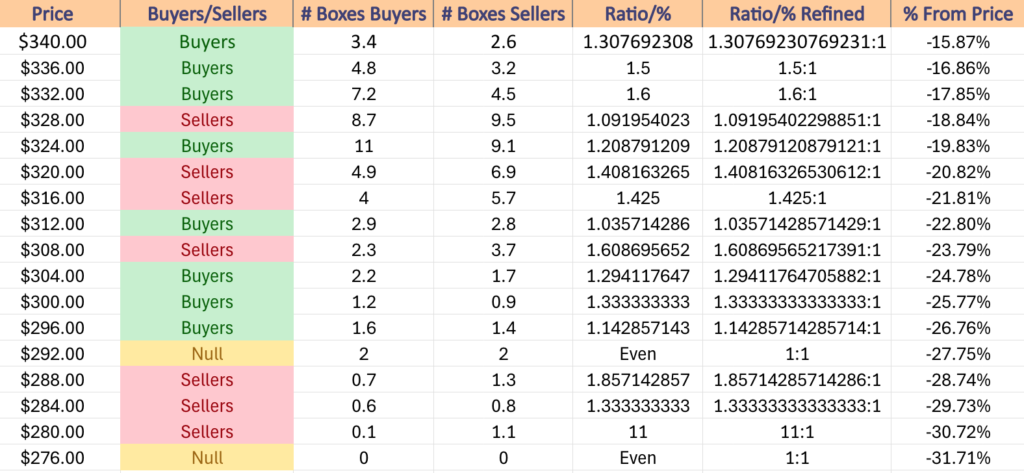
$340 – Buyers – 1.31:1, -15.87% From Current Price Level
$336 – Buyers – 1.5:1, -16.86% From Current Price Level
$332 – Buyers – 1.6:1, -17.85% From Current Price Level
$328 – Sellers – 1.09:1, -18.84% From Current Price Level
$324 – Buyers – 1.21:1, -19.83% From Current Price Level
$320 – Sellers – 1.41:1, -20.82% From Current Price Level
$316 – Sellers – 1.43:1, -21.81% From Current Price Level
$312 – Buyers – 1.04:1, -22.8% From Current Price Level
$308 – Sellers – 1.61:1, -23.79% From Current Price Level
$304 – Buyers – 1.29:1, -24.78% From Current Price Level
$300 – Buyers – 1.33:1, -25.77% From Current Price Level
$296 – Buyers – 1.14:1, -26.76% From Current Price Level
$292 – Even – 1:1, -27.75% From Current Price Level
$288 – Sellers – 1.86:1, -28.74% From Current Price Level
$284 – Sellers – 1.33:1, -29.73% From Current Price Level
$280 – Sellers – 11:1, -30.72% From Current Price Level
$276 – NULL – 0:0*, -31.71% From Current Price Level
*** I DO NOT OWN SHARES OR OPTIONS CONTRACT POSITIONS IN SPY, QQQ, IWM OR DIA AT THE TIME OF PUBLISHING THIS ARTICLE ***