XLK, the Technology Select Sector SPDR Fund ETF has declined -15.77% since their 52-week high, which was reached on 7/11/2024.
While they’re still up +17.77% over the past calendar year & +25.8% since their 52-week low in October of 2023, recent technical weakness amid broader market volatility calls for another look at their more recently updated price level:volume sentiment.
As noted last time we dove into XLK’s price level:volume sentiment their ten largest holdings are Applied Materials Inc. (AMAT), Qualcomm Inc. (QCOM), Microsoft Corp. (MSFT), NVIDIA Corp. (NVDA), Apple Inc. (AAPL), Broadcom Inc. (AVGO), Advanced Micro Devices (AMD), Adobe Inc. (ADBE), Salesforce Inc. (CRM) & Oracle Corp. (ORCL).
Given the recent selloff in large tech names, including by company insiders such as NVDA’s CEO Jensen Huang selling ~$500M in shares this summer alone, it appears that there may be more volatility on the near-term horizon.
With this in mind, it is important to understand previous investor behavior when XLK has traded in the price ranges it is in now, especially as its components all look to have more volatility ahead.
Below is a brief review of XLK’s recent technical performance, followed by the volume sentiments for each of the price levels that they have traded at over the past 2-3 years, in order to have an idea as to how they may behave again at these levels.
It is not intended to serve as financial advice, but rather as an additional tool to reference while performing your own due diligence into XLK.
Technical Analysis Of XLK, The Technology Sector Select SPDR Fund ETF
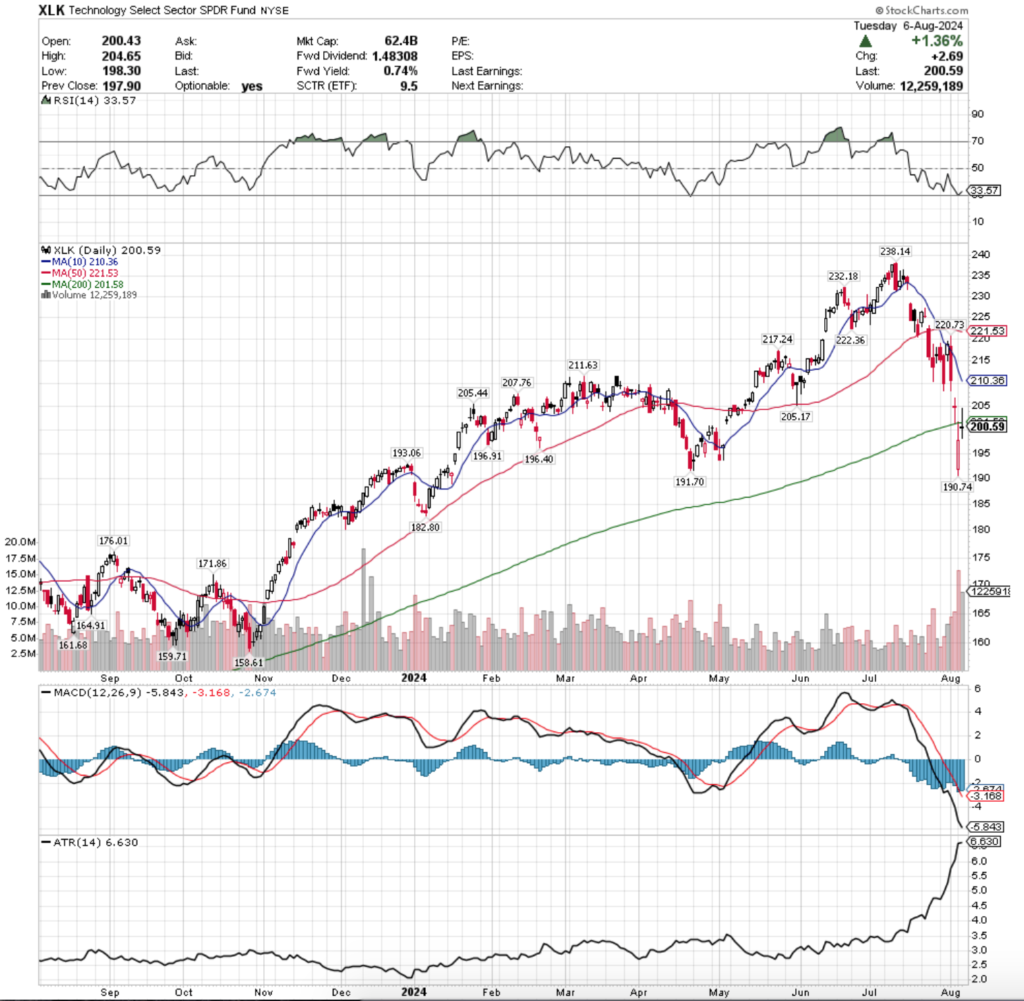
Their RSI is bouncing back from the oversold level of 30 & sits at 33.57 per 8/6/2024’s close & their MACD is still heavily bearish, with the histogram not indicating much weakness in terms of bearish sentiment yet.
Volumes over the past week & a half have been +39.79% higher than the previous year’s average volume (8,875,842.86 vs. 6,349,194.05), primarily driven by Monday’s massive declining session that brought about the second highest volume of the past year.
Monday’s session is also important as it showed that there is appetite for XLK to trade below its 200 day moving average, which will be important to keep an eye on moving into the second half of the year.
XLK’s 10 day moving average crossed bearishly through their 50 day moving average last Monday, leading the way for a bearish head & shoulders pattern was formed this week that began in April.
Last Friday’s gap down is an area to take note of as well for the near-term, as in addition to the bearish implications the long-legged doji candle shows that there is a lot of indecision & uncertainty as to where XLK should be valued at the moment.
Friday’s heavy volume should also be noted, as between Thursday, Friday & Monday there was a lot of profit taking & while Tuesday’s volumes were heavier that the first two days mentioned there, if the following days are not also heavy there will be a signal of extreme low confidence.
Monday’s candle is very interesting, as it opened low, was able to test higher but was rejected by the 200 day moving average’s resistance & closed lower, although the day’s close was still +3.12% higher than its open.
While the day’s close being that much higher than the open might normally be seen as a bullish signal, the rejection by the 200 DMA & the inability of Tuesday to open or close above it adds a bit of doubt in the near-term sentiment.
In the event that there is further downside movement that wide range covered by the candle’s body may be where a consolidation range forms.
Yesterday’s candle was also a long-legged doji, which despite being a +1.36% session, most of the gain was made on the opening gap up & neither bulls nor bears were in control of the session as a whole.
While the lower range of the day stayed above Monday’s close, the session was unable to close above the 200 DMAs resistance.
While today (Wednesday) has managed to open higher, it will be interesting to see how XLK holds up against the strength of resistance from both the window created by last Friday’s gap & the 10 DMA, which is about to enter said window & apply downward pressure on XLK’s share price.
With all of this volatility & indecision in mind, it is imperative to be paying attention to volume & volume trends, as at the end of the day they will be what is moving price action, especially as XLK’s price gets closer to testing the 10 DMA’s resistance.
It should also be noted that this week features very little in terms of market data, but next week PPI (Tuesday) & CPI (Wednesday) are being released, which will likely add to the volatility.
With this in mind, the table below may be able to shed some insight into how XLK’s prices move during these times of heightened volatility.
XLK, The Technology Sector Select SPDR Fund ETF’s Price Level:Volume Sentiment Broken Down
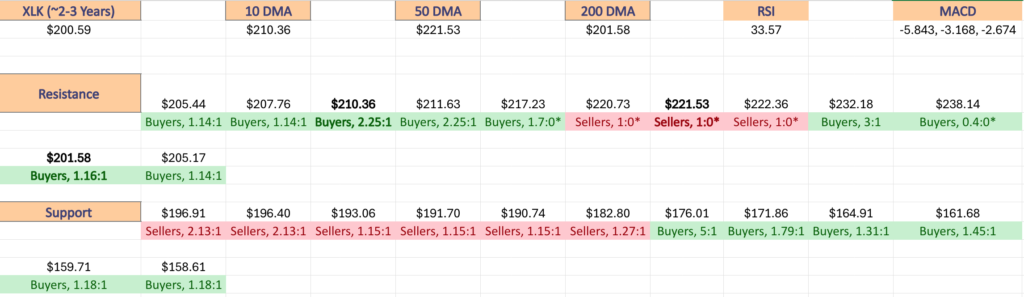
The top table below shows the support & resistance levels of XLK ETF from the past year’s chart, as well as their price level:volume sentiment at each, using Monday’s closing price.
The moving averages are denoted with bold.
The next charts show the volume sentiment at each individual price level XLK has traded at over the past ~2-3 years.
Beneath them is a copy & pasteable list of the same data, where the support/resistance levels are denoted in bold.
All ratios with “0” in the denominator are denoted with a “*”.
NULL values are price levels that had limited trading volume, whether it be due to gaps, quick advances or they are at price extremes; in the event that they are retested & there is more data they would have a distinct “Buyers”, “Sellers” or “Even” title.
This is not intended as financial advice, but rather another tool to consider when performing your own research & due diligence on XLK ETF or any of its components.
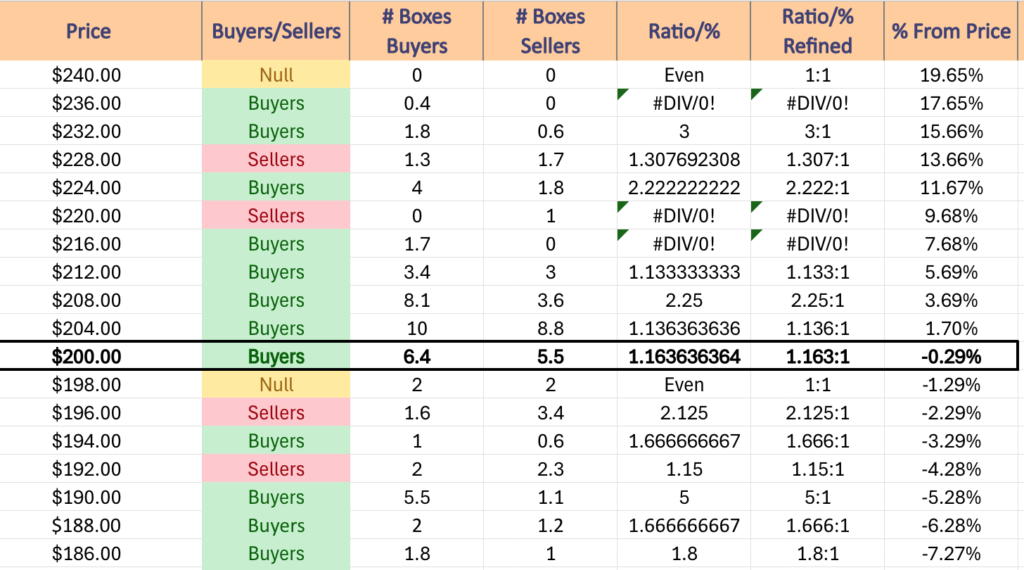
$240 – NULL – 0:0*, +19.65% From Current Price Level
$236 – Buyers – 0.4:0*, +17.65% From Current Price Level
$232 – Buyers – 3:1, +15.66% From Current Price Level
$228 – Sellers – 1.31:1, +13.66% From Current Price Level
$224 – Buyers – 2.22:1, +11.67% From Current Price Level
$220 – Sellers – 1:0*, +9.68% From Current Price Level – 50 Day Moving Average*
$216 – Buyers – 1.7:0*, +7.68% From Current Price Level
$212 – Buyers – 1.13:1, +5.69% From Current Price Level
$208 – Buyers – 2.25:1, +3.69% From Current Price Level – 10 Day Moving Average*
$204 – Buyers – 1.14:1, +1.7% From Current Price Level
$200 – Buyers – 1.16:1, -0.29% From Current Price Level – 200 Day Moving Average & Current Price Level**
$198 – Even – 1:1, -1.29% From Current Price Level
$196 – Sellers – 2.13:1, -2.29% From Current Price Level
$194 – Buyers – 1.67:1, -3.29% From Current Price Level
$192 – Sellers – 1.15:1, -4.28% From Current Price Level
$190 – Buyers – 5:1, -5.28% From Current Price Level
$188 – Buyers – 1.67:1, -6.28% From Current Price Level
$186 – Buyers – 1.8:1, -7.27% From Current Price Level
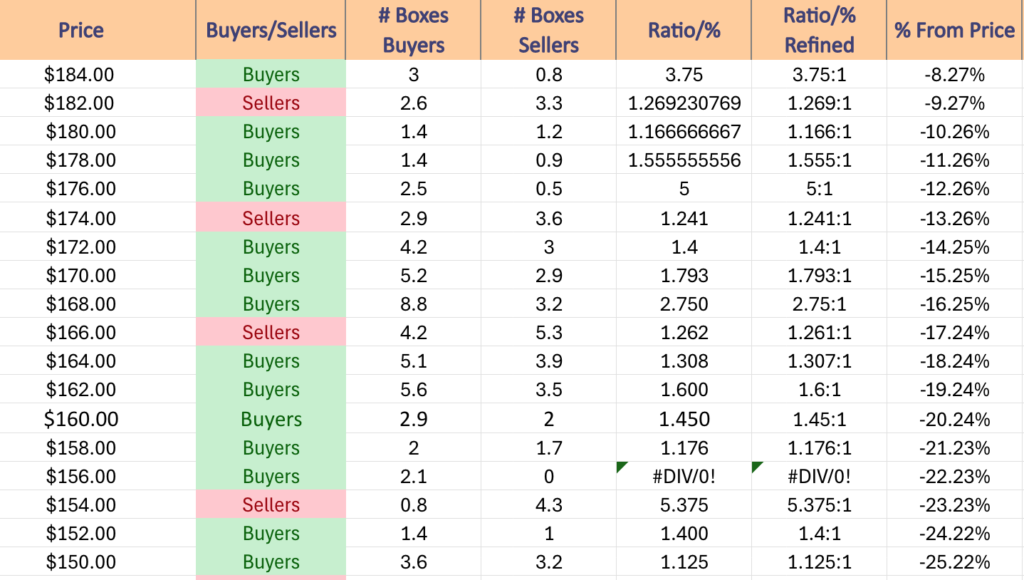
$184 – Buyers – 3.75:1, -8.27% From Current Price Level
$182 – Sellers – 1.27:1, -9.27% From Current Price Level
$180 – Buyers – 1.17:1, -10.26% From Current Price Level
$178 – Buyers – 1.56:1, -11.26% From Current Price Level
$176 – Buyers – 5:1, -12.26% From Current Price Level
$174 – Sellers – 1.24:1, -13.26% From Current Price Level
$172 – Buyers – 1.4:1, -14.25% From Current Price Level
$170 – Buyers – 1.79:1, -15.25% From Current Price Level
$168 – Buyers – 2.75:1, -16.25% From Current Price Level
$166 – Sellers – 1.26:1, -17.24% From Current Price Level
$164 – Buyers – 1.31:1, -18.24% From Current Price Level
$162 – Buyers – 1.6:1, -19.24% From Current Price Level
$160 – Buyers – 1.45:1, -20.24% From Current Price Level
$158 – Buyers – 1.18:1, -21.23% From Current Price Level
$156 – Buyers – 2.1:0*, -22.23% From Current Price Level
$154 – Sellers – 5.38:1, -23.23% From Current Price Level
$152 – Buyers – 1.4:1, -24.22% From Current Price Level
$150 – Buyers – 1.13:1, -25.22% From Current Price Level
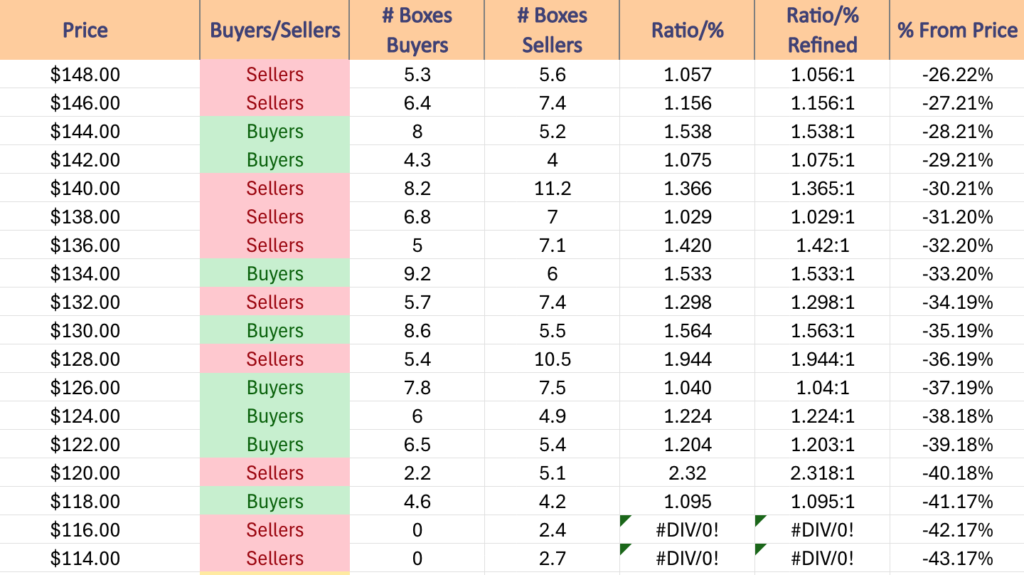
$148 – Sellers – 1.06:1, -26.22% From Current Price Level
$146 – Sellers – 1.16:1, -27.21% From Current Price Level
$144 – Buyers – 1.54:1, -28.21% From Current Price Level
$142 – Buyers – 1.08:1, -29.21% From Current Price Level
$140 – Sellers – 1.37:1, -30.21% From Current Price Level
$138 – Sellers – 1.03:1, -31.2% From Current Price Level
$136 – Sellers – 1.42:1, -32.2% From Current Price Level
$134 – Buyers – 1.53:1, -33.2% From Current Price Level
$132 – Sellers – 1.3:1, -34.19% From Current Price Level
$130 – Buyers – 1.56:1, -35.19% From Current Price Level
$128 – Sellers – 1.94:1, -36.19% From Current Price Level
$126 – Buyers – 1.04:1, -37.19% From Current Price Level
$124 – Buyers – 1.22:1, -38.18% From Current Price Level
$122 – Buyers – 1.2:1, -39.18% From Current Price Level
$120 – Sellers – 2.32:1, -40.18% From Current Price Level
$118 – Buyers – 1.1:1, -41.17% From Current Price Level
$116 – Sellers – 2.4:0*, -42.17% From Current Price Level
$114 – Sellers – 2.7:0*, -43.17% From Current Price Level
$112 – NULL – 0:0*, -44.16% From Current Price Level
*** I DO NOT OWN SHARES OR OPTIONS CONTRACT POSITIONS IN XLK AT THE TIME OF PUBLISHING THIS ARTICLE ***