SPY, the SPDR S&P 500 ETF barely budged last week despite volumes returning, as it gained +0.02% for the week, while the VIX closed at 20.37, indicating an implied one day movement of +/-1.28% & a one month implied move of +/-5.89%.
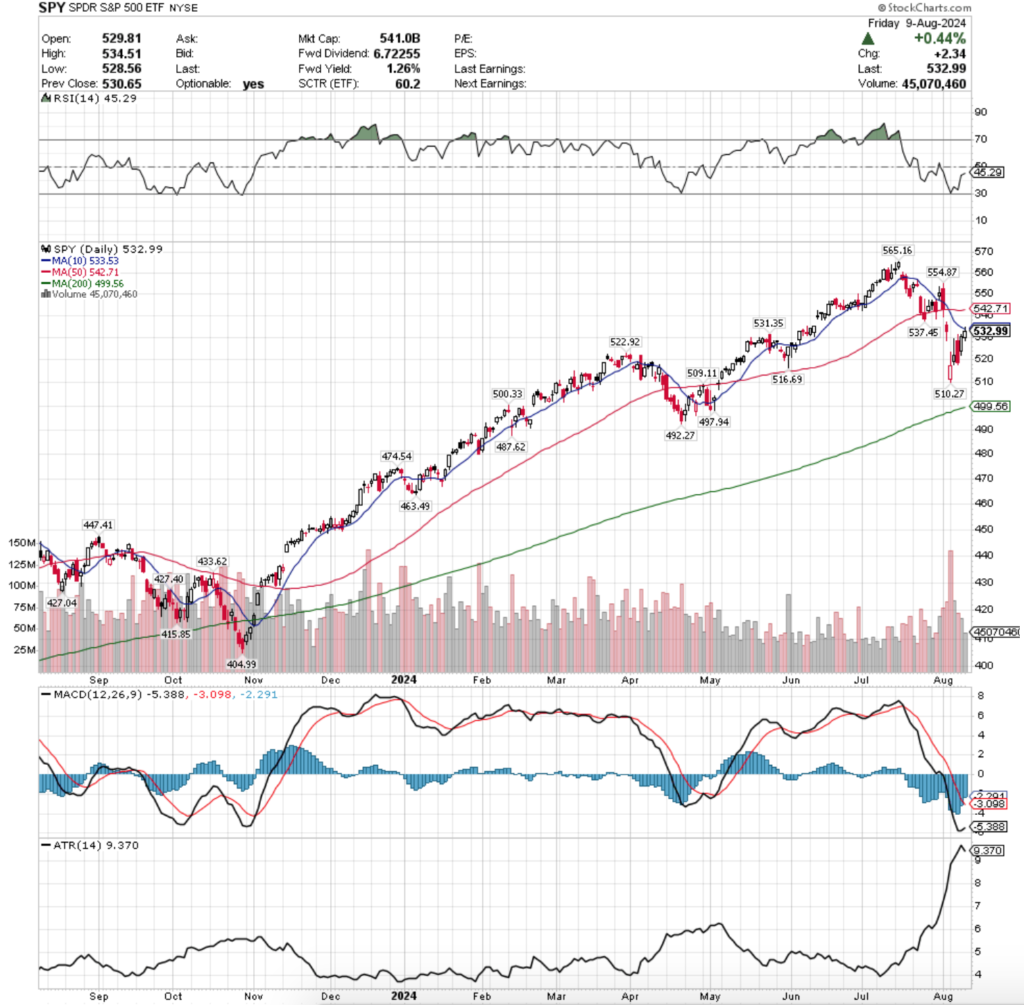
Their RSI is trending back towards the neutral level of 50 & currently sits at 45.29, while their MACD is still bearish, but is moving towards the signal line.
SPY’s MACD will be an area to keep a watch on this week, as the histogram reading is still not showing weakness relative to other days since it’s bearish crossover & the past Tuesday, Thursday & Friday’s bullish sessions are n0t convincing of strength, meaning that the MACD line may not reach the signal line next week to cross over bullishly.
Volumes were +16.58% above average last week compared to the prior year (82,123,380 vs. 70,443,801), which was a welcome change after months of subpar weekly volumes.
It should be noted though that due to the months of below average volume since April enough of that calculation has changed that the annual average volume today is -9.54% compared to what it was in March 31, 2024’s Market Review note (77,829,780 vs. 70,443,801 today), which means that there is still a lot of caution being taken & a lack of confidence.
Last week we noted that volumes would be the determining factor in how to read last week’s trade & think of what direction the market may venture in next & seeing this still relatively weak volume in a week with three bullish sessions is cause for concern.
Monday kicked the week off on a gloomy note, with a ~4% gap down on the highest volume of the past 52-weeks.
While the silver lining is that there was a recovery of sorts during the session & the day closed higher than it opened, the bulls proved to be nowhere near in control at any point of the day.
It did manage to open up the opportunity for SPY to climb in the short-term after the steep decline for a few sessions to enable their oscillators & indicators to recalibrate before the day of reckoning with the 10 day moving average’s resistance comes.
Tuesday saw the week’s second highest volume on an advancing day, but had there been a prior uptrend before it the candle may also be judged as a shooting star (bearish), as much like Monday, Tuesday’s SPY candle had an even longer upper shadow, signaling that the bulls were yet again not in control.
Wednesday threw a bit of a head-fake, gapping up on the open & testing higher before ultimately crashing down on a wide-range day between the open & closing price that resulted in a bearish decline that closed below Tuesday’s open.
While Tuesday had higher volume than Wednesday, Wednesday had the third highest volume of the week & bearishly engulfed Tuesday’s candle in a dramatic fashion, indicating that there is hunger both higher & lower than Tuesday’s price action for SPY.
This brings us to where I’ve been telling people for the past week to pay attention to, what happens once price gets a scent of the 10 DMA’s resistance.
Thursday managed to open mid-way through Wednesday’s candle’s real body range, but was unable to at any point in time trade above Wednesday’s high price & volume began to look like the “above average” days of the past few months, which as noted before were very weak in terms of volume.
Friday told an even gloomier tale, as prices opened at about the close of Thursday’s session, & stated in a relatively tight range below the 10 DMA (although they did briefly tick above it, but not by much).
Friday’s volume was also towards the low end of the past few month’s daily volume readings, which is not a reason for excitement heading into a new week, particularly with earnings from Home Depot & Walmart that will shed light into the state of U.S. consumers, but also PPI (Tuesday) & CPI (Wednesday) which will give more clarity about the state of US inflation.
While the day did not end in a spinning top, the small range of the day’s real body still tells a tale of uncertainty on the part of market participants.
The tight nature of the week’s ascent is also something to note, as it does not paint a picture of strength, but rather more of one of uncertainty, some covering & rebalancing & perhaps a few small profit squeezes.
Last week’s message about the importance of volume carries over into this week as well & will remain more important than daily price changes in the near-term, especially given the important data just mentioned above that we will be getting regarding the strength of consumers.
Lower participation when the price is below the 10 & 50 DMA’s resistance is a recipe for continued declines, or a consolidation within the range of Wednesday’s real body in the event of decent enough news/earnings results or for more, steeper declines in the event of poor results.
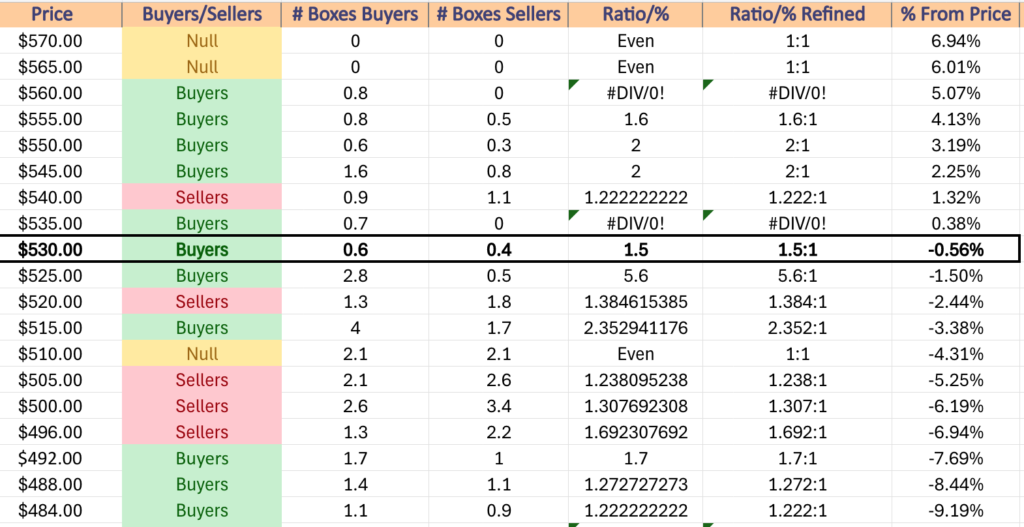
Another area to keep an eye on this week is the $525-529.99 price range, as it historically over the past 1-2 years has been dominated by Buyers at a rate of 5.6:1, but currently has no support levels in that window.
While buyers have often come out in droves here, it has no foothold in terms of support levels, making the $522.92 the next level of support (once $531.35/share is passed through).
This may be problematic as Sellers have dominated that area 1.38:1 over the same time period, and with the exception of $515-519.99, the rest of the way down to $496/share is either even 1:1 ($510-514.99/share) else seller dominated until $495.99/share.
Should $565.16/share be the head of a bearish head & shoulders forming, that would match the math & length of time between the left shoulder & the head where there are support levels at $497.94 & $492.27).
To reach the lower of those two support levels would be a decline of ~7.6% from where Friday closed.
It will also be worth keeping an eye on SPY’s Average True Range to see if the range becomes expanded in the face of more volatility.
As for the upside, the $540-544.99/share range is seller dominated 1.22:1 in the past 1-2 years, which is where the 50 day moving average’s resistance currently sits.
Should prices break above the 10 DMA & become wedged between the 10 & 50 DMAs the volume levels of each day in relation to their move will also be the telltale as to where things may be heading in the near-term & be just as important to watch as if in decline.
SPY has support at the $531.35 (Volume Sentiment: Buyers, 1.5:1), $522.92 (Volume Sentiment: Sellers, 1.38:1), $516.69 (Volume Sentiment: Buyers, 2.35:1) & $510.27/share (Volume Sentiment: Even, 1:1) price levels, with resistance at the $533.53 (10 Day Moving Average, Volume Sentiment: Buyers, 1.5:1), $537.45 (Volume Sentiment: Buyers, 0.7:0*), $542.71 (50 Day Moving Average, Volume Sentiment: Sellers, 1.22:1) & $554.87/share (Volume Sentiment: Buyers, 2:1) price levels.
QQQ, the Invesco QQQ Trust ETF that tracks the NASQAQ 1000, fared slightly better than SPY & closed the week up +0.37% as the top two performing indexes of the week more or less tread water.
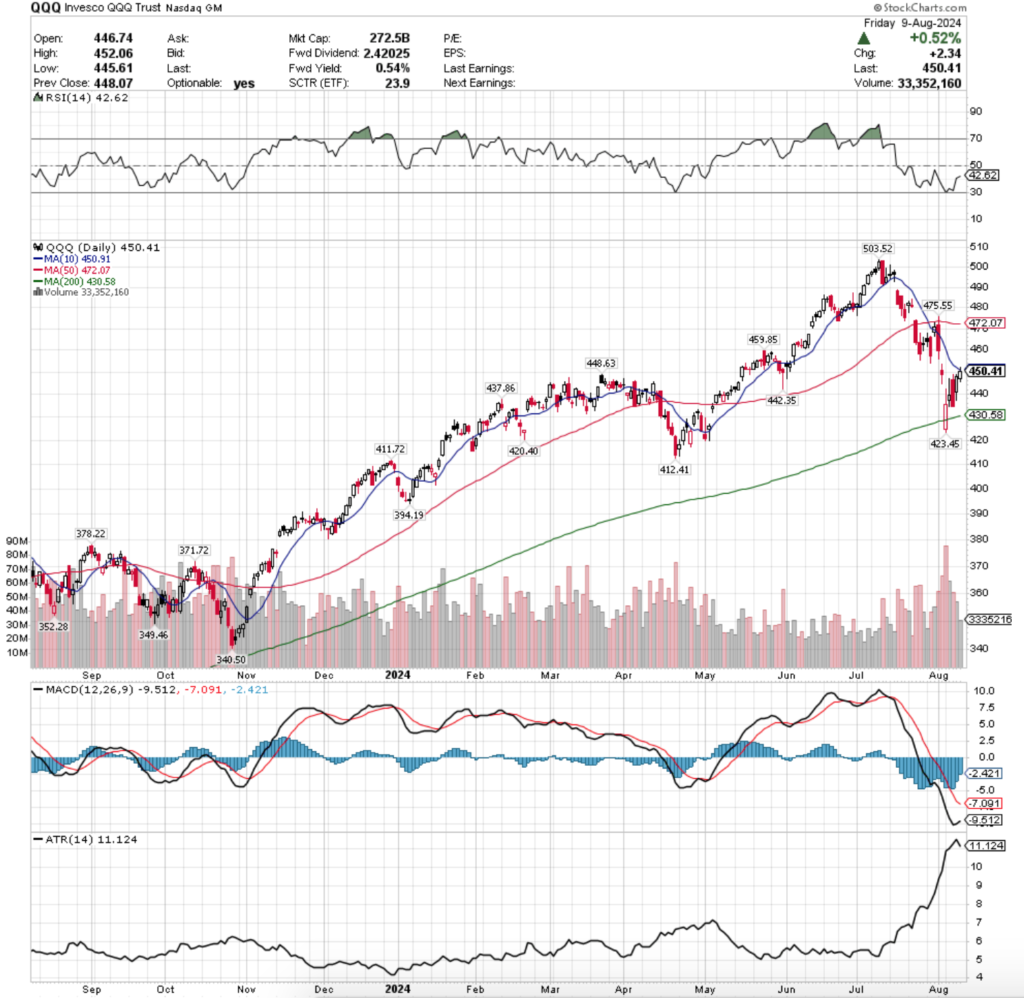
Their RSI is trending back towards the neutral level of 50 & is currently at 42.62, while their MACD is similar to SPYs; bearish but based on the histogram it is uncertain as to whether or not the MACD line will actually cross bullishly over the signal line in the near-term.
Volumes were +29.64% above average last week compared to the previous year’s average volume (57,400,080 vs. 44,277,827), but much like SPY this doesn’t matter much, as using the 3/31/2024 article data their average volume has declined by -10.1% (was 49,253,412).
QQQ’s chart reads heavily similar to SPY’s, which is to be expected as the really on major difference over the past year has been that SPY ascended more rapidly & as a result has enjoyed having more local support levels than SPY, but for the most part they’ve behaved very similarly.
One major area of difference though that should be considered is that Monday’s gap down open was below QQQ’s 200 day moving average, indicating a severe lack of confidence in the index.
This is important as it signals both the clear lack of confidence in the NASDAQ 100 component companies, but also historically once that’s been crossed over via a daily candle chart in almost all instances that has predicted future near-term declines (using past decade chart).
With this in mind, the volumes will continue to be an area of keen focus for the coming week with QQQ.
Given how the rest of the week for QQQ was almost a mirror or SPY in terms of the volume & candlesticks I’ll spare the deep dive to focus on QQQ’s 10, 50 & 200 day moving averages.
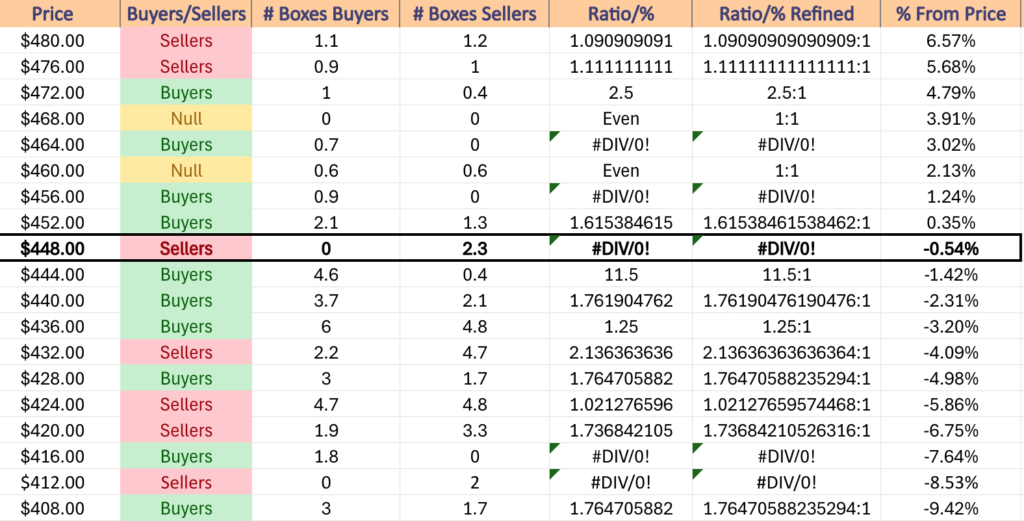
QQQ’s 200 day moving average has a solid wall of buyers to keeping the price floated above it, but the strongest price level is $444-447.99/share, which places a spotlight on the $448.63/share support level, as if it breaks down there are no support levels in that price zone (where over the past 1-2 years Buyers have overpowered sellers 11.5:1).
Should that break down, we will at least see the 10 DMA bearishly cross the 200 DMA, if not a death cross of the 50 DMA also passing through it to the down side.
This week will be all about the volume again though, but the relationship between prices & these moving averages will also be more important than they were in last week’s note.
Their Average True Range has begun to turn down in the wake of last week’s “recovery” from Monday’s gap down, but in the face of higher volatility it will be worth noting how much higher it goes from here, as the high end of its range will need to expand.
QQQ has support at the $448.63 (Volume Sentiment: Sellers, 2.3:0*), $442.35 (Volume Sentiment: Buyers, 1.76:1), $437.86 (Volume Sentiment: Buyers, 1.25:1) & $430.58/share (200 Day Moving Average, Volume Sentiment: Buyers, 1.77:1) price levels, with resistance at the $450.91 (10 Day Moving Average, Volume Sentiment: Sellers, 2.3:0*), $459.85 (Volume Sentiment: Buyers, 0.9:0*), $472.07 (50 Day Moving Average, Volume Sentiment: Buyers, 2.5:1) & $475.55/share (Volume Sentiment: Buyers, 2.5:1) price levels.
IWM, the iShares Russell 2000 ETF declined -1.18% last week, faring the worst of the major four index ETFs, as market participants shied away from small cap names.
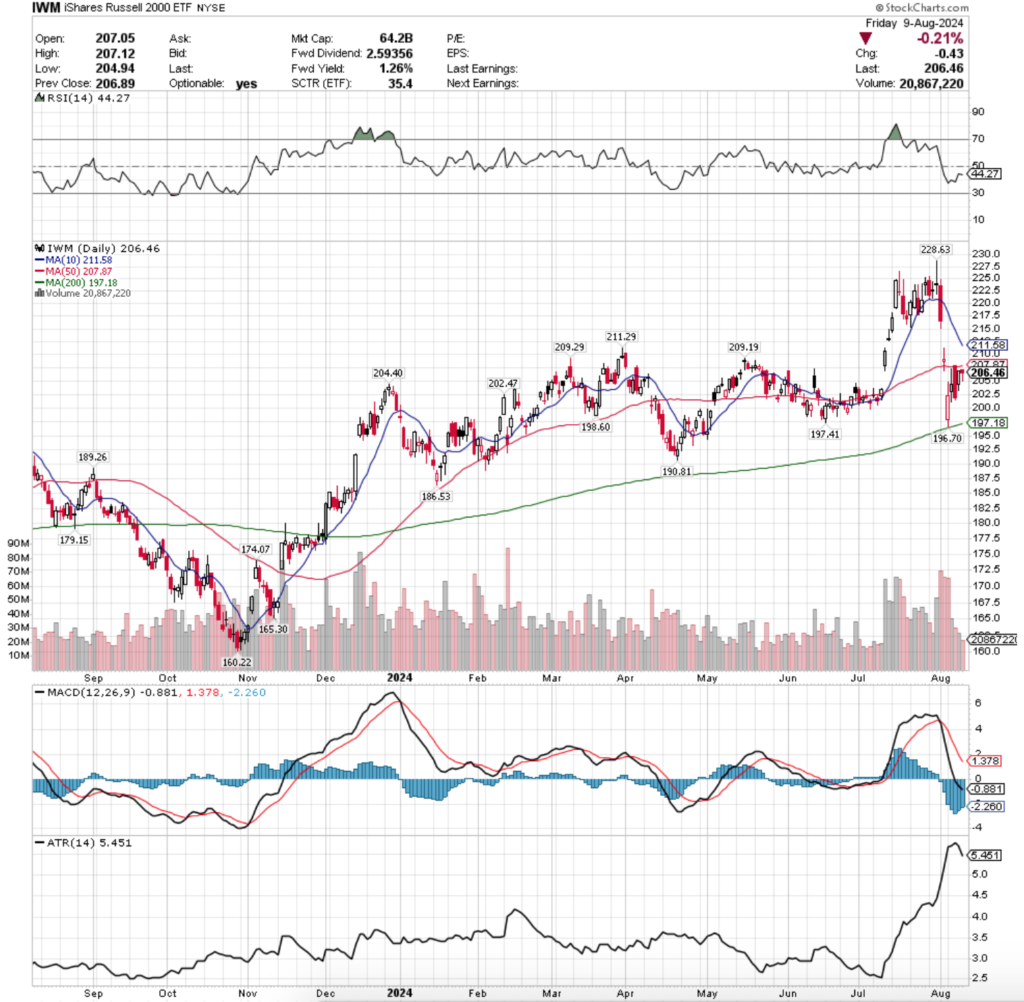
Their RSI is at 44.27 & currently sits flat in the wake of the declines of the past two weeks, while their MACD is bearish, and in a similar position to SPY’s & QQQ’s in terms of histogram bearish strength & the MACD line’s distance from the signal line being too far off to tell if there will be a bullish crossover or not.
Volumes were +3.02% above average compared to the previous year (36,169,400 vs. 35,108,235), which is interesting as unlike SPY & QQQ, IWM’s average volume has increased by +2.43% (34,276,900) since the 3/31/2024 post.
This has been heavily influenced by the high volumes IWM has experienced since mid-July, but is still worth noting given the other differences between the way SPY & QQQ have traded over the past year vs. IWM & DIA.
One interesting thing of note for IWM compared to QQQ is that Monday opened in a similar fashion in terms of a gap down, but the session’s low was supported by the 200 day moving average & then continued higher throughout the week until Wednesday it opened at the 50 day moving average’s resistance & took a similar tumble as the other major index ETFs.
Tuesday’s high wave candle also did not even come near the 50 DMA’s resistance on the upper shadow, indicating that there is still likely more appetite to the downside.
Thursday’s candle formed a bullish harami pattern with Wednesday’s previous wide-range bearish engulfing pattern, which based on the close being the high (or close to high, based on upper shadow) of the day & Friday’s hanging man candle seems to have been a false bullish flag.
Volumes were inconsistent though, as while three of the five sessions of the week were bearish, Friday’s risk-off into the weekend low volume hanging man candle is certainly a head scratcher for the coming week.
By Wednesday the 10 DMA will likely have crossed bearishly through the 50 DMA, which will cause both to put downward resistance pressure on IWM & begin to push its price into the support of the 200 DMA & the $196.70-198.60 support zone that has been established in 2024.
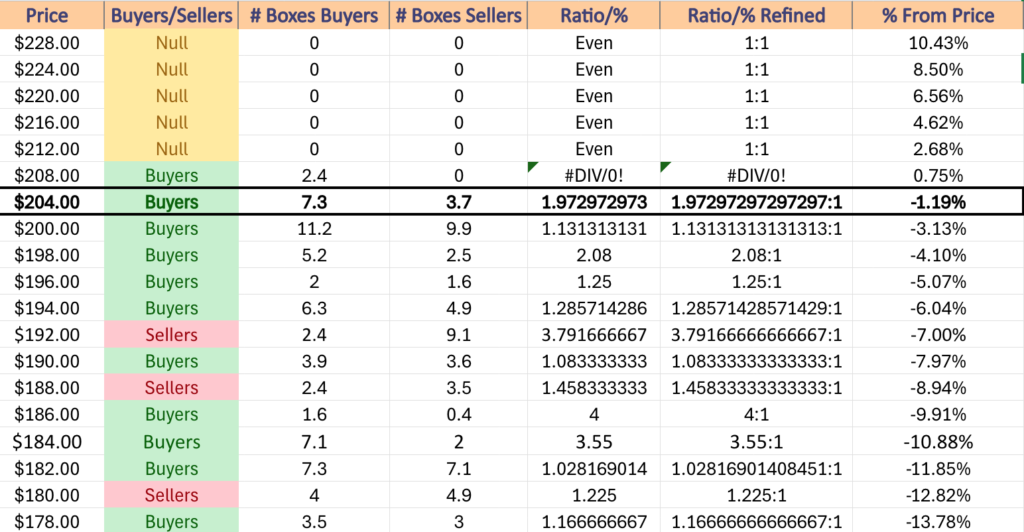
Another thing to note regarding IWM’s current price level is that the lower end of the range that they have oscillated around in for most of 2024 to date is currently ~9.7% below Friday’s closing price.
Support levels between the two prices are mostly in favor of the buyers, but should prices dip down into the $192-193.99/share level it will be a time to take caution, as over the past 1-2 years this range has been dominated by the Sellers at a rate of 3.79:1.
The good news is that if that $186.53 support level is tested, Buyers have been stronger than Sellers in that $186-187.99 range, at a rate of 4:1, although if that test comes there will be other considerations to take based on where moving averages are in relation to one another & price.
IWM has support at the $204.40 (Volume Sentiment: Buyers, 1.97:1), $202.47 (Volume Sentiment: Buyers, 1.13:1), $198.60 (Volume Sentiment: Buyers, 2.08:1) & $197.41/share (Volume Sentiment: Buyers, 1.25:1) price levels, with resistance at the $207.87 (50 Day Moving Average, Volume Sentiment: Buyers, 1.97:1), $209.19 (Volume Sentiment: Buyers, 2.4:0*), $209.29 (Volume Sentiment: Buyers, 2.4:0*) & $211.29/share (Volume Sentiment: Buyers, 2.4:0*) price levels.
DIA, the SPDR Dow Jones Industrial Average ETF dipped -0.5% last week, having the second worst week of the major four index ETFs.
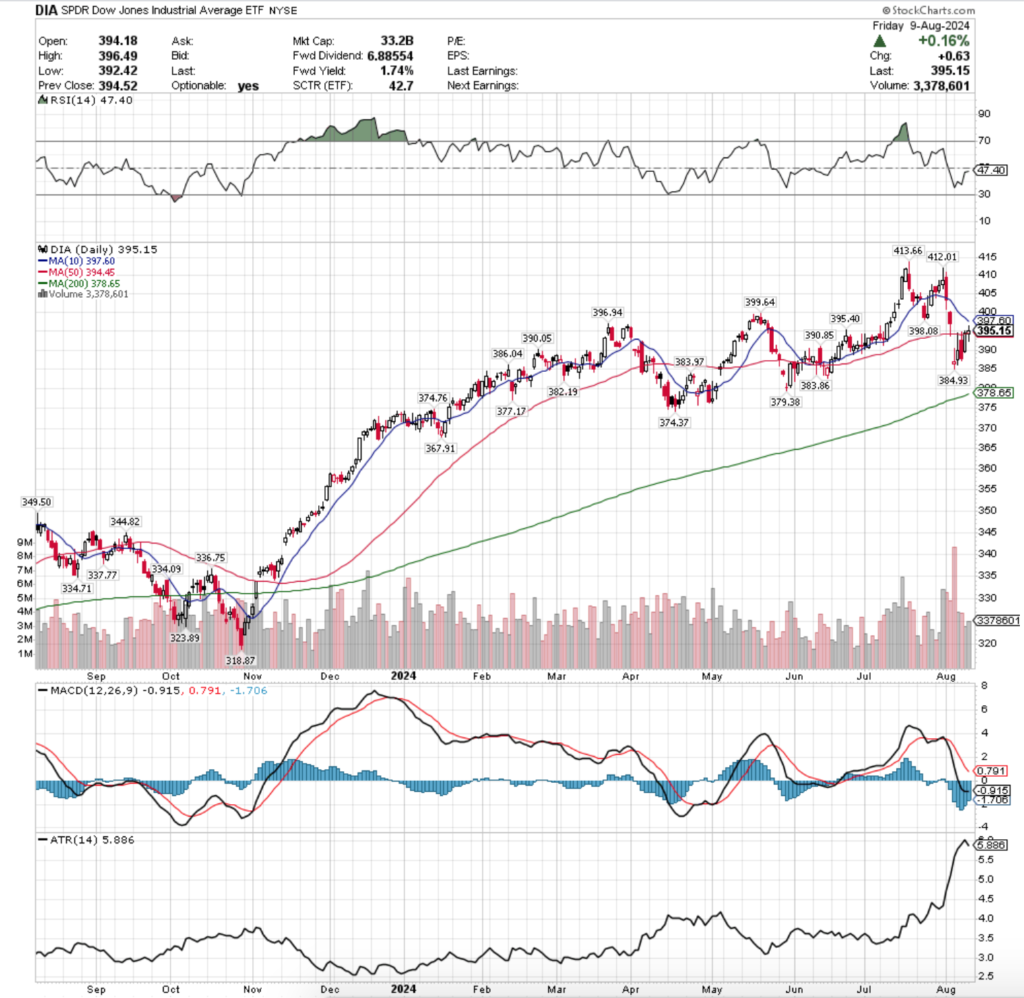
Their RSI is flat like IWM’s, while sitting just below the neutral 50 mark & is currently at 47.4, while their MACD is in a similar boat to IWM’s as well, but slightly more horizontal.
Volumes were +29.8% above the prior year’s average volume (4,616,180 vs. 3,556,496), which like IWM is higher than their average annual volume reading from 3/31/2024 by +4.45% (3,405,069 from 3/31/2024).
This can also be largely attributed to the past month & a half’s performance, although DIA’s volume was one of the more consistent of the major four indexes over the past handful of months, as investors & traders showed favor to blue chip names.
One thing of interest for DIA that did not impact the other three indexes is that last week began & ended on notes of uncertainty, with spinning tops for both Monday & Friday’s session.
Monday’s volume towered over the rest of the week’s though, with Thursday having the lowest volume, followed by Friday.
Tuesday’s candle was a clear indicator that the bulls were not in charge & likely will not be heading into this coming week, as prices were able to advance up to the 50 day moving average before retreating back down to settle near $390/share.
Wednesday’s candle was not a bearish engulfing candle as it closed ~$0.20 above Tuesday’s open, but the similar levels of volume between the two days indicated that there was heavy profit taking.
Wednesday’s session also flirted with the 50 DMA but was unable to close anywhere near it, as investors hopped out of the pool.
Thursday opened in the middle of Wednesday’s price range & was able to close at the 50 DMA, setting up Friday to open the session on the 50 DMA.
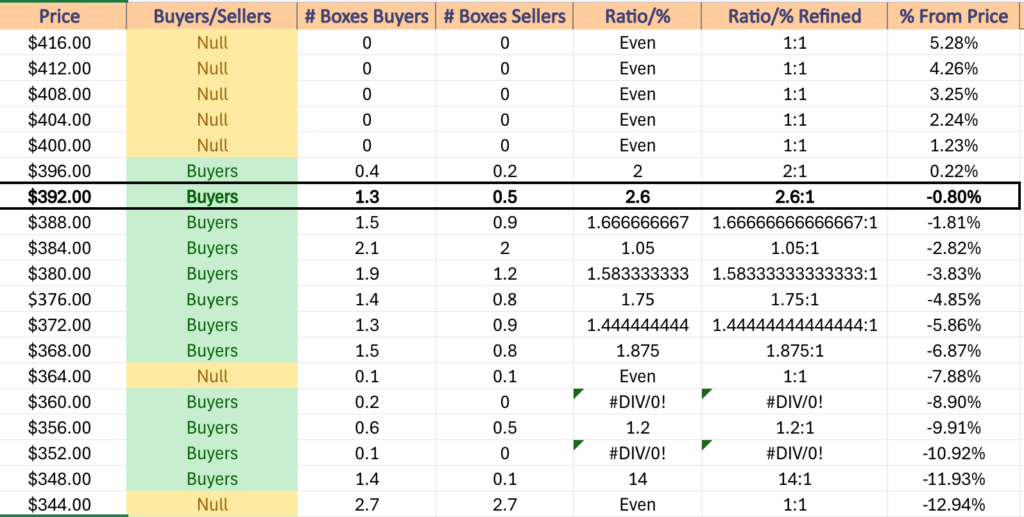
While Friday was able to advance +0.16%, the low volume signals that the strength of the support at the 50 DMA is questionable at this time, despite the $392-395.99/share price level being Buyer dominated at a rate of 2.6:1 over the past few years.
DIA has a similar setup for support as IWM’s in terms of spending most of 2024 oscillating around a price range, making their near-term volumes even more important than usual, as market participants will be what determines the strength or weakness of these support & resistance levels.
Their 10 day moving average will likely cross over their 50 day moving average by mid-week bearishly, which will also apply downwards pressure on prices, but whether it will be outright declines due to bad data/earnings or a more gentle consolidation within the real body range of Wednesday’s candle has yet to be seen.
DIA has support at the $394.45 (50 Day Moving Average, Volume Sentiment: Buyers, 2.6:1), $390.85 (Volume Sentiment: Buyers, 1.67:1), $390.05 (Volume Sentiment: Buyers, 1.67:1) & $386.04/share (Volume Sentiment: Buyers, 1.05:1) price levels, with resistance at the $395.40 (Volume Sentiment: Buyers, 2.6:1), $396.94 (Volume Sentiment: Buyers, 2.6:1), $397.60 (Volume Sentiment: Buyers, 2.6:1) & $399.64/share (Volume Sentiment: Buyers, 2.6:1) price levels.
The Week Ahead
Monday starts off on a quiet note in terms of economic data, with the Monthly U.S. Federal Budget data at 2pm.
Ballard Power, Esperion Therapeutics, Fortrea, KE Holdings & Monday.com all report earnings before Monday’s opening bell, followed by Alcon, DHT, Kodiak Gas Services, PACS Group & Rumble after the session’s close.
NFIB Optimism Index data is released Tuesday morning at 6 am, followed by Producer Price Index, Core PPI, PPI Year-over-Year & Core PPI Year-over-Year data at 8:30 am.
Tuesday morning begins with earnings from Home Depot, Hudbay Minerals, Hut 8 Mining, HUYA, IHS Holding Limited, James Hardie, Loar Holdings, Melco Resorts & Entertainment, Mersana Therapeutics, MSG Sports, ON Semiconductor, Paysafe, Sea Limited, Sun Life, Talen Energy & Tencent Music, with Duos Technologies Group, Franco-Nevada, Ibotta, Intapp, Kyverna Therapeutics, Mercury, NCR Atleos, NeuroPace, Nu Holdings, U.S. Physical Therapy & XP all reporting after the session’s close.
Wednesday morning at 8:30 am brings us Consumer Price Index, CPI Year-over-Year, Core CPI & Core CPI Year-over-Year.
Arcos Dorados, Brinker International, CAE, Cardinal Health, Dole, Global-E Online, Marex Group, Performance Food Group, Riskified, SFL Corp, Smith Douglas Homes, UBS & Workhorse Group are due to report earnings Wednesday morning, with Cisco Systems, dLocal Limited, Lumentum, Paycor & StoneCo all due to report after the closing bell.
Initial Jobless Claims, Empire State Manufacturing Survey, Philadelphia Fed Manufacturing Survey, U.S. Retail Sales, Retail Sales minus Autos, Import Price Index & Import Price Index Minus Fuel data are all released at 8:30 am on Thursday, Industrial Production & Capacity Utilization data are announced at 9:15 am & Business Inventories data is released at 10 am.
Thursday morning’s earnings calls include Walmart, Alibaba Group Holding, Applied Industrial, Cellebrite, Grab Holdings, NICE, SpartanNash & Tapestry, before Amcor, Applied Materials, Coherent, H & R Block & Ross Stores report after the closing bell.
Friday morning kicks off with Housing Starts & Building Permits data at 8:30 am, followed by Consumer Sentiment (prelim) & Home Builder Confidence Index data at 10 am.
Flower Foods & CI&T report earnings Friday before the opening bell.
See you back here next week!
*** I DO NOT OWN SHARE OR OPTIONS CONTRACT POSITIONS IN SPY, QQQ, IWM OR DIA AT THE TIME OF PUBLISHING THIS ARTICLE ***