SPY, the SPDR S&P 500 ETF gained +4% this past week, although volumes became heavily muted again, while the VIX closed the week at 14.8, indicating an implied one day move of +/-0.93% & a one month implied move of +/-4.28%.
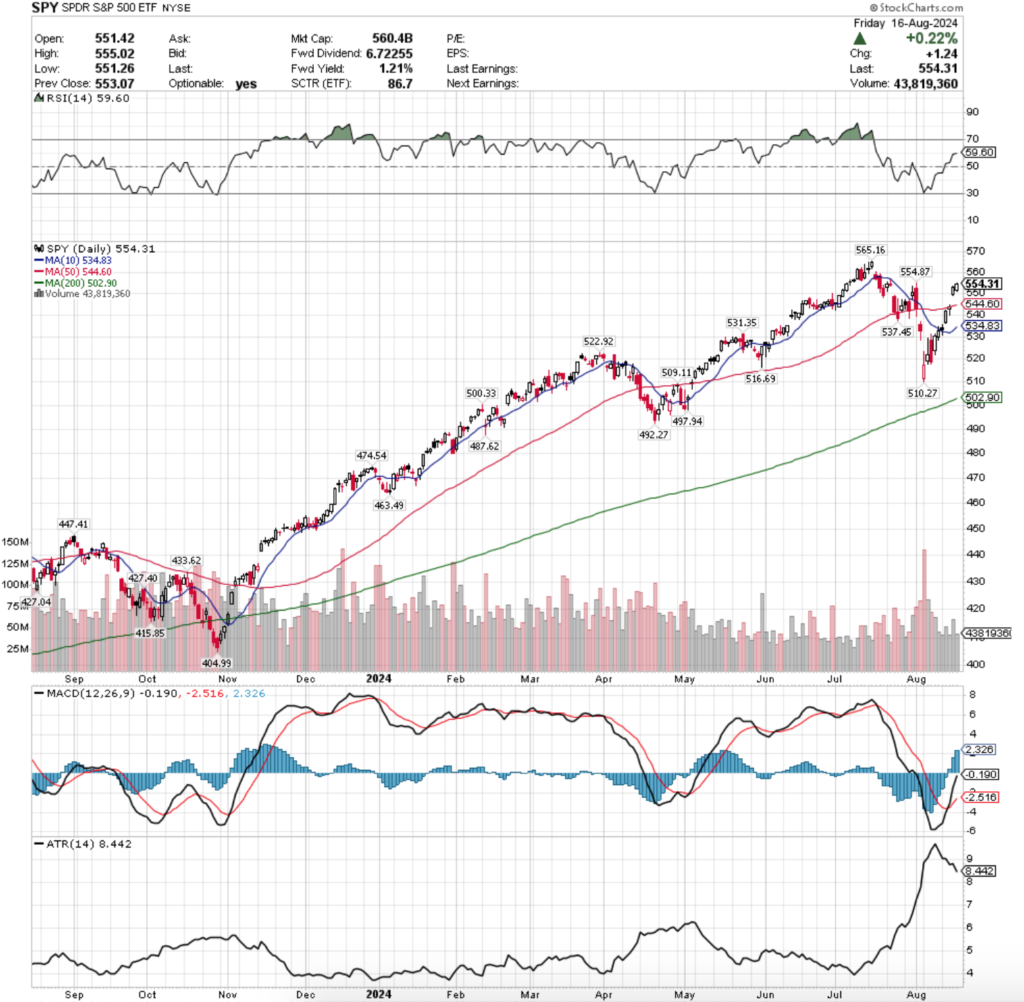
Their RSI has recently flattened out after climbing up to 59.6, while their MACD has crossed over bullishly in the wake of the run up of the past couple of weeks.
Volumes were dismal, coming in -32.36% below average for the week vs. the previous year (47,394,583 vs. 70,064,027), which as noted last week is even lower than what it appears, given that last week’s average annual volume (70,443,801) is -9.54% less than what the annual average volume was on 3/31/2024 (77,829,780).
Due to the low volumes since May dragging the average down this average volume is -39.1% down from March of 2024’s average, indicating a severe lack of participation that while summer vacations may explain some of, is still not a sign of overall confidence in stocks at these price levels.
Monday began SPY’s week on a note of uncertainty, as the session opened above the resistance of the 10 day moving average, it fluctuated around it all day before closing below it’s opening price, just above the 10 DMA’s support on very low volume.
Tuesday opened with a gap higher that never tested the 50 day moving average’s resistance, but was a wide range session that moved just beneath it by the close.
Tuesday’s volume was higher than Monday’s & the second highest of the week, but was still unremarkable when compared to the average volume statistics noted above.
Wednesday’s session was interesting, as the day opened higher, retraced down ~25% of Tuesday’s candle’s real body, while also testing & briefly breaking above the resistance of the 50 day moving average, before ultimately closing slightly higher near the 50 DMA.
What made Wednesday’s session even more interesting was that the volume was also very low like Monday’s, the session closed by the 50 DMA & the resulting candlestick was a hanging man (bearish).
Things got more interesting Thursday, when on the week’s highest volume SPY gapped dramatically higher & based on the size of the upper & lower shadows of the day’s candle, did not stray much higher or lower than the day’s opening & closing prices.
The week closed on another light volume day (middle of the five days) with Friday opening near the top third of Thursday’s candle, not testing much lower, before advancing to close +0.22% for the day.
As has been noted for the last few weeks, paying attention to volume flows will be particularly important in the coming week(s), as while prices are moving upwards, there has been such limited participation that it is difficult to see price action reflecting true bullish sentiment.
The “Adam” scallop formed during August does not reflect anything that looks confidently bullish, and with the low participation rates we’ve been seeing now for months it is difficult to see enough strength being generated to force any major upwards movements that challenge/break past the all-time SPY high from July.
The coming week features the July FOMC minutes being released on Wednesday, more earnings reports & Fed Chair Powell speaking on Friday at Jackson Hole, making it very likely that we’re looking at one final squeeze before a long couple of months.
It is also worth noting that SPY does not often gap up twice in 10 days without some form of consolidation/losses in the very near-term, which is something that should be kept in mind moving into the new week.
While SPY’s MACD is bullish, it is at the steepest incline since the end of October/early November 2023, back when volumes were much higher than they’ve been for the past few months.
This raises a skeptical brow when looking at recent results given that the low participation rate means that there is not much fuel pushing prices higher.
Wednesday & Friday will be interesting days to watch, particularly as their RSI continues to reach higher & inch closer towards overbought conditions.
Also, on the news/earnings front it is important to note that NVDA will be reporting next week, which if it doesn’t impact volumes in the meantime for SPY will show that the markets are currently running on fumes.
It’s tough to see a stab taken again at breaking the all-time high price in the near-term, particularly as while SPY broke above the $554.87/share resistance point briefly on Friday, it retreated back towards it by the close to close below it.
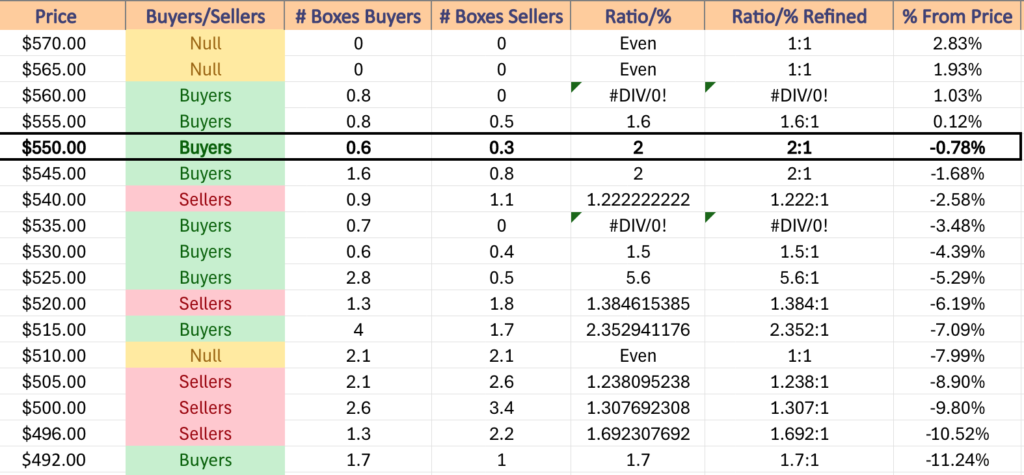
SPY has support at the $544.60 (50 Day Moving Average, Volume Sentiment: Sellers, 1.22:1), $537.45 (Volume Sentiment: Buyers, 0.7:0*), $534.83 (10 Day Moving Average, Volume Sentiment: Buyers, 1.5:1) & $531.35/share (Volume Sentiment: Buyers, 1.5:1) price levels, with resistance at the $554.87 (Volume Sentiment: Buyers, 2:1) & $565.16/share (All-Time High, Volume Sentiment: NULL, 0:0*) price levels.
QQQ, the Invesco QQQ Trust ETF advanced +5.47% last week, as investors most eagerly piled into the technology heavy index (figuratively, as volumes were still very low).
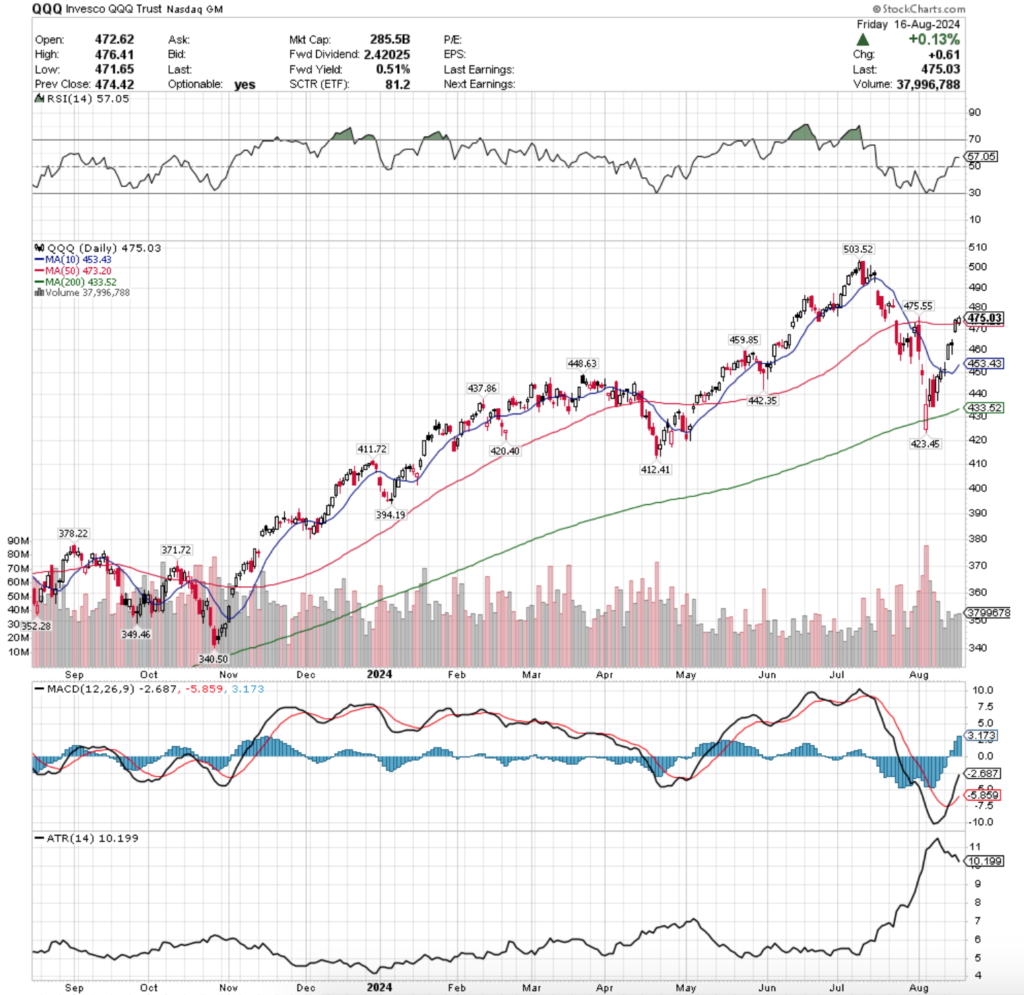
Their RSI has also flattened out after advancing for the past two weeks & currently sits at 57.05, while their MACD is bullish after crossing the signal line on Wednesday.
Volumes were -18.76% below the previous year’s average (35,824,206 vs. 44,097,003), indicating that the near-term risks outlined in SPY above are also impacting QQQ & should be though about while analyzing the current state of the market.
When comparing this past week’s volume to that of 3/31/2024 it is -27.3% lower (vs. 49,253,412), which throws out any idea of the current market environment being strong.
Monday the week began with the lowest volume of the week, & on a note of uncertainty, as the day closed in a long-legged doji that opened & closed above the 10 day moving average’s support, but also tested below it.
Bulls proved to be the winners on Tuesday though, when the week’s highest volume propelled QQQ to a gap up session that only tested higher as the day wore on.
Volume dipped a little bit on Wednesday, which despite being much higher than Monday’s levels gave off a bearish feeling as the session ended as a hanging man candle that closed below it’s open after opening on a gap up.
Thursday produced another gap up & the third highest volume of the week, which while like Tuesday also did not test much higher above or below the open or close, was able to break above & close above the resistance of the 50 day moving average.
Friday closed the week out on a note of further uncertainty/reason for skepticism, as despite having the week’s second highest volume, the day opened in line with the 50 day moving average, tested lower & higher before settling higher into an uncertain spinning top candle that’s straddling the 50 DMA.
Given the events of the coming week or two that adds to the idea of the last attempt at a pump before disappointment keeps a new all-time high from being established for QQQ.
As volume continues to be a main point of interest & SPY & QQQ’s charts are still highly similar we’ll focus more on the current positioning of QQQ’s moving averages to look at in addition to their volume (also applicable to SPY).
4.76% separate QQQ’s 10 & 50 day moving averages, with the 10 DMA having curled upwards on Wednesday.
-4.39% to the south of QQQ’s 10 DMA lies its 200 DMA, while prices on Friday closed only +0.39% above the 50 DMA’s support.
Prices have now been condensing & drawing the three moving averages & price closer together during a period of low volume.
While the volume doesn’t exactly align, QQQ’s one year daily chart may serve as a good reference from this time last year, as in the event that the 10 DMA crosses above the 50 DMA with the low volumes, it is likely to see similar price action as mid-September 2023.
This becomes even more interesting when the RSI is tossed into the mix, as it currently is in the same neighborhood that it was in about a year ago.
It is also worth noting that since the decline that began in July QQQ has not set any new support levels that are underneath the current price action, indicating that there is not much recent strength.
While the gaps & their upside/downside extremes can be viewed as support & resistance, this ties into the rapid rate of ascent that we’ve watched likely being unsustainable & done in precaution of declines in order to scrape out a handful of extra points to the upside from folks willing to hop back into the pool at these levels.
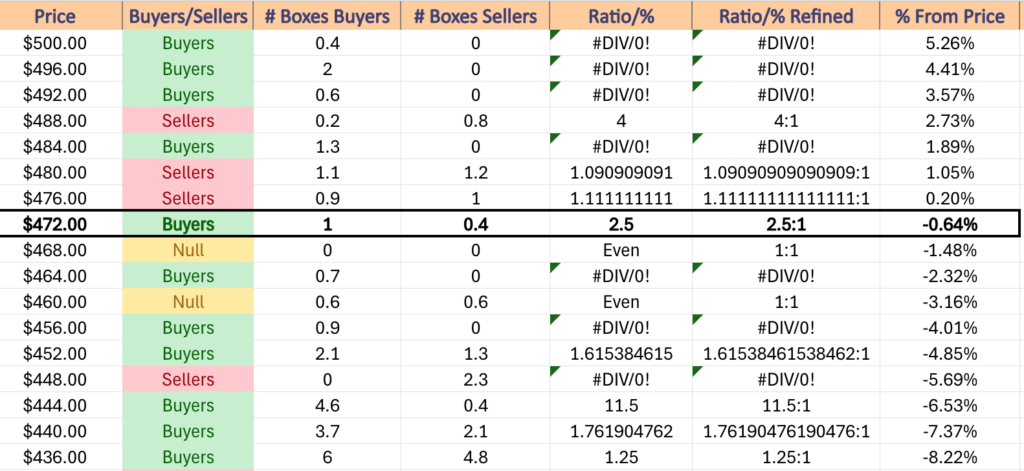
QQQ has support at the $473.43 (50 Day Moving Average, Volume Sentiment: Buyers, 2.5:1), $459.85 (Volume Sentiment: Buyers, 0.9:0*), $453.43 (10 Day Moving Average, Volume Sentiment: Buyers, 1.62:1) & $448.63/share (Volume Sentiment: Sellers, 2.3:0*) price levels, with resistance at the $475.55 (Volume Sentiment: Buyers, 2.5:1) & $503.52/share (All-Time High, Volume Sentiment: Buyers, 0.4:0*) price levels.
IWM, the iShares Russell 2000 ETF climbed +2.97% last week, mostly due to the gap up on Thursday.
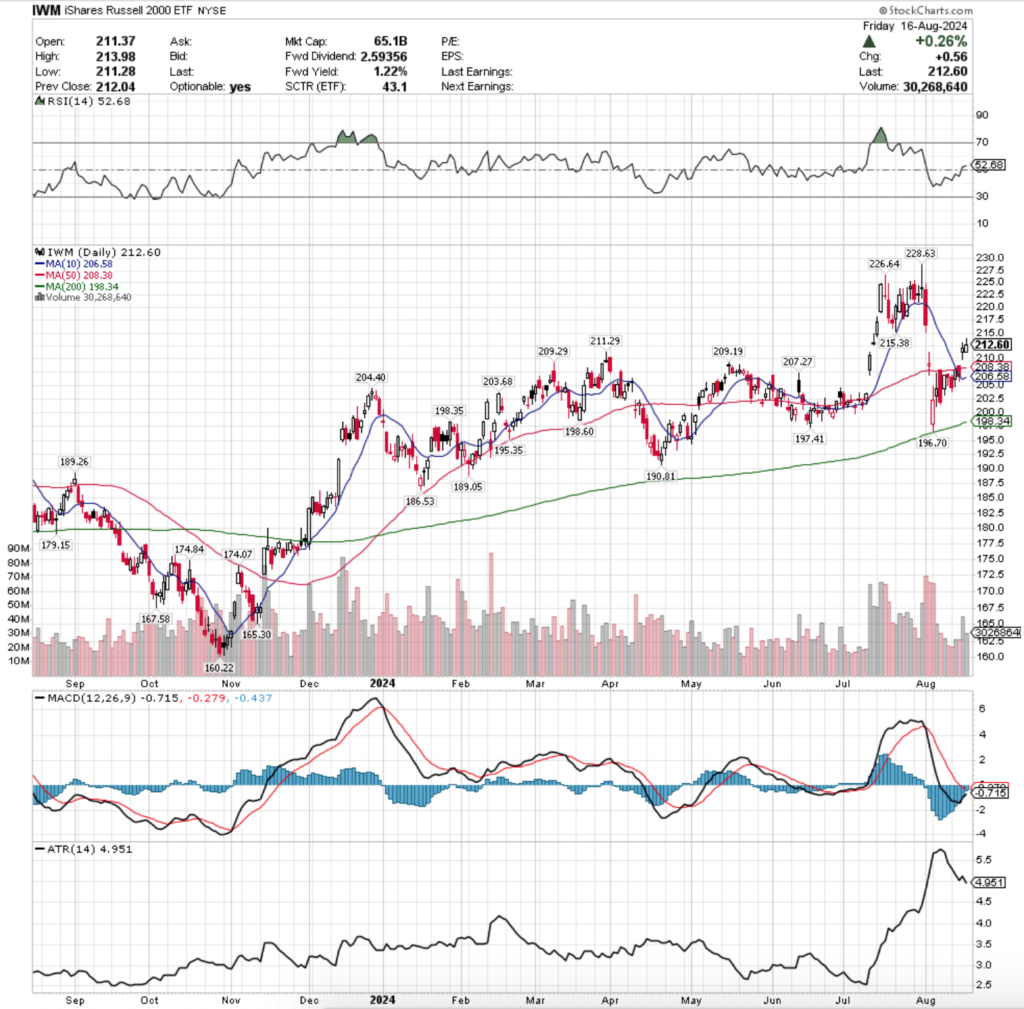
Their RSI has also begun to flatten out at 52.68, while their MACD is still in bearish territory but looks set to bullishly cross the signal line in the coming day or two.
Volumes were -17.96% below average last week compared to the year before’s average (28,824,348 vs. 35,133,049), which while it indicates weakness in the near-term is a testament of the sturdiness of IWM & its components.
Using the 3/31/2023 comparison date, current average annual volumes are +0.07% higher (3/31/2024’s avg. annual volume was 35,133,049), which is far more robust than SPY & QQQ.
This likely is primarily attributed to the lack of exposure that IWM has to NVDA & the semiconductor stocks, as well as the other artificial intelligence & data center components.
IWM’s volumes have remained relatively consistent over the past year, with random fluctuations that went both to the upside & downside here & there; however the recent low volumes should be viewed the same as those of SPY & QQQ in terms of poor participation equaling poor sentiment & weakness.
Monday kicked off IWM’s week on a bearish note & weak volume, before Tuesday was able to open higher, tested most of Monday’s range to the downside, before rallying higher & closing at the point where the 10 & 50 day moving average’s were meeting.
Wednesday is when the 10 DMA officially crossed below the 50 DMA, which was interesting as the session opened on a gap up above both, only to test back below the 10 DMA’s support before ultimately closing in line with it.
Thursday threw a wildcard into the mix, when the week’s highest volume came about on a gap up session that resulted in a high wave spinning top, indicating that although there was a lot of movement, in the end it resulted in a high degree of uncertainty.
While the bullish won due to the advance, it was not without a challenge & there is still a bit of downside/bearish sentiment out among market participants.
Friday’s candle is not a shooting star (bearish), but certainly looks like one if its real body was smaller.
The upper shadow does indicate that there is not much more upside appetite for IWM from the current price levels, although that could be changed if there was more upside volume in the next week or so, but the current picture is not painting that to be likely.
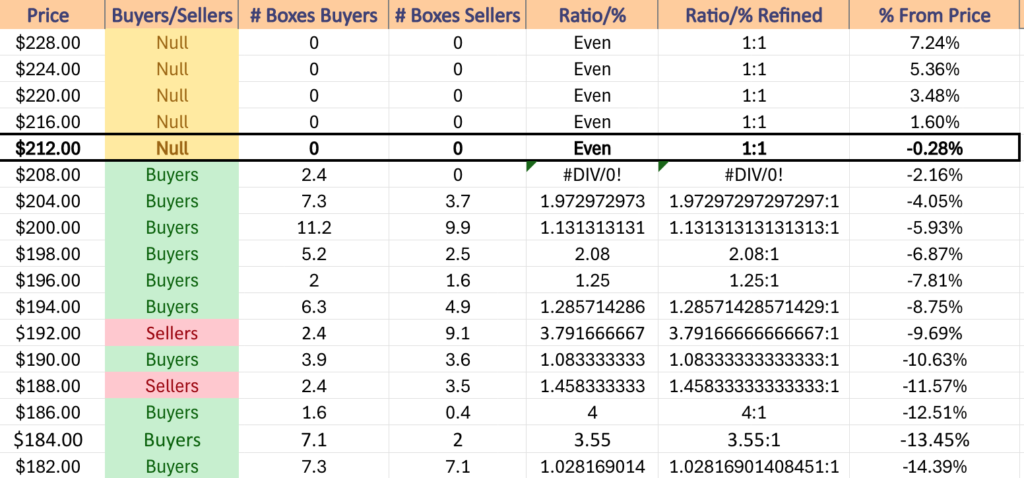
For IWM, it would be wise to watch the support & resistance levels & their historic volume sentiment this coming week, as they tend to fluctuate around price levels more often than SPY & QQQ.
In the event that the 10 DMA bullishly crosses the 50 DMA, if there is not sufficient volume behind the movement then there is still reason to be near0-term skeptical, particularly due to all of the events on the near-term horizon.
IWM has support at the $211.29 (Volume Sentiment: Buyers, 2.4:0*), $209.29 (Volume Sentiment: Buyers, 2.4:0*), $209.19 (Volume Sentiment: Buyers, 2.4:0*) & $208.38/share (50 Day Moving Average, Volume Sentiment: Buyers, 2.4:0*) price levels, with resistance at the $215.38 (Volume Sentiment: NULL, 0:0*), $226.64 (Volume Sentiment: NULL, 0:0*) & $228.63/share (52-Week High, Volume Sentiment: NULL, 0:0*) price levels.
DIA, the SPDR Dow Jones Industrial Average ETF had the weakest week of the major four index ETFs, adding only +2.93%, despite having the sturdiest volume of the bunch.
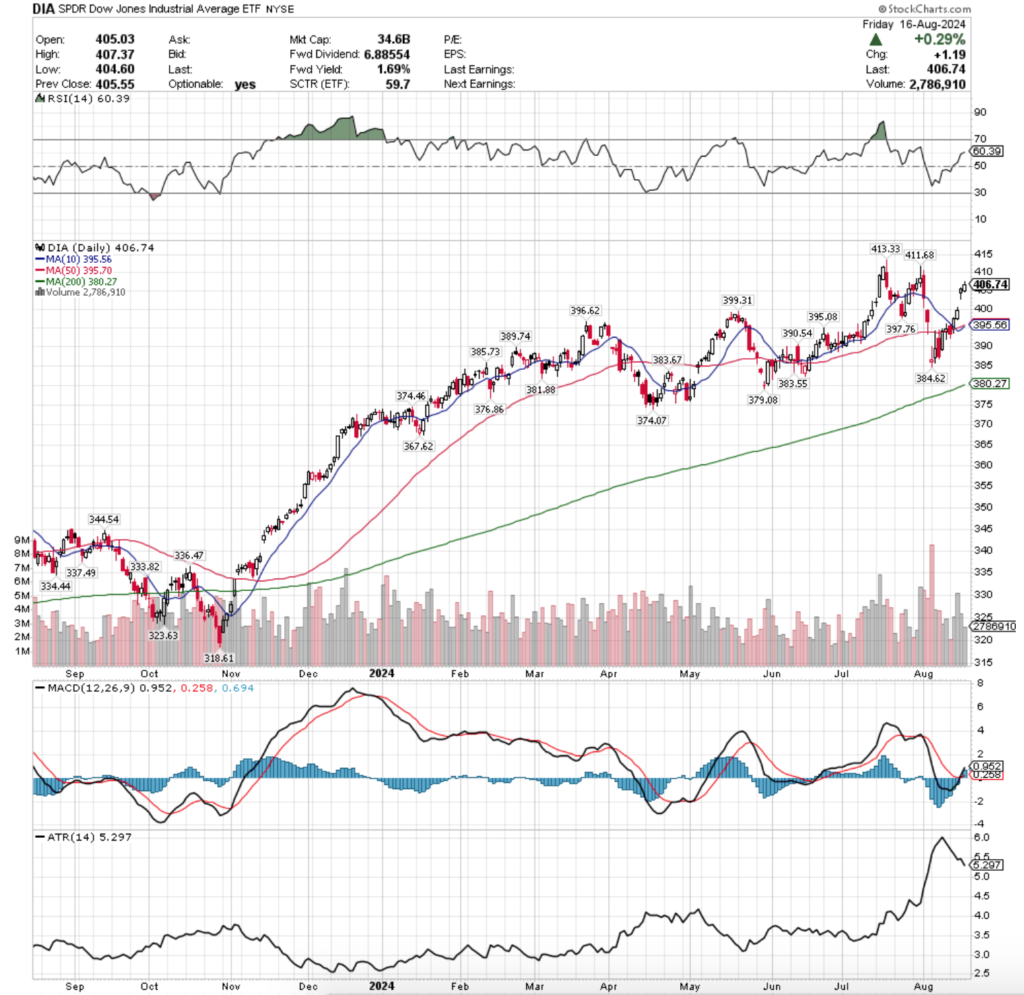
Their RSI is still advancing & sits at 60.39, while their MACD crossed the signal line bullishly on Friday.
Volumes were -3.47% below the prior year’s average (3,438,955 vs. 3,562,534), as blue chip names have maintained strength over the past year compared to the components of other indexes.
Monday was the week’s only bearish day, which also came on the lowest volume session of the week, where prices opened higher but below the 10 DMA’s resistance, before ultimately testing lower & closing below the 50 DMA’s support.
Prices also tested lower than the closing price, indicating that there was more appetite for lower prices, but the bulls were able to squeak out only a minor loss.
Tuesday had the third highest volume of the week, opening by Monday’s open, testing a little bit lower below the support of both moving averages before rallying higher & closing at about its daily high price.
Wednesday the march higher continued on the week’s highest volume before Thursday & the week’s second highest volume resulted in a gap up open.
Thursday did test lower before ultimately becoming an advancing session, while Friday also resulted in a +0.29% advance, but on the second lowest volume of the week, indicating a “soft” risk off Friday.
Due to the relatively constant demand for DIA components they may weather any near-term storms the best of the major index ETFs, but are still not subject to the same concerns outlined in the sections above.
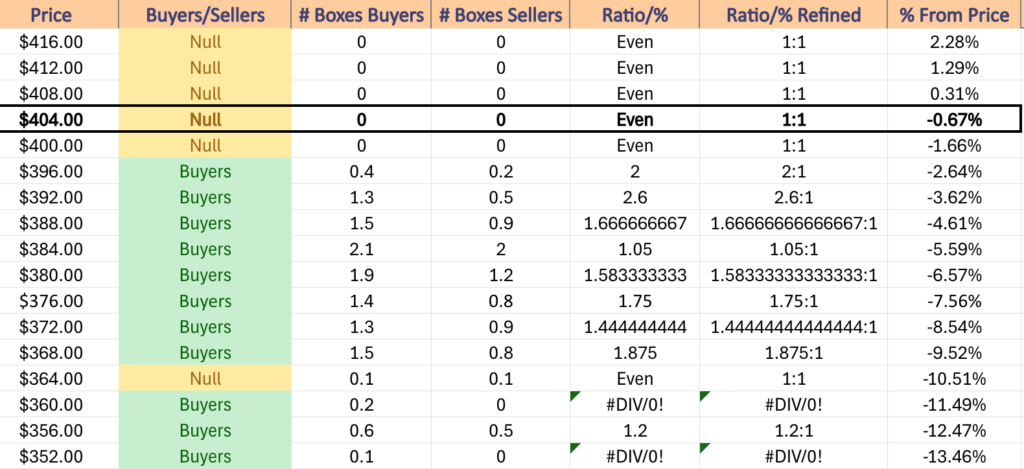
While the 10 DMA crossing the 50 DMA bullishly is imminent in the next day or so, the focus on DIA should be on volume, particularly the strength of volume at support & resistance levels.
There is a large buildup of support levels in the wake of the consolidation period that began January 2024 & has shown DIA oscillate around since which may help prevent much bleeding, but without a good deal of higher volume any moves to the upside will not be convincing without extensive confirmation.
Given that DIA is <2% from their all-time high, this should be given consideration.
DIA has support at the $399.31 (Volume Sentiment: Buyers, 2:1), $397.76 (Volume Sentiment: Buyers, 2:1), $396.62 (Volume Sentiment: Buyers, 2:1) & $395.70/share (50 Day Moving Average, Volume Sentiment: Buyers, 2.6:1) price levels, with resistance at the $411.68 (Volume Sentiment: NULL, 0:0*) & $413.33/share (All-Time High, Volume Sentiment: NULL, 0:0*) price levels.
The Week Ahead
Next week is relatively slow on the economic data front, beginning Monday with U.S. Leading Economic Indicators at 10 am.
Monday morning opens with earnings from Estee Lauder before the opening bell, followed by Fabrinet & Palo Alto Networks after the session’s close.
Tuesday features a speech from Atlanta Fed President Bostic at 1:35 pm.
Lowe’s, Amer Sports, Kingsoft Cloud, Medtronic, Premier & VIP Shop all report earnings Tuesday morning before the opening bell, with Coty, Keysight Technologies, La-Z-Boy, Toll Brothers & ZTO Express due to report after the closing bell.
Minutes of the Fed’s July FOMC meeting are released at 2pm on Wednesday.
Wednesday’s earnings calls begin with Target, Analog Devices, Dycom, Macy’s & TJX before the session’s opening bell, with Agilent Technologies, Nordson, Snowflake, Sociedad Quimica y Minera, Synopsys, Urban Outfitters, Wolfspeed & Zoom Video Communications all due to host their earnings calls after the session closes.
Thursday is a little busier, with Initial Jobless Claims at 8:30 am, S&P Flash U.S. Services PMI & S&P Flash U.S. Manufacturing PMI data at 9:45 am & Existing Home Sales at 10 am.
Advance Auto Parts, Bilibili, BJ’s Wholesale, Canadian Solar, Lancaster Colony, Peloton Interactive, Toronto-Dominion Bank, Viking Holdings & Weibo begin Friday’s earnings calls, with Intuit, Alcon, Bill.com, CAVA Group, Ross Stores & Workday all reporting after the session’s closing bell.
Friday features New Homes Sales data at 10 am & Fed Chair Powell is expected to speak at the Jackson Hole retreat & Buckle will report earnings before the session’s opening bell.
See you back here next week!
*** I DO NOT OWN SHARES OR OPTIONS CONTRACT POSITIONS IN SPY, QQQ, IWM OR DIA AT THE TIME OF PUBLISHING THIS ARTICLE ***