JXI, the iShares Global Utilities ETF has advanced +19.93% over the past year (ex-distributions, 3.17% annually) as Utilities came into focus both due to data center & AI needs, as well as for traders looking to mitigate risk while markets hover near all-time highs.
While JXI is near its all time high, it is also +30.53% above its 52-week low from October of 2023.
Some of JXI’s biggest holdings include Nextera Energy Inc. (NEE), Southern (SO), Duke Energy Corp. (DUK), Iberdrola SA (IBE), National Grid PLC (NG), Constellation Energy Corp. (CEG), Enel (ENEL), American Electric Power Inc. (AEP), Sempra (SRE) & Dominion Energy (D).
With this in mind, it is important to understand previous investor behavior when JXI has traded in the price ranges it is in now, especially as its components all look to have more volatility ahead.
Below is a brief review of JXI’s recent technical performance, followed by the volume sentiments for each of the price levels that they have traded at over the past ~10 years, in order to have an idea as to how they may behave again at these levels.
It is not intended to serve as financial advice, but rather as an additional tool to reference while performing your own due diligence into JXI.
Technical Analysis Of JXI, The iShares Global Utilities ETF
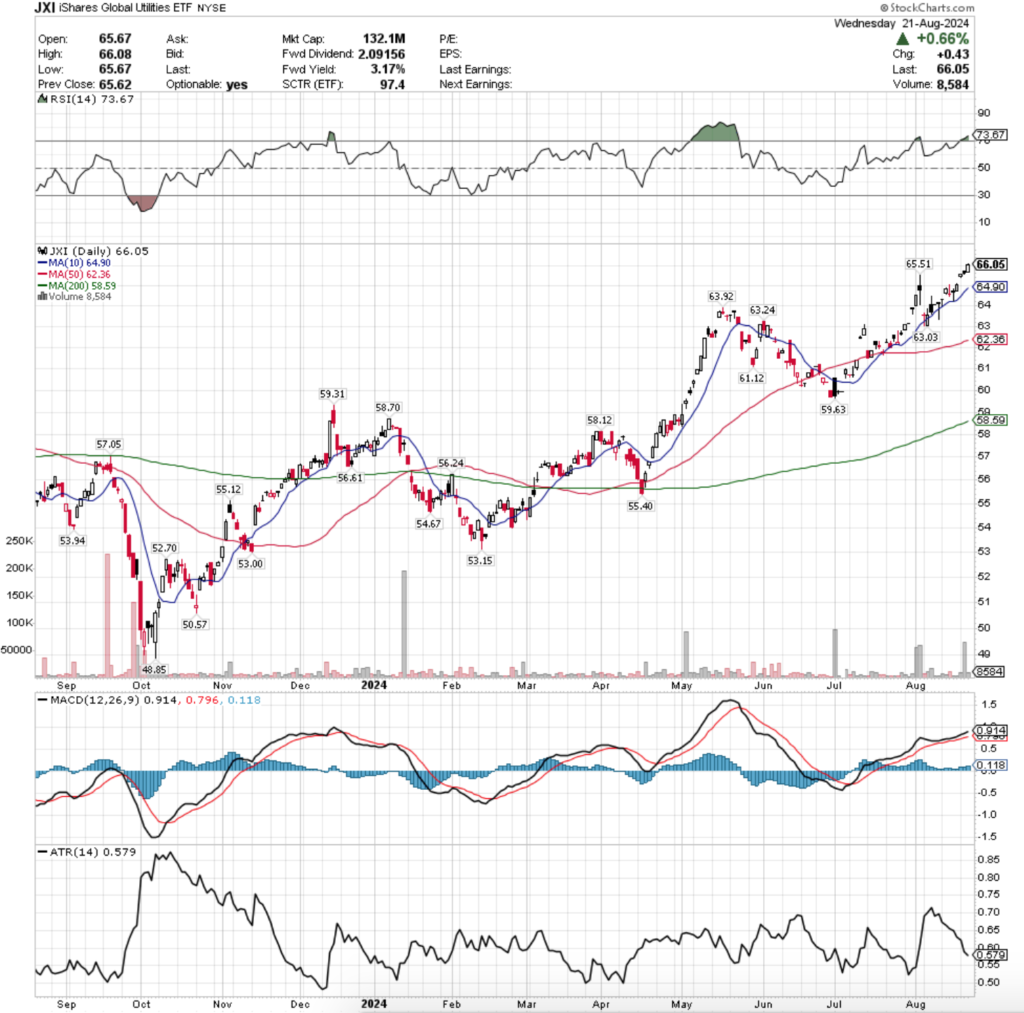
Their RSI is in overbought territory & sits currently at 73.67, while their MACD is still bullish, but has been riding up against the signal line for the most part in August.
Their volume over the past week has been +47.36% above average compared to the previous year’s average volume (16,100 vs. 10,925.79), which while they tend to trade at low volumes is still a remarkable uptick over the past five sessions.
Yesterday marked a new all-time high for the global utilities ETF & while markets may see an uptick in volatility in the near-term JXI may be less susceptible to pain in a downturn for the reasons noted above.
JXI opened this week on a gap up which will be an area to keep an eye on next week, as if they decline beyond their $65.51 support level they’ll enter the window it created & head towards the support of the bottom of the window & the 10 day moving average.
Given that the next support level is $63.92, that would put JXI up to possibly test the gap created by last Tuesday’s advancing session.
While JXI has low trading volumes on average, volume is the blood that keeps financial instruments alive & it will be important to have an understanding of how investors have behaved at different price levels over the years.
The table in the section below can be used in addition to your other due diligence tools to shed light on how the market may behave at these levels if they’re tested again.
JXI, The iShares Global Utilities ETF’s Price Level:Volume Sentiment Broken Down
The top table below shows the support & resistance levels of JXI ETF from the past year’s chart, as well as their price level:volume sentiment at each, using Monday’s closing price.
The moving averages are denoted with bold.
The next charts show the volume sentiment at each individual price level JXI has traded at over the past ~10 years.
Beneath them is a copy & pasteable list of the same data, where the support/resistance levels are denoted in bold.
All ratios with “0” in the denominator are denoted with a “*”.
NULL values are price levels that had limited trading volume, whether it be due to gaps, quick advances or they are at price extremes; in the event that they are retested & there is more data they would have a distinct “Buyers”, “Sellers” or “Even” title.
This is not intended as financial advice, but rather another tool to consider when performing your own research & due diligence on JXI ETF or any of its components.
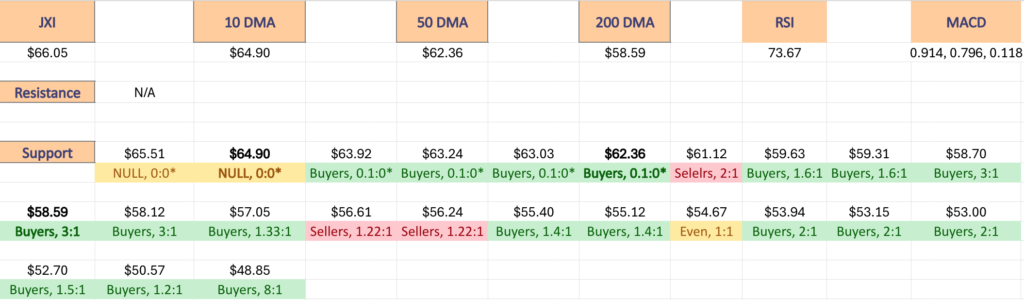
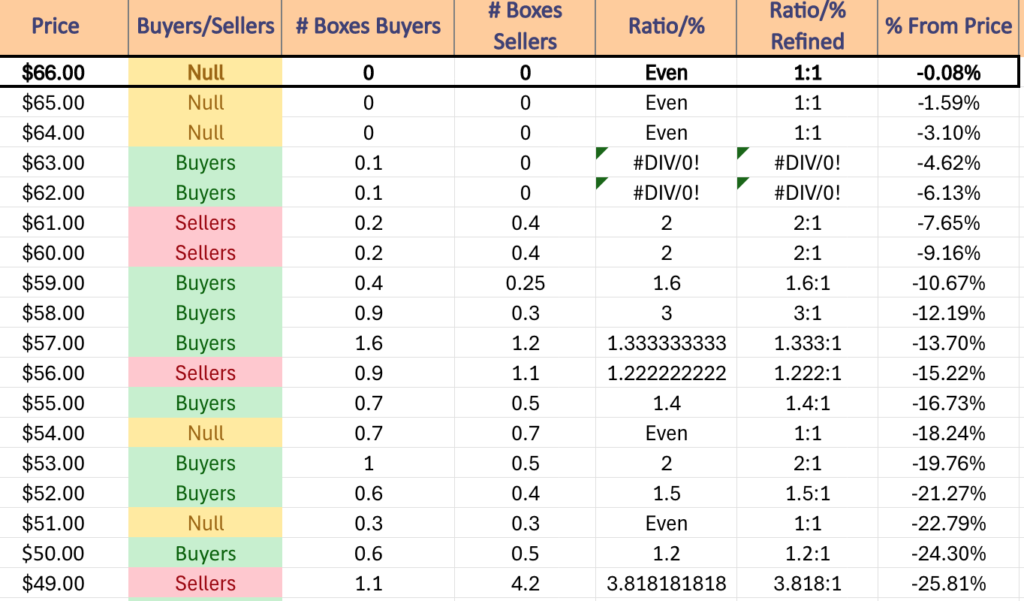
$66 – NULL – 0:0*, -0.08% From Current Price Level – Current Price Level*
$65 – NULL – 0:0*, -1.59% From Current Price Level
$64 – NULL – 0:0*, -3.1% From Current Price Level – 10 Day Moving Average*
$63 – Buyers – 0.1:0*, -4.62% From Current Price Level
$62 – Buyers – 0.1:0*, -6.13% From Current Price Level – 50 Day Moving Average*
$61 – Sellers – 2:1, -7.65% From Current Price Level
$60 – Sellers – 2:1, -9.16% From Current Price Level
$59 – Buyers 1.6:1, -10.67% From Current Price Level
$58 – Buyers – 3:1, -12.19% From Current Price Level – 200 Day Moving Average*
$57 – Buyers – 1.33:1, -13.7% From Current Price Level
$56 – Sellers – 1.22:1, -15.22% From Current Price Level
$55 – Buyers – 1.4:1, -16.73% From Current Price Level
$54 – Even – 1:1, -18.24% From Current Price Level
$53 – Buyers – 2:1, -19.76% From Current Price Level
$52 – Buyers – 1.5:1, -21.27% From Current Price Level
$51 – Even, 1:1, -22.79% From Current Price Level
$50 – Buyers – 1.2:1, -24.3% From Current Price Level
$49 – Sellers – 3.82:1, -25.81% From Current Price Level
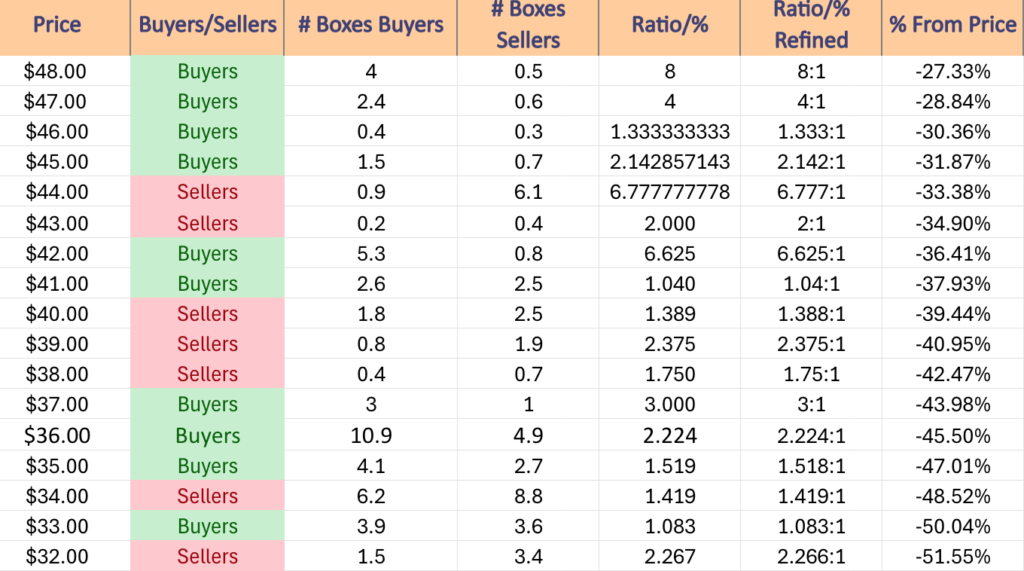
$48 – Buyers – 8:1, -27.33% From Current Price Level
$47 – Buyers – 4:1, -28.84% From Current Price Level
$46 – Buyers – 1.33:1, -30.36% From Current Price Level
$45 – Buyers – 2.14:1, -31.87% From Current Price Level
$44 – Sellers – 6.78:1, -33.38% From Current Price Level
$43 – Sellers – 2:1, -34.9% From Current Price Level
$42 – Buyers – 6.63:1, -36.41% From Current Price Level
$41 – Buyers – 1.04:1, -37.93% From Current Price Level
$40 – Sellers – 1.39:1, -39.44% From Current Price Level
$39 – Sellers – 2.38:1, -40.95% From Current Price Level
$38 – Sellers – 1.75:1, -42.47% From Current Price Level
$37 – Buyers – 3:1, -43.98% From Current Price Level
$36 – Buyers – 2.22:1, -45.5% From Current Price Level
$35 – Buyers – 1.52:1, -47.01% From Current Price Level
$34 – Sellers – 1.42:1, -48.52% From Current Price Level
$33 – Buyers – 1.08:1, -50.04% From Current Price Level
$32 – Sellers – 2.27:1, -51.55% From Current Price Level
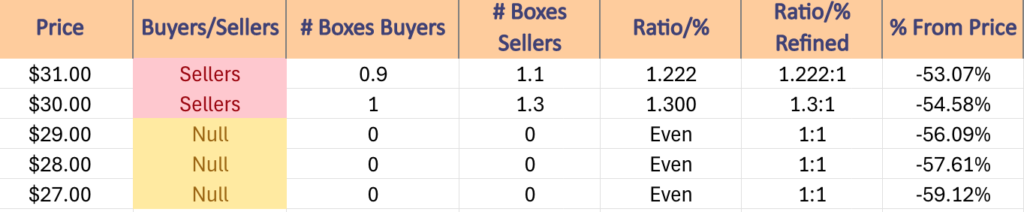
$31 – Sellers – 1.22:1, -53.07% From Current Price Level
$30 – Sellers – 1.3:1, -54.58% From Current Price Level
$29 – NULL – 0:0*, -56.09% From Current Price Level
$28 – NULL – 0:0*, -57.61% From Current Price Level
$27 – NULL – 0:0*, -59.12% From Current Price Level
*** I DO NOT OWN SHARES OR OPTIONS CONTRACT POSITIONS IN JXI AT THE TIME OF PUBLISHING THIS ARTICLE ***