SPY, the SPDR S&P 500 ETF added +0.28% this past week, while the VIX closed the week at 15.00, indicating an implied one day move of +/-0.95% & an implied one month move of +/-4.34%.
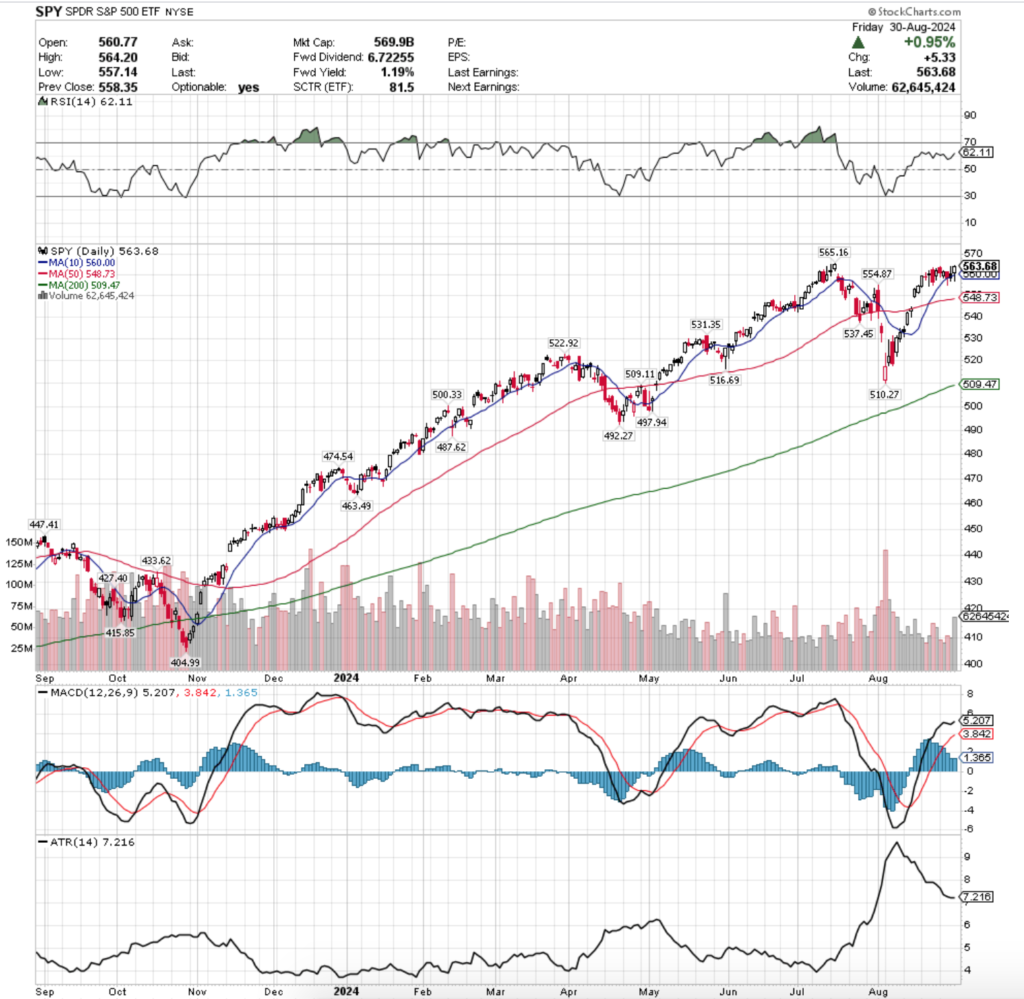
Their RSI is trending towards overbought conditions & sits at 62.11, while their MACD is bullish, but has been moving towards the signal line & its histogram is declining, indicating waning sentiment & an impending bearish crossover on the horizon.
Volumes were still weak, coming in -39.54% below the past year’s (diluted since May) average volume (41,456,061 vs. 68,568,837), as investors close out the summer months & brace for what looks set to be a more volatile September.
Monday started on as a declining day for SPY on low volume, before Tuesday recovered some of the losses but on very weak volume, indicating that there was still not much appetite for risk.
Wednesday is where the real cracks began to show for SPY, as the session resulted in a decline on the second highest volume of the week.
Recall that volume has been what we have been focusing on recently as it provides a measure of actual participation & sentiment behind the market’s movement & behavior.
When markets are off all-time highs & have limited support levels nearby the volume is going to be a great indicator of actual market sentiment.
The other warning sign that flashed on Wednesday was that while the market opened near Tuesday’s close, it tested below the support of the 10 day moving average during the day & closed in-line with it.
Given that the volume was second highest of the week, it became evident on Wednesday that we are entering another period of risk-off sentiment & what will likely become a time of heightened volatility.
Thursday continued this theme, as SPY opened at about the middle of Wednesday’s candle’s real body & tested higher, before collapsing, testing below the 10 DMA’s support again & closing lower than it opened, just beneath the 10 DMA.
Friday the bulls regained control though, although the day did test below the 10 DMA again, but at the end of the day a surge in volume compared to the rest of the week saw market participants squeeze prices higher as the day closed with a +0.95% advance.
Heading into the new week all eyes will be on the support of the 10 & 50 day moving averages for SPY, as well as its trading volume.
The consolidation range of the past couple of weeks has not shown much strength & with the low volumes that we are seeing it appears that we are due to a little break & some near-term declines.
While not all earnings disappointed, most companies have reported now leaving less chances for an upside catalyst in the near-term & the fact that neither Friday nor any day over the past month & a half have been able to reach SPY’s recent all-time high leaves little room for optimism.
Couple these points with the really low volumes we’ve been seeing & it begins to look even more bleak & less likely that we’ll find reason to begin trending upwards again in the near-term.
Given how spread out SPY’s support levels are up here, it’ll be wise to watch price in relation to the 50 DMA, as the support level is currently -2.56% (Friday’s closing levels) below their price.
While the spreads between the 10 & 50 DMA are not as narrow as they were in last September, there are certainly many similarities between what we are seeing in today’s market compared to just one year ago & it will be something to keep an eye on.
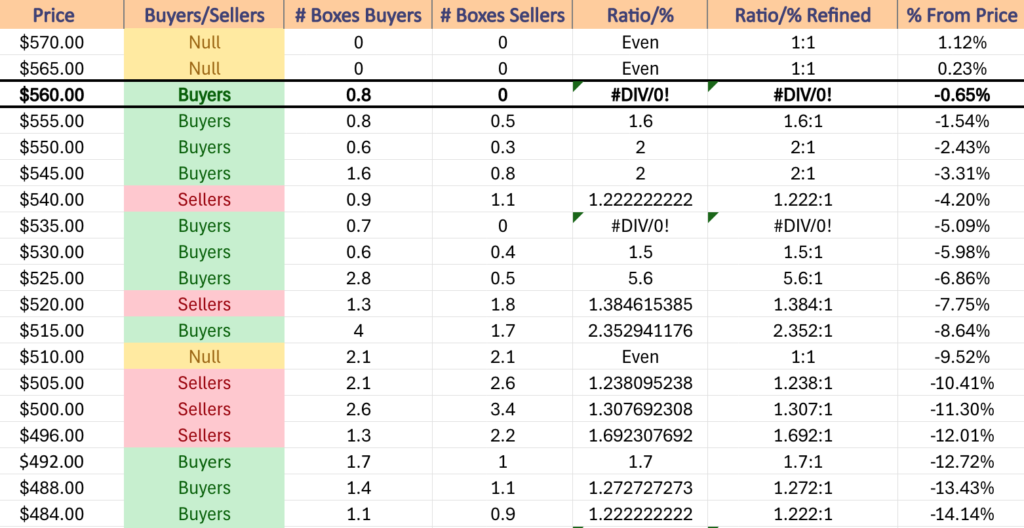
It is worth taking a look at the table below to assess the strength of their support levels, as the table displays the ratio of Buyers:Sellers (or Sellers:Buyers) at each price level SPY has traded at over the past 1-2 years & may shed light into how market participants will behave at these levels again.
SPY has support at the $560 (10 Day Moving Average, Volume Sentiment: Buyers, 0.8:0*), $554.87 (Volume Sentiment: Buyers, 2:1), $548.73 (50 Day Moving Average, Volume Sentiment: Buyers, 2:1) & $537.45/share (Volume Sentiment: Buyers, 0.7:0*) price levels, with resistance at the $565.16/share (All-Time High, Volume Sentiment: NULL, 0:0*) price level.
QQQ, the Invesco QQQ Trust ETF that tracks the NASDAQ 100 fared the worst of the major four index ETFs, declining -0.78% for the week.
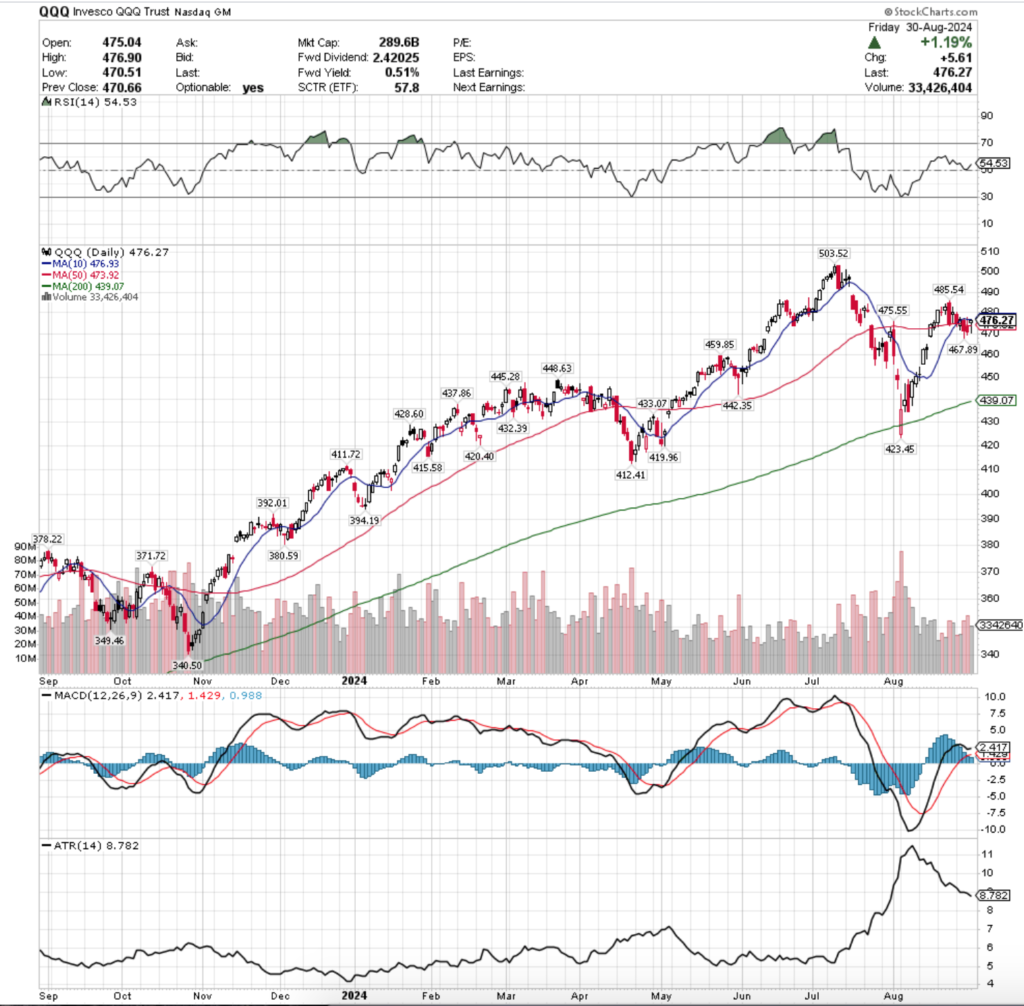
Their RSI is near the neutral 50 mark & sits currently at 54.53, while their MACD has recently remained bullish but is declining towards the signal line & looking ready to cross over bearishly in the coming day or two.
Volumes were also weak, coming in -22.79% below the prior year’s average volume (33,309,777 vs. 43,144,086), which is negative from both the perspective of a lack of participation vs. the comparison when made back in March (per 8/18/2024’s Weekly Review Note) & from the perspective of how bearish volume is standing taller at higher levels than volume does on many bullish days.
Much like SPY, QQQ’s week last week also started off on a bearish note, as Monday’s session declined to the support of their 50 DMA, which is closed near.
Tuesday opened lower but was able to break above the 50 day moving average’s resistance & briefly broke above the 10 DMA’s, but settled for the day near the 10 DMA.
Wednesday is when the fun broke out, as the session opened higher than Tuesday’s session, but ultimately sold off & formed a bearish engulfing pattern, indicating that there would be more difficulty on the horizon for QQQ.
Thursday confirmed this when QQQ declined again on the strongest volume of the week (Wednesday’s was second strongest, followed by Friday’s).
The session opened about midway through the range of Wednesday’s price action, tested higher, breaking above the 10 DMA’s resistance briefly before tumbling below the 50 DMA, testing further down & ultimately being unable to close above the 50 DMA’s resistance.
Friday’s candle would be characterized as a hanging man (bearish) if it came at the end of an uptrend & not a consolidation range, but prices were squeezed higher to celebrate the last session of August, despite the day’s lower shadow signaling that there is a lot more people are getting happy about to be found to the downside for QQQ.
As I’ve noted before, QQQ & SPY have very similar patterns, however QQQ did not ascend with as high of a velocity as SPY did over the past year, which gives them the benefit of more local support touch-points.
While this is good, one issue that they have is that even the slightest decline from Friday’s closing price puts them trading under their 10 & 50 DMA’s, with the 200 DMA only -7.8% below Friday’s close.
Still, the week ahead for QQQ might benefit from looking at their chart from this time last year & noting the similarities between September & October of 2023 to July & August 2024.
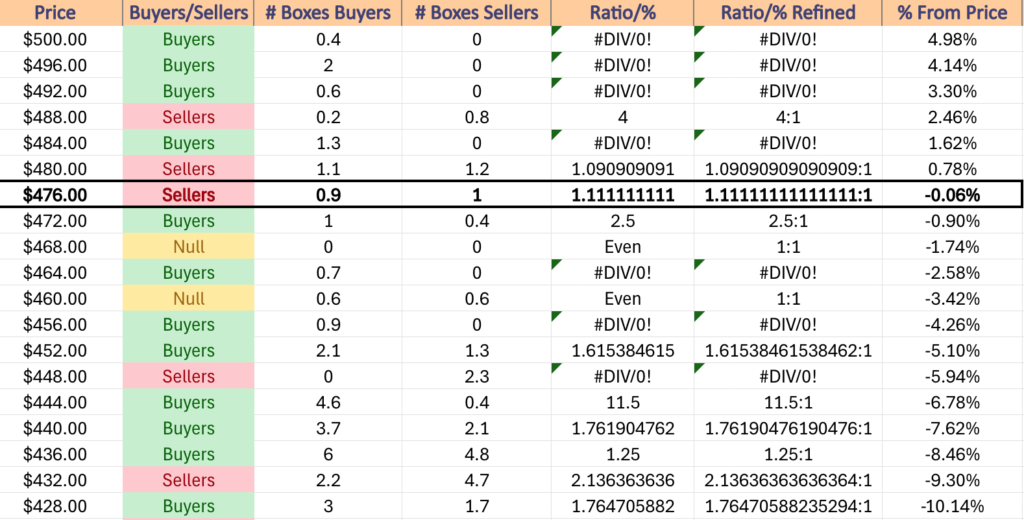
It would also be beneficial to familiarize yourself with the price level volume sentiment table below & to browse our breakdown of the buyers:sellers strength at their support & resistance levels.
It will also be interesting to see how long it takes for QQQ to begin filling its gaps from August given that their price is already getting downward pressure from the 10 & 50 DMAs & then keep track of how long it takes SPY to follow suit.
QQQ has support at the $475.55 (Volume Sentiment: Buyers, 2.5:1), $473.92 (50 Day Moving Average, Volume Sentiment: Buyers, 2.5:1), $467.89 (Volume Sentiment: Buyers, 0.7:0*) & $459.85/share (Volume Sentiment: Buyers, 0.9:0*) price levels, with resistance at the $476.93 (10 Day Moving Average, Volume Sentiment: Sellers, 1.11:1), $485.54 (Volume Sentiment: Buyers, 1.3:0*) & $503.52/share (All-Time High, Volume Sentiment: Buyers, 0.4:0*) price levels.
IWM, the iShares Russell 2000 ETF dipped -0.14% for the week, as small cap stocks remained relatively unchanged compared to the other major index ETFs.
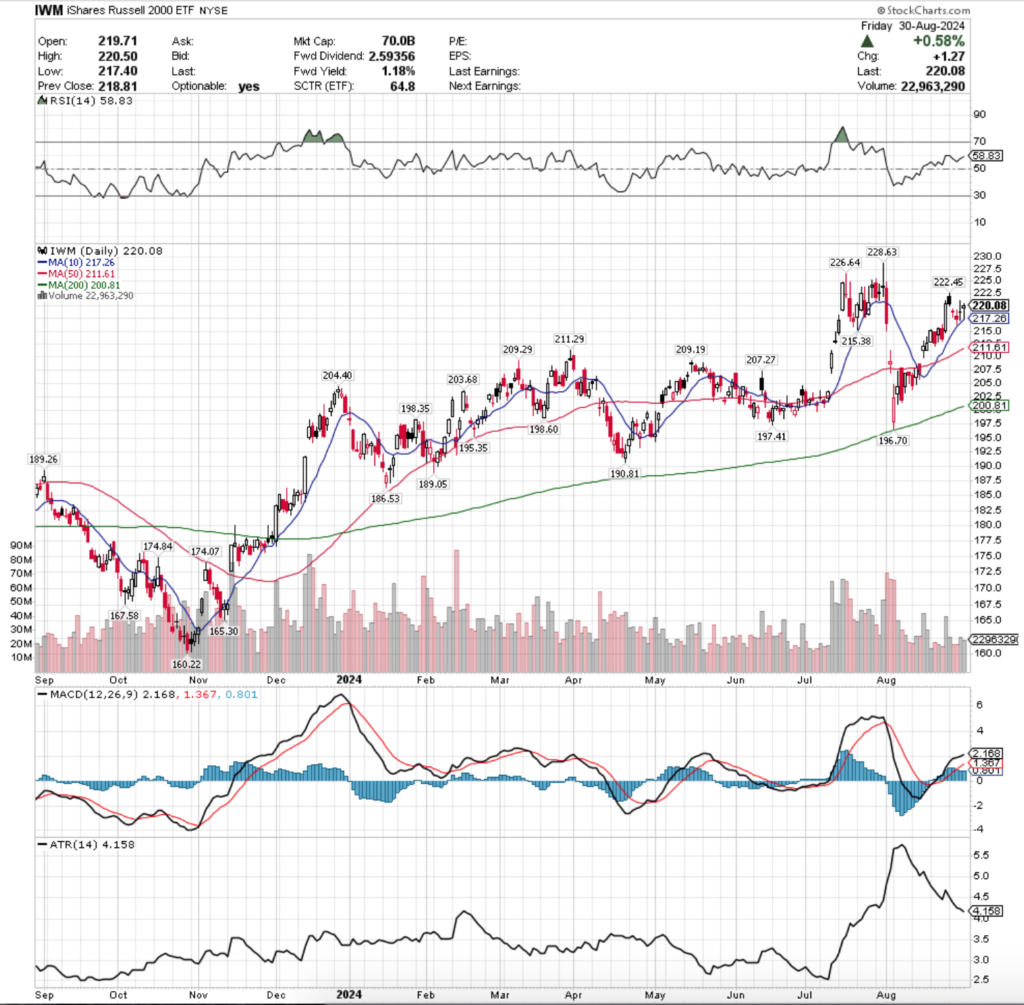
Their RSI is trending towards overbought levels & sits currently at 58.83, while their MACD is still bullish but their histogram is waning, which precedes periods of weakness.
Volumes were -36.27% below the past year’s average last week (22,325,177 vs. 35,030,586), which gives the same signals of weakness outlined for SPY & QQQ, although in a bright spot for IWM their declining days last week had the lowest levels of volume (not sure that’s much of a win, but worth noting).
Monday was a bullish day for IWM, however it was flashing bearish signals as well, as the session was unable to close above where it opened & it tested below the close of the previous Friday.
Tuesday the levy broke & IWM opened on a gap down that ended as a spinning top, indicating a great deal of indecision on the part of market participants (but on low volume, as noted earlier).
The downtrend continued on Wednesday with another spinning top candle that tested the support of the 10 day moving average, but was able to stay above it for the session.
Thursday showed that there was more confusion in the small caps, as the day ended on a long legged doji, where price was relatively unchanged from open to close but the upper & lower shadows show a wide range of prices were tested throughout the session.
Friday continued the “week of uncertainty” for IWM, as the week concluded on a spinning top candle that while the open/closing price action was concentrated in the upper end of the candle, the lower shadow tested down to the 10 day moving average’s support, meaning that we will likely see more retests of this support in the coming week.
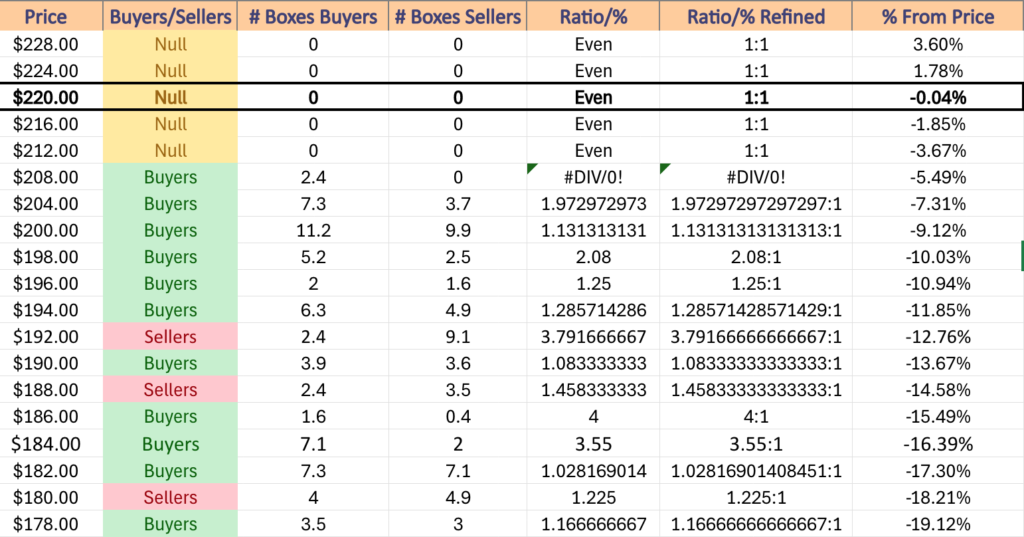
As frequently noted in the weekly posts, IWM tends to oscillate around a trading range then leg higher or lower much more than SPY or QQQ, so there is quite a bit of support for IWM at these price levels that are nearby.
However, it should be noted that the 200 day moving average has now moved into that support zone & is sitting right in the middle of it.
As the 200 DMA continues to climb, should IWM break down below it that would likely indicate that the support zone itself will break down & will be something to keep an eye on & to continue to reassess the strength of the price levels.
This is also highlighted in the table below where the $193.99/share price level begins a seller dominated zone where there have been 3.79 sellers:buyers in terms of volume sentiment, which would likely trigger a further sell off into the $189.99/share block where the Sellers:Buyers ratio has been 1.46:1 until the $187.99 price level.
Given IWM’s proximity to their 52-week high, expect to see some profit taking in the coming week & be mindful of how the larger cap indexes are moving, as with them all at all-time highs & IWM near a 52-week high that may be the recipe for folks exiting the pool altogether vs. rotating into small caps.
IWM has support at the $217.26 (10 Day Moving Average, Volume Sentiment: NULL, 0:0*), $215.38 (Volume Sentiment: NULL, 0:0*), $211.61 (50 Day Moving Average, Volume Sentiment: Buyers, 2.4:1) & $211.29/share (Volume Sentiment: Buyers, 2.4:0*) price levels, with resistance at the $222.45 (Volume Sentiment: NULL, 0:0*), $226.64 (Volume Sentiment: NULL, 0:0*) & $228.63/share (52-Week High, Volume Sentiment: NULL, 0:0*) price levels.
DIA, the SPDR Dow Jones Industrial Average ETF had the strongest week of the major four indexes, advancing +1.06% for the week as the blue chip names weathered the semiconductor storm fallout the best.
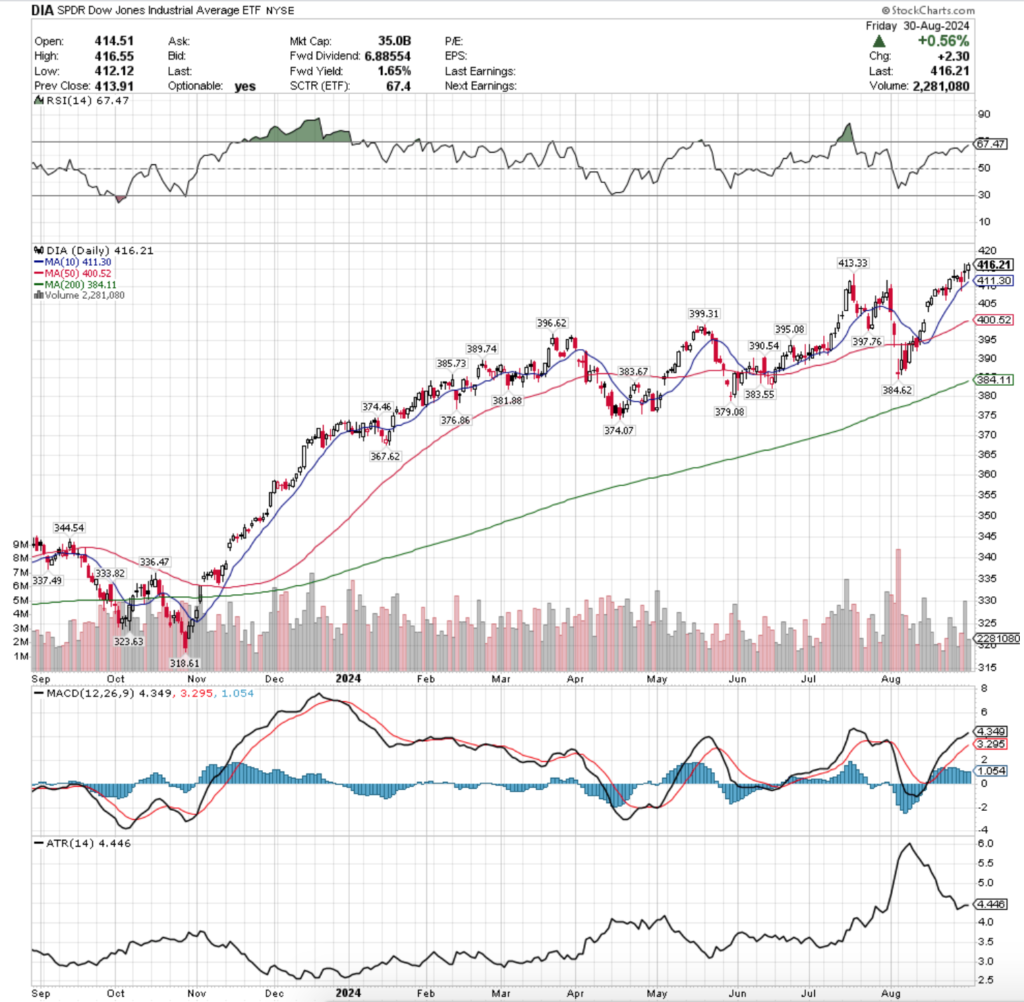
Their RSI is trending towards overbought conditions & sits at 67.47, while their MACD is still bullish, but beginning to look overextended & their histogram is weakening, indicating that there is likely a bearish crossover coming by Thursday of this week.
Volumes were -15.72% below the past year’s average volume (2,978,636 vs. 3,525,088), as DIA has managed to maintain the closest semblance of normal volumes of the major four index ETFs all year, while the others have waned.
DIA closed the week out at a new all-time high, but the path to get there was certainly filled with uncertainty.
Aside from Thursday which eclipsed the rest of the week’s volumes their trading volumes were unremarkable, and given the way Thursday’s candle closed out as a high wave spinning top that closed lower than it opened, it appears a lot of people were taking profits there & that the bull run up is in jeopardy.
The long lower shadow on Friday’s candle also gives off that sentiment, especially when paired with the second lowest volumes of the week.
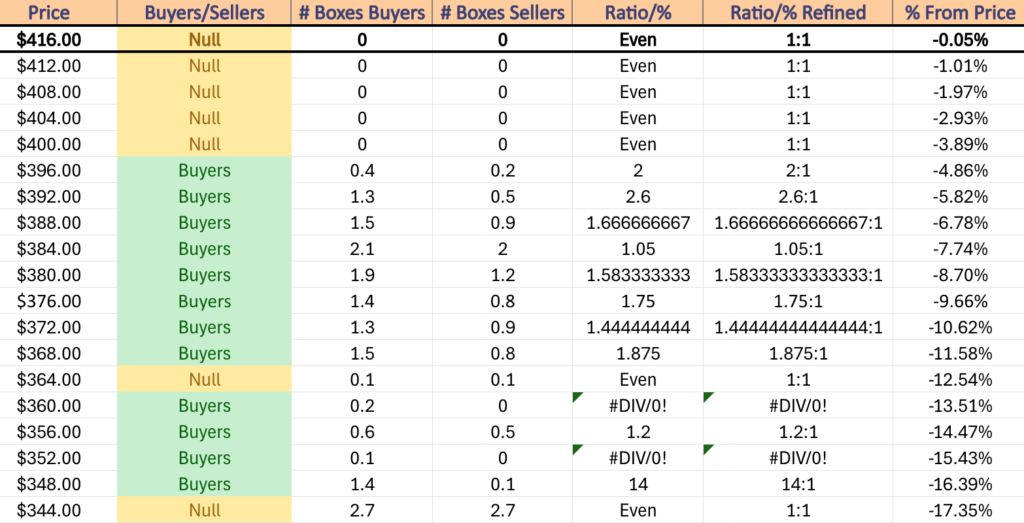
While there is a cluster of support levels not too far down from DIA’s current price, the same moving average relationships & strength of sentiment at different price levels will be what to watch in the coming week, along with what the current week’s volumes do.
DIA may have lost the least amount of average volume of the major four index ETF’s we’ve compared here, but given that it was so highly concentrated just on being from Thursday it is hard to say that this is a sign of strength.
If this continues into this week it should be a reason for investors to be looking at markets with a very skeptical eye & be viewed as a signal of a lack of confidence overall.
DIA has support at the $413.33 (Volume Sentiment: NULL, 0:0*), $411.30 (10 Day Moving Average, Volume Sentiment: NULL, 0:0*), $400.52 (50 Day Moving Average, Volume Sentiment: NULL, 0:0*) & $399.31/share (Volume Sentiment: Buyers, 2:1) price levels, with resistance at the $416.55/share (All-Time High, Volume Sentiment: NULL, 0:0*) price level.
The Week Ahead
There are no major economic data announcements or earnings reports on Monday as it is Labor Day in the U.S.
S&P Final U.S. Manufacturing PMI is announced Tuesday at 9:45 am, followed by Construction Spending & ISM Manufacturing data at 10 am.
Hello Group reports earnings Tuesday morning, with GitLab, PagerDuty & Zscaler reporting after the closing bell.
Wednesday begins with U.S. Trade Deficit data at 8:30 am, followed by Job Openings & Factory Orders data at 10 am & the Fed’s Beige Book at 2pm.
Dick’s Sporting Goods, Dollar Tree, America’s Car Mart, Ciena, Core & Main, Hormel Foods, REV Group & Torrid all report earnings before Wednesday’s opening bell, with AeroVironment, C3.ai, Casey’s General, ChargePoint, Copart, Couchbase, Credo Technology Group, Descartes, Hewlett Packard Enterprise, Phreesia, Sprinklr, Verint Systems & Yext all scheduled to report earnings after the closing bell.
ADP Employment, Initial Jobless Claims & U.S. Productivity (revision) data all come out Thursday at 8:30 am, with S&P final U.S. Services PMI data coming out at 9:45 am & ISM Services data at 10 am.
Thursday kicks off with earnings from Korn Ferry, Nio, Science Applications International, Shoe Carnival & The Toro Company, with Broadcom, Argan, Braze, DocuSign, Guidewire Software, Smartsheet, Smith & Wesson Brands, UiPath, Veradigm & Zumiez due to report after the session’s close.
U.S. Employment Report, U.S. Unemployment Rate, U.S. Hourly Wages & Hourly Wages Year-over-Year are all released Friday at 8:30 am, followed by New York Fed President Williams speaking at 8:45 am.
Friday morning’s earnings reports include ABM Industries, Brady, BRP Inc. & Genesco.
See you back here next week!
*** I DO NOT OWN SHARES OR OPTIONS CONTRACT POSITIONS IN SPY, QQQ, IWM OR DIA AT THE TIME OF PUBLISHING THIS ARTICLE ***