SPY, the SPDR S&P 500 ETF gained +4.01% last week, while the VIX closed at 16.56, indicating an implied one day move of +/-1.04% & an implied one month move of +/-4.79%.
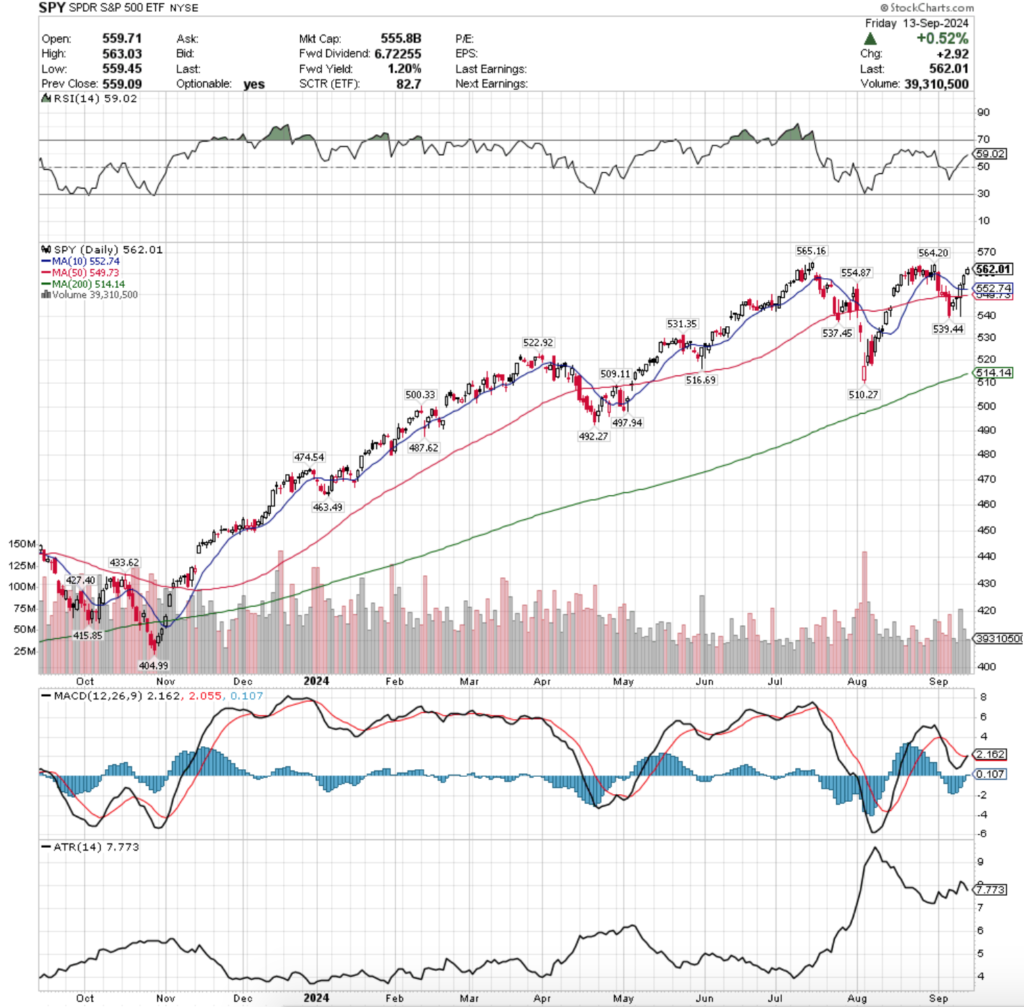
Their RSI is currently between neutral & overbought sitting at 59.02, while their MACD crossed over bullishly on Friday, but the histogram is not indicating that it was a particularly strong move.
Volumes were -28.58% below average last week compared to the previous year’s average (48,658,000 vs. 68,131,937), which is a warning signal given that all of the five sessions of the week were advancing.
Monday kicked SPY’s week off on an uncertain note, as the session opened midway between Friday’s candle’s real body & wound up closing as a spinning top on the week’s second lowest volume, forming a bullish harami with Friday’s candle.
It’s worth noting that the 50 day moving average’s resistance was not tested during this session.
Tuesday the trend continued, as the session opened on a gap higher, tested below the real body of Monday’s candle, before closing just beneath the resistance of the 50 DMA, creating a dragonfly doji on the week’s weakest volume.
The bulls won on Wednesday though, as SPY opened in line with the 50 DMA, tested lower, before ultimately rallying higher & closing above the 50 & 10 day moving averages, turning their resistance levels to support.
Wednesday had the strongest volume of the week by far, however it also covered the widest range of prices throughout the session by far as well for the week, including the need to push past the two resistance points created by the moving averages.
It is also worth noting that the low point on Wednesday’s session was near the $540/share price level, which is roughly in line with the previous Friday’s close, indicating that there was still enough bearish appetite left in the market to push prices back in that direction.
Thursday the rally continued & SPY edged higher, solidifying the 10 DMA’s support on its test on the daily low, but again, the volumes were still very light (despite being the second highest of the week).
Friday was the most interesting day of the week, where the middle of the pack volume accompanied a gap up spinning top, indicating a big lack of confidence at the current price level.
This is further confirmed by the inability of the day’s high to break above the $564.20/share resistance level, which is the next closest one to the all-time high of $565.16.
This sets the market up for an interesting new week for SPY, as another key area to note is that the bottom is even more narrow on the “Adam scallop” recovery from the early September declines, indicating a lack of confidence in the leg higher.
Broadening patterns tend to perform better than those that are more narrow, as more price levels are tested, new support & resistance levels are created & there is more validity behind each price level tested.
Additionally, Friday’s gap up may set the stage for an evening star reversal (bearish) in the event of weakness on Monday’s session.
This week volume will continue to be a major theme, along with what Monday’s session sets up the rest of the week for, as there will be a handful of earnings reports & the FOMC Interest Rate cut decision due Wednesday.
There is 0.56% upside from Friday’s closing price & SPY’s all-time high that was set in July 2024, meaning that for the most part any further bullishness would reset SPY’s all time high.
Given that the high in August of $564.20 was unable to reach the ATH & there has been limited good news since then it is hard to see SPY taking off much higher here.
However, investors should keep their eye open in the event of a move higher to be sure that it is not a false breakout that throws back into the current price range/begins a decline.
It will also be important that in the event of any downside movement that market participants watch the support zone between $549.73-$554.87, as in the event that it breaks down there is another 2% of space for their price to decline before another support level is found.
Keep an eye on SPY’s RSI this week as well, as it is approaching its highest levels of the past month, which may indicate that there is some selling on the horizon.
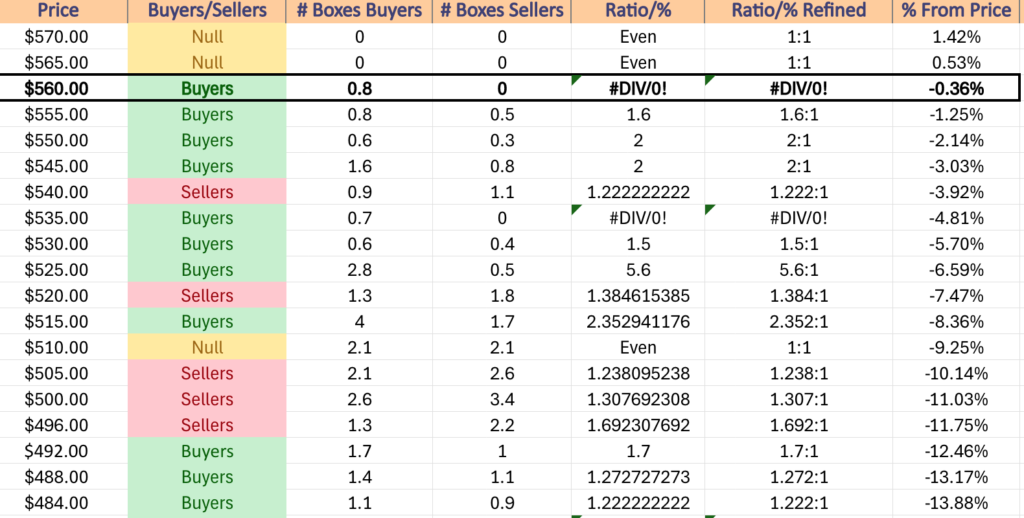
SPY has support at the $554.87 (Volume Sentiment: Buyers, 2:1), $552.74 (10 Day Moving Average, Volume Sentiment: Buyers, 2:1), $549.73 (50 Day Moving Average, Volume Sentiment: Buyers, 2:1) & $539.44/share (Volume Sentiment: Buyers, 0.7:0*) price levels, with resistance at the $564.20 (Volume Sentiment: Buyers, 0.8:0*) & $565.16/share (All-Time High, Volume Sentiment: NULL, 0:0*) price levels.
QQQ, the Invesco QQQ Trust ETF that tracks the NASDAQ 100 advanced +5.94% last week, as market participants flocked into the tech heavy index over the other major four index ETFs.
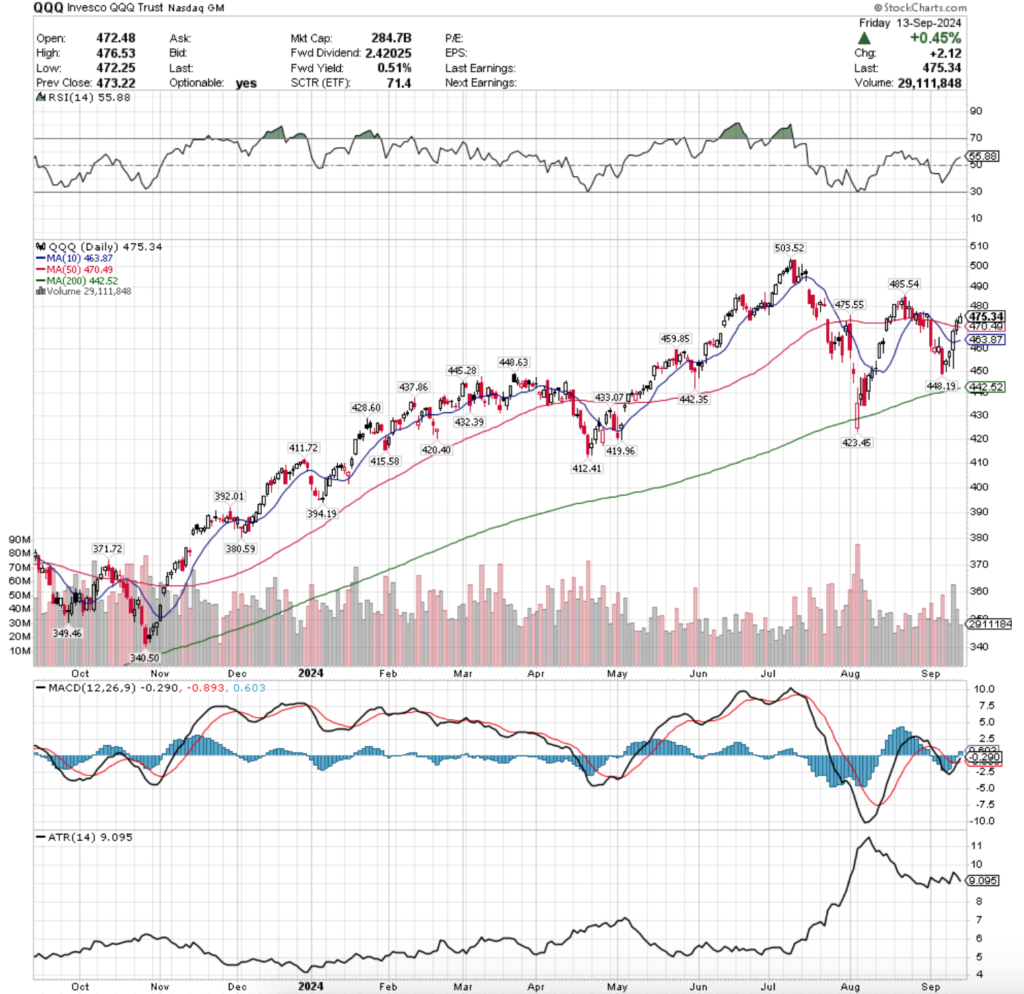
Their RSI is currently at 55.88, just above the neutral mark of 50 while their MACD crossed over bullishly on Friday.
Volumes were -11.96% below the previous year’s average volume (37,958,000 vs. 43,116,245), which while it is a better “participation rate” than SPY’s is still rather low, particularly when you factor in how much the annual average volume level has declined since only six months ago (comparison for all index ETFs in 8/18/2024’s Market Review Note here).
QQQ’s week was quite a bit like SPY’s, as has been the case for the past year when the AI & Semiconductor component names have driven these indexes higher than IWM or DIA.
Monday opened up with a spinning top candle midway through Friday’s candle’s real body on weak volume, with a lower shadow that indicated a lot more bearish sentiment that bulls ultimately overcame before the close & the day’s candle formed a bullish harami with the previous Friday’s.
Tuesday showed a gap up open for QQQ, a test to the downside towards Monday’s opening price, but ultimately a rally higher that closed for an advancing session.
QQQ gapped up again on Wednesday, however it also tested lower than Tuesday & lower than Monday’s opening price level during the session, despite breaking out above the 10 day moving average’s support & closing between it & the 50 DMA’s resistance.
Wednesday also had the highest volume of the week for QQQ, which is to be expected given that the day’s range covered the majority of the entire week’s advance as one session.
Thursday the gains continued, the volume was the second highest of the week & despite testing lower briefly, QQQ was able to break out about the 50 Day Moving Average’s resistance.
Friday showed the weakest volume of the week for QQQ, as well as the potential warning sign for the near-term, despite advancing +0.45%.
While the upper shadow was not long enough to categorize Friday’s session as a shooting star, there are certainly bearish implications with how the week ended, particularly as like SPY the recovery from the losses of early September were unable to break above any of the top three resistance levels & the bases of them are all contracting.
While volumes were certainly closer to levels that they’re historically at last week, they still aren’t particularly strong, especially when viewed through the lens of how diluted the average annual volume has become in the wake of the past few months.
It would also be wise to keep an eye on QQQ’s RSI this week, as it is approaching levels it has reversed at in the previous month.
While this doesn’t mean QQQ will necessarily reverse at the same levels again, there has been little good news coming out since these levels were last hit, making it more likely that they’ll reverse there again.
The relationship between each day’s price action & the support levels of the 50 & 10 DMAs will also be important to keep an eye on, as within the past week both of these moving averages have seen a lot of tests as both support & resistance levels, and while prices climbed all week, there was still a lot of interest to the downside based on the daily candles’ lower shadows.
In the event that the $475.55 resistance level is broken through, all eyes will be on the $485.54 resistance level, which if unable to be broken through will indicate that there is likely an impending decline.
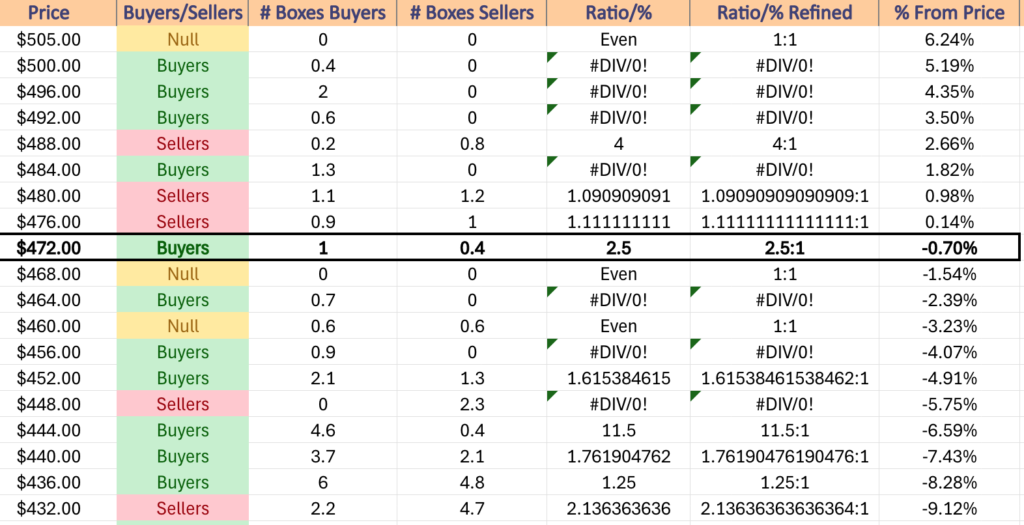
QQQ has support at the $470.49 (50 Day Moving Average, Volume Sentiment: NULL, 0:0*), $463.87 (10 Day Moving Average, Volume Sentiment: Even, 1:1), $459.85 (Volume Sentiment: Buyers, 0.9:0*) & $448.63/share (Volume Sentiment: Sellers, 2.3:0*) price levels, with resistance at the $475.55 (Volume Sentiment: Buyers, 2.5:1), $485.54 (Volume Sentiment: Buyers, 1.3:0*) & $503.52/share (All-Time High, Volume Sentiment: Buyers, 0.4:0*) price levels.
IWM, the iShares Russell 2000 ETF climbed +4.03% last week, making the small cap index the second most favored of the major four index ETFs.
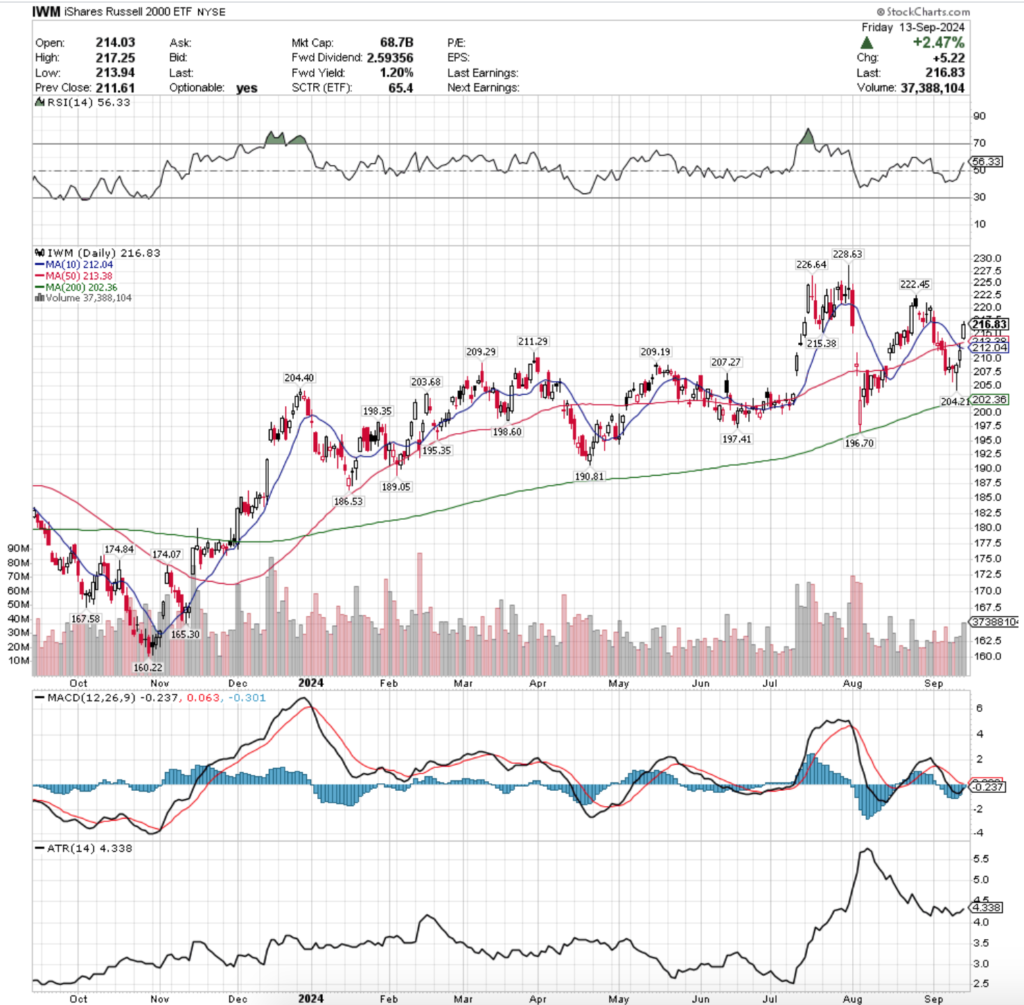
Their RSI is just above the neutral 50 mark & sits at 56.33, while their MACD is still bearish, but approaching the signal line rapidly & may cross bullishly in the coming day or two.
Volumes were -21.26% below average last week compared to the previous year’s average volume (27,768,000 vs. 35,267,233), as investors were still relatively on the fence about diving back into the small cap pool.
IWM also began their week on an uncertain note, as the session opened slightly above Friday’s close & tested lower, before ultimately tested back above the $210/share mark & settling into a tight-range spinning top candle just above the day’s open (but not close enough to be a doji) that formed a bullish harami with the prior Friday’s candle on some of the weakest volume of the low volume week.
Tuesday confirmed the uncertainty in the air, as the session opened slightly higher, tested a small amount higher, before puking lower to below the $206/share range & ultimately closing in a candle whose real body looked like a slightly stretched out dragonfly doji; indicating the uncertainty was there but there was also a possible squeeze moving into the latter half of the week.
Wednesday saw an uptick in volume, as well as a test much lower after the session’s open, but managed to rally into the sloe & end the day slightly higher.
Thursday opened on a gap up that tested back against the downside & Wednesday’s closing price before rallying higher, breaking the 10 day moving average’s resistance briefly before getting denied by the 50 DMA’s resistance & tumbling back to close as an advancing session but below both the 10 & 50 DMAs.
Friday made for an interesting close to the week, as IWM gapped up above both the 10 & 50 DMA’s on the open, briefly tested a bit lower but did not approach other support level before ultimately rallying into the close for a +2.47% advance.
While the session came on the strongest volume of the week, much like QQQ it closed unable to reach the top three resistance levels from the past 52-weeks.
These levels are all ~2.6%+ from Friday’s closing level, but when paired with the contracting bottoms forming in each of the past few declines’ recoveries there is cause for concern.
Volume will continue to be a main theme for IWM this week just like the past few weeks.
Much like SPY & QQQ, IWM’s RSI will also be a place to be mindful of as it too is approaching the levels it last reversed at in August.
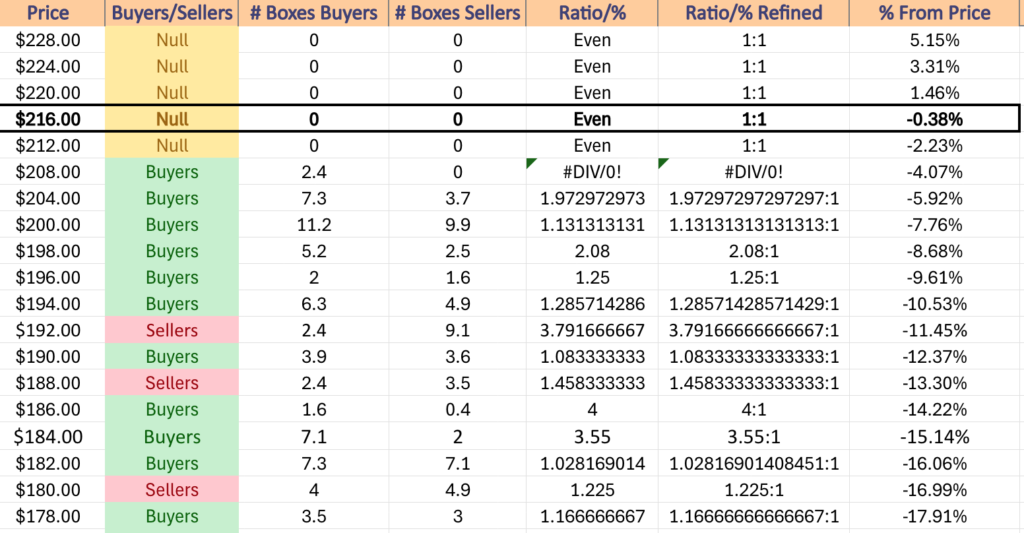
The support of the 50 & 10 DMA’s will also be an area of focus, as if they break down IWM will enter an area where there is a support level roughly every 1% further down, with zones in the $202.36 (200 Day Moving Average)-$204.21 & $195.35-198.60.
Should prices enter these zones the chart below will be helpful for establishing how strong each support point may be when tested.
Note that the 200 DMA is i the weakest price range in terms of Buyer:Seller strength in the event that it is tested in the coming week(s).
IWM has support at the $215.38 (Volume Sentiment: NULL, 0:0*), $213.38 (Volume Sentiment: NULL, 0:0*), $212.04 (Volume Sentiment: NULL, 0:0*) & $211.29/share (Volume Sentiment: Buyers, 2.4:0*) price levels, with resistance at the $222.45 (Volume Sentiment: NULL, 0:0*), $226.64 (Volume Sentiment: NULL, 0:0*) & $228.63/share (52-Week High, Volume Sentiment: NULL, 0:0*) price levels.
DIA, the SPDR Dow Jones Industrial Average ETF had the worst week of the bunch, only notching +2.59% for the weekly gain.
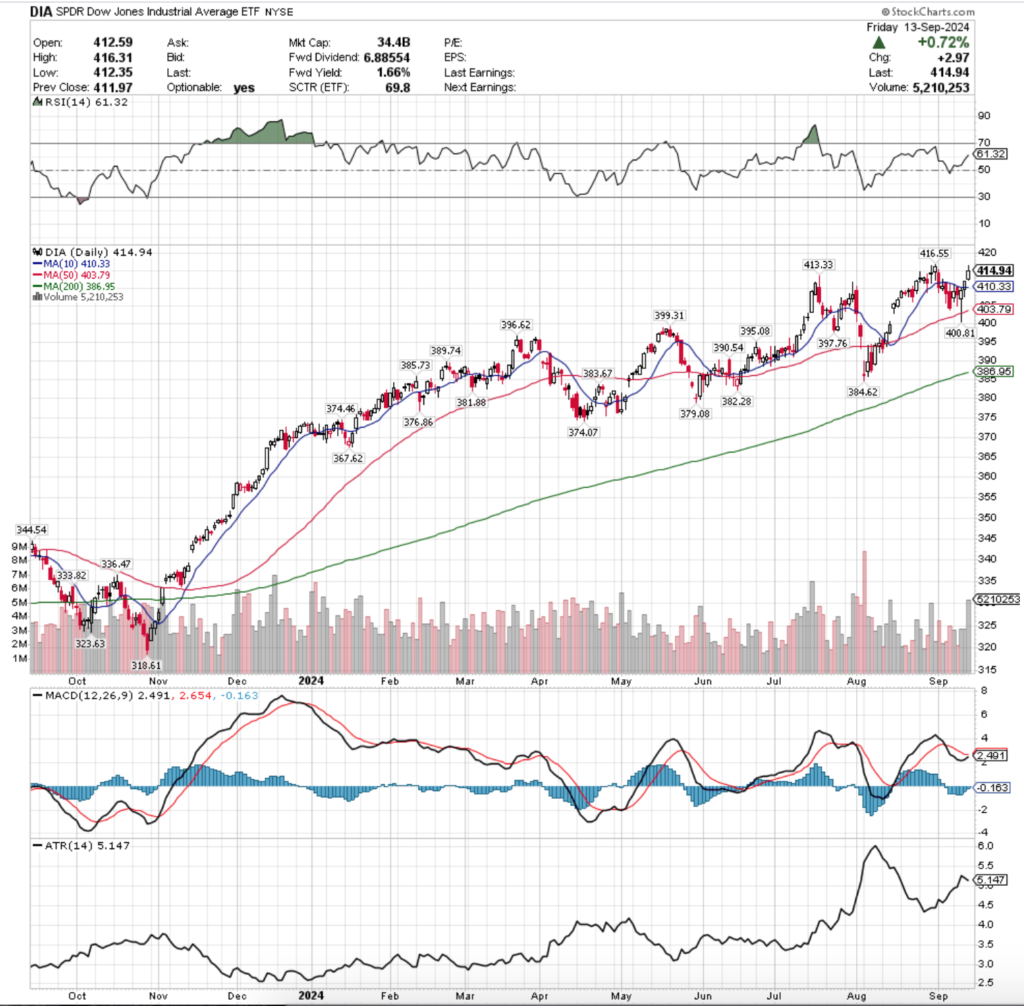
Their RSI is midway between the neutral point of 50 & the overbought level of 70, sitting at 61.32, while their MACD is poised to cross the signal line bullishly on Monday.
Volumes were -7.51% below the previous year’s average (3,296,000 vs. 3,563,715), as investors have remained relatively resilient in terms of participation in trading the blue chip index.
DIA’s week started off with a bullish harami formed by Monday & the previous Friday’s candle last week, but there were signs of weakness as the 10 day moving average’s resistance was unable to be broken through.
Tuesday this trend continued, as the session opened optimistically at the 10 DMA’s resistance level, but was unable to break out above it & wound up declining throughout the day, so low as to even test the ~$405/share level & the session ultimately resulted in decline.
The cautious sentiment carried on into Wednesday, where prices opened lower, tested all the way down to break beneath the support of the 50 day moving average temporarily, before recovering to go on to test & get rejected by the 10 DMA’s resistance & ultimately close for an advancing session.
Thursday saw DIA open just below the resistance of the 10 DMA, test lower almost all the way down to Wednesday’s opening price level, before DIA rallied higher, broke through the 10 DMA & closed above it turning it into a support level.
Friday is where things got interesting, as the day opened on a gap up, did not test much lower than the open & trudged higher on the highest volume of the week.
However, the size of Friday’s candle’s upper shadow is cause for concern, as it signals that the bears came out in droves & took profits sending the closing price lower than the day’s high.
Like the previously mentioned names, volume will be a heavy part of the story this week for DIA in terms of dictating where market participant sentiment lies.
Their RSI is also approaching the level it reversed at last month like the other three ETFs mentioned above, and while DIA’s may venture slightly higher as the index is filled with blue chip names, that would begin encroaching on overbought territory, which would trigger some form of consolidation/correction in price.
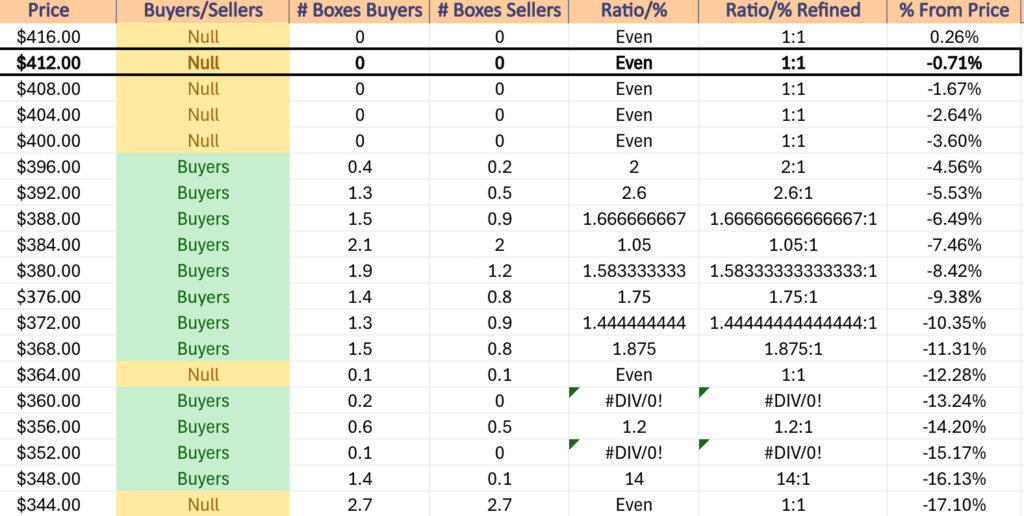
In the event that is triggered & prices decline there is a strong zone of support in the $399-400 & $395.08-397.76 price ranges that have multiple touch-points each within them & it will be interesting to see how they hold up, given that they have had limited testing against downside movements.
The table below can help assess how strong each support level may be based on historic Buyer:Seller activity.
DIA has support at the $413.33 (Volume Sentiment: NULL, 0:0*), $410.33 (10 Day Moving Average, Volume Sentiment: NULL, 0:0*), $403.79 (50 Day Moving Average, Volume Sentiment: NULL, 0:0*) & $400.81/share (Volume Sentiment: NULL, 0:0*) price levels, with resistance at the $416.55/share (All-Time High, Volume Sentiment: NULL, 0:0*) price levels.
The Week Ahead
Monday starts the week off with the Empire State Manufacturing Survey data at 8:30 am & there are no major earnings reports.
U.S. Retail Sales & Retail Sales minus Autos are due out Tuesday at 8:30 am, followed by Industrial Production & Capacity Utilization data at 9:15, before Business Inventories & Home Building Confidence Index data is released at 10 am.
Ferguson reports earnings before Tuesday’s opening bell.
Wednesday begins with Housing Starts & Building Permits data at 8:30 am before the eagerly anticipated FOMC Interest Rate Decision at 2pm & Fed Chair Powell’s Press Conference at 2:30 pm.
General Mills reports earnings before Wednesday’s opening bell, with Steelcase scheduled to report following the session’s close.
Initial Jobless Claims & the Philadelphia Fed Manufacturing Survey data come out Thursday at 8:30 am, followed by Existing Home Sales & U.S. Leading Economic Indicators at 10 am.
Thursday brings Cracker Barrel, Darden Restaurants, Endava & FactSet’s earnings call’s before the session opens, with FedEx, Lennar, & MillerKnoll all scheduled to report after the close.
There are no major economic announcements or earnings reports due out on next Friday.
See you back here next week!
*** I DO NOT OWN SHARES OR OPTIONS CONTRACT POSITIONS IN SPY, QQQ, IWM OR DIA AT THE TIME OF PUBLISHING THIS ARTICLE ***