YINN, the Direxion Daily FTSE China Bull 3x Shares ETF has gained +10.57% over the past year, advancing +145.15% from their 52-week low in January of 2024 & sits just -2.49% below their 52-week high (all figures ex-distributions).
Yesterday YINN had a strong performance, gapping up & closing +29.13% after the PBOC announced new stimulus measures.
YINN tracks the FTSE China 50 Index, which are fifty of the largest companies that trade on the Hong Kong Stock Exchange.
Some of these names include Tencent Holdings Shares, Alibaba Group, Meituan, China Construction Bank Class H, Industrial Commerce Bank China Class H, Bank of China H, Netease Inc., JD.com, Xiaomi Corporations & BYD.
Investors who are bullish on Chinese companies can use YINN to get portfolio exposure to their names & for those who are bearish on Chinese companies there is also a YANG ETF, as well as put options against YINN.
Below is a brief technical analysis of YINN’s past week & a half, as well as a price level:volume sentiment analysis of the price levels YINN has traded at over the past 1-2 years.
Included in this data is also their recent support & resistance levels so that readers can gain insight into how strong/weak these support/resistance levels may be in the future, based on past investor behavior.
It is not intended to serve as financial advice, but rather as an additional tool to reference while performing your own due diligence on YINN.
Technical Analysis Of YINN, The Direxion Daily FTSE China Bull 3x Shares ETF
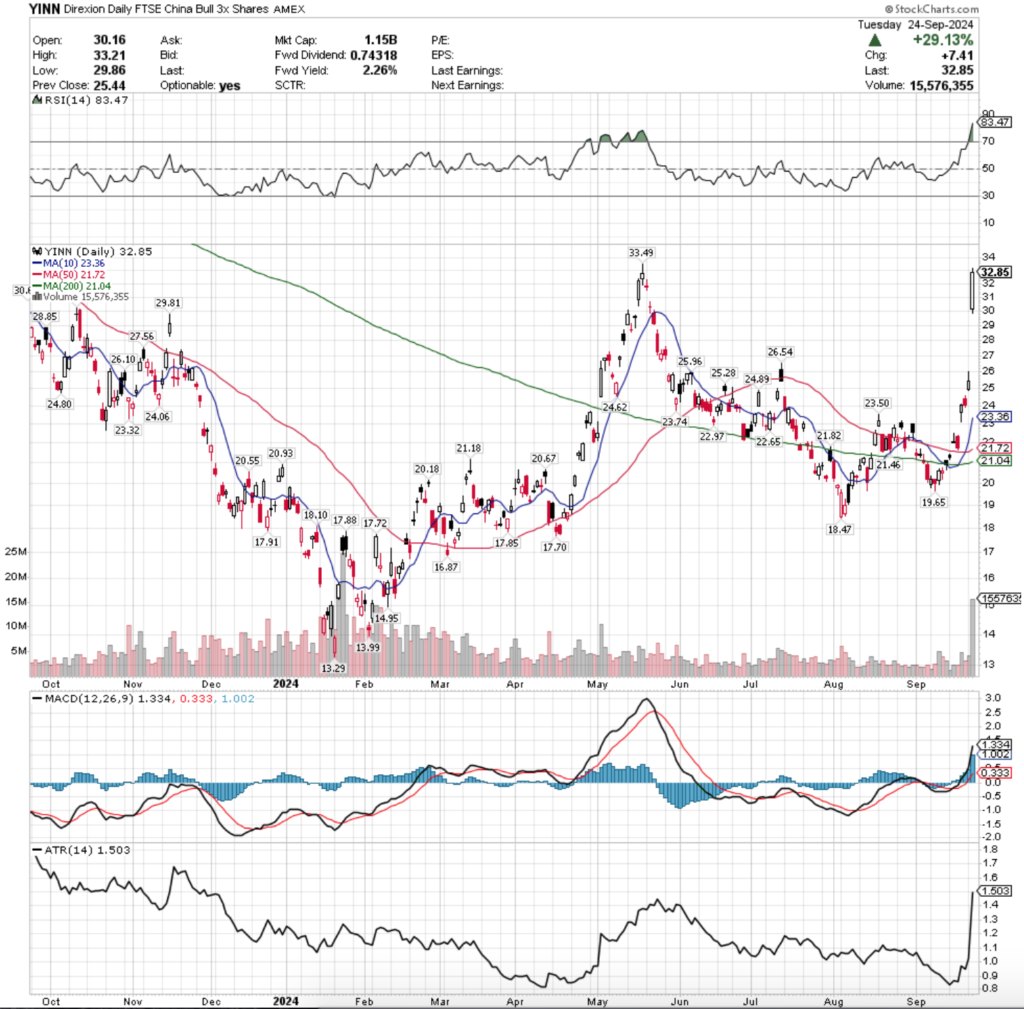
Their RSI is currently overbought following yesterday’s +29.13% gap up session, while their MACD is bullish.
Volumes were +17.09% above the past year’s average over the past week (5,966,000 vs. 5,090,158.73), mostly driven by the high volumes of yesterday’s session, as the session’s of the days before it all have relatively muted volume.
Last Monday saw YINN gap up to above the support of their 10 & 200 day moving averages, while remaining below the 50 DMA’s resistance.
The gap ups continued on Tuesday, as YINN jumped again to pass beyond the 50 day moving average’s resistance.
Tuesday’s session did come with a hint of bearishness though, as the day’s candle resulted in a gravestone doji, which led into Wednesday’s profit taking decline.
While Wednesday formed a bearish engulfing pattern with Tuesday’s candle, it was supported by the 50 day moving average.
YINN began moving rather erratically after Wednesday, as Thursday resulted in a gap up to just below the $24/share level, tested lower to almost reach $23/share but ultimately rallied higher to close above $24/share.
The week closed out with market participants taking profits, but not until after Friday morning opened with a gap up, only to settle one penny lower than Thursday’s close at $24.03/share heading into the weekend.
While Friday’s volume was higher than Wednesday’s, both were still quite below average compared to the previous year.
This week opened on another gap up (quite the theme here), while prices ran up to the $26/share mark intraday, only to settle at $25.44/share for the day on lackluster volumes again.
Following the news out of the PBOC regarding stimulus yesterday’s session saw a massive +29.13% gap up, the sixth gap up of the past seven opens.
This jumpy behavior should be viewed with a skeptical brow raised, particularly given how low recent volumes have been with the exception of yesterday’s.
Yesterday’s session has created a large window in YINN’s price, which will be an area to keep an eye on in the coming weeks as it is likely to be filled.
While that occurs, it is important to have an understanding of how investors have behaved at YINN’s previously traded at price levels in order to understand how they may behave at these levels again.
This will help navigate how market participants may behave again at the same levels in the event of support level re-tests.
Price Level:Volume Sentiment Analysis Of YINN, The Direxion Daily FTSE China Bull 3x Shares ETF
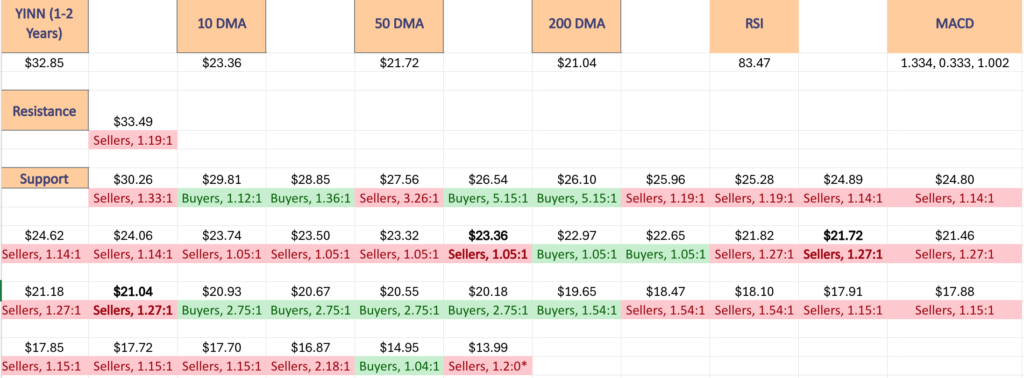
The top table below shows the support & resistance levels of YINN from the past year’s chart, as well as their price level:volume sentiment at each, using Tuesday 9/24/24’s closing price.
The moving averages are denoted with bold.
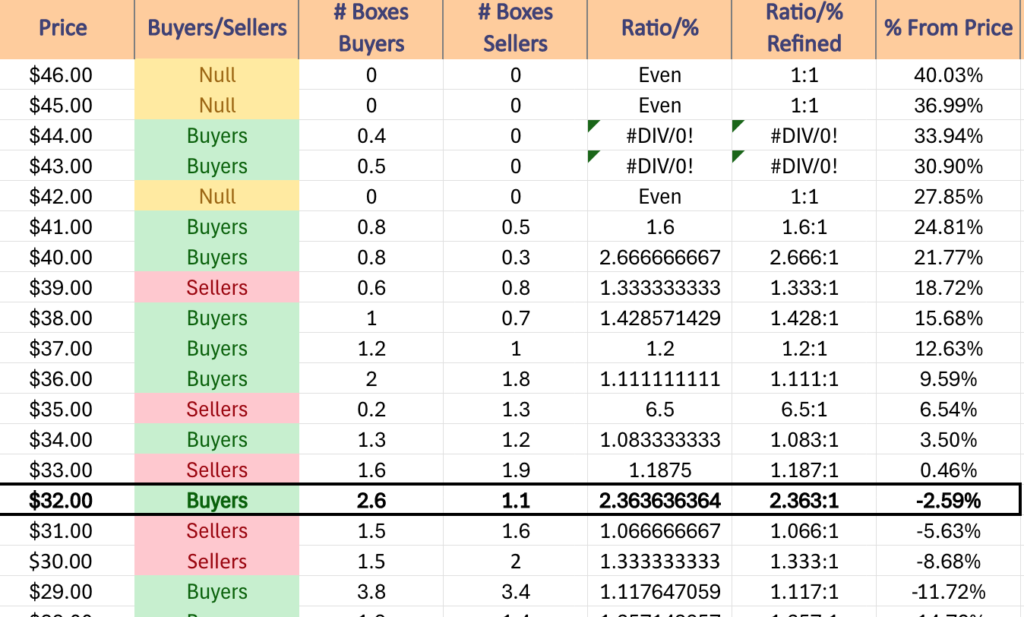
The next charts show the volume sentiment at each individual price level YINN has traded at over the past 1-2 years.
Beneath them is a copy & pasteable list of the same data, where the support/resistance levels are denoted in bold.
All ratios with “0” in the denominator are denoted with a “*”.
NULL values are price levels that had limited trading volume, whether it be due to gaps, quick advances or they are at price extremes; in the event that they are retested & there is more data they would have a distinct “Buyers”, “Sellers” or “Even” title.
This is not intended as financial advice, but rather another tool to consider when performing your own research & due diligence on YINN ETF.
$46 – NULL – 0:0*, +40.03% From Current Price Level
$45 – NULL – 0:0*, +36.99% From Current Price Level
$44 – Buyers – 0.4:0*, +33.94% From Current Price Level
$43 – Buyers – 0.5:0*, +30.9% From Current Price Level
$42 – NULL – 0:0*, +27.85% From Current Price Level
$41 – Buyers – 1.6:1, +24.81% From Current Price Level
$40 – Buyers – 2.67:1, +21.77% From Current Price Level
$39 – Sellers – 1.33:1, +18.72% From Current Price Level
$38 – Buyers – 1.43:1, +15.68% From Current Price Level
$37 – Buyers – 1.2:1, +12.63% From Current Price Level
$36 – Buyers – 1.11:1, +9.59% From Current Price Level
$35 – Sellers – 6.5:1, +6.54% From Current Price Level
$34 – Buyers – 1.08:1, +3.5% From Current Price Level
$33 – Sellers – 1.19:1, +0.46% From Current Price Level
$32 – Buyers – 2.36:1, -2.59% From Current Price Level – Current Price Level*
$31 – Sellers – 1.07:1, -5.63% From Current Price Level
$30 – Sellers – 1.33:1, -8.68% From Current Price Level
$29 – Buyers – 1.12:1, -11.72% From Current Price Level
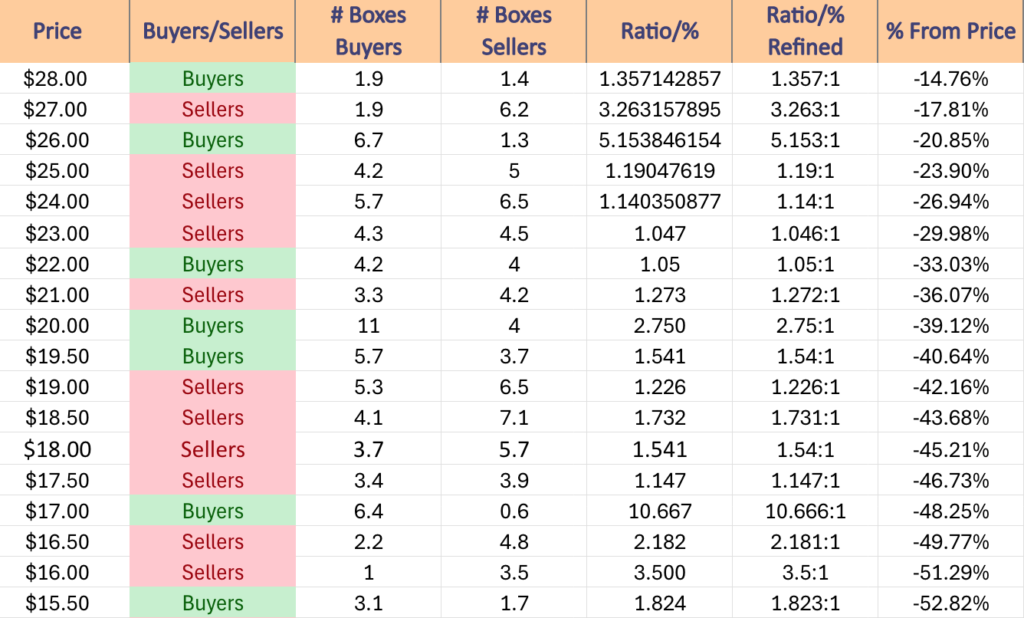
$28 – Buyers – 1.36:1, -14.76% From Current Price Level
$27 – Sellers – 3.26:1, -17.81% From Current Price Level
$26 – Buyers – 5.13:1, -20.85% From Current Price Level
$25 – Sellers – 1.19:1, -23.9% From Current Price Level
$24 – Sellers – 1.14:1, -26.94% From Current Price Level
$23 – Sellers – 1.05:1, -29.98% From Current Price Level – 10 Day Moving Average*
$22 – Buyers – 1.05:1, -33.03% From Current Price Level
$21 – Sellers – 1.27:1, -36.07% From Current Price Level – 50 & 200 Day Moving Averages**
$20 – Buyers – 2.75:1, -39.12% From Current Price Level
$19.50 – Buyers – 1.54:1, -40.64% From Current Price Level
$19 – Sellers – 1.23:1, -42.16% From Current Price Level
$18.50 – Sellers – 1.73:1, -43.68% From Current Price Level
$18 – Sellers – 1.54:1, -45.21% From Current Price Level
$17.50 – Sellers – 1.15:1, -46.73% From Current Price Level
$17 – Buyers – 10.67:1, -48.25% From Current Price Level
$16.50 – Sellers – 2.18:1, -49.77% From Current Price Level
$16 – Sellers – 3.5:1, -51.29% From Current Price Level
$15.50 -Buyers – 1.82:1, -52.82% From Current Price Level
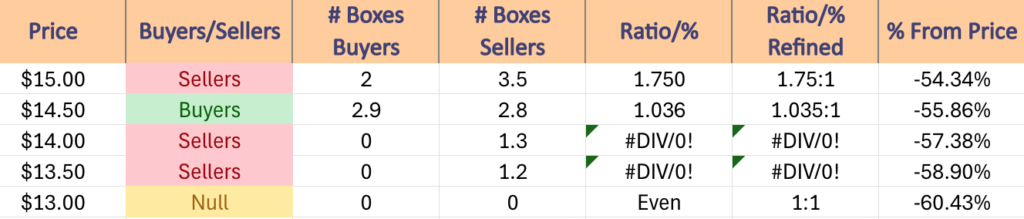
$15 – Sellers – 1.75:1, -54.34% From Current Price Level
$14.50 – Buyers – 1.04:1, -55.86% From Current Price Level
$14 – Sellers – 1.3:0*, -57.38% From Current Price Level
$13.50 – Sellers – 1.2:0*, -58.9% From Current Price Level
$13 – NULL – 0:0*, -60.43% From Current Price Level
*** I DO NOT OWN SHARES OR OPTIONS CONTRACT POSITIONS IN YINN ETF AT THE TIME OF PUBLISHING THIS ARTICLE ***