UTSL, the Direxion Daily Utilities Bull 3x Shares ETF has advanced +168.81% over the past year, gaining +190.72% since their 52-week low in October of 2023 & currently sits just -0.32% below their 52-week high which was set today (all figures ex-distributions).
Much of this impressive performance has been driven by A.I. & Data Centers energy requirements as the field is projected to expand dramatically & also in part by recent market volatility & investors seeking safer returns from utilities names with stable performance & solid dividend yields.
Some of UTSL’s top holdings include Nextera Energy (NEE), Southern (S), Duke Energy (DUK), Constellation Energy Corp. (CEG), Sempra Energy (SRE), American Electric Power (AEP), Dominion Energy (D), PG&E (PCG), Public Service Ent (PEG), Exelon Corporation (EXC).
Below is a brief technical analysis of UTSL’s past week & a half, as well as a price level:volume sentiment analysis of the price levels UTSL has traded at over the past ~2 years.
Included in this data is also their recent support & resistance levels so that readers can gain insight into how strong/weak these support/resistance levels may be in the future, based on past investor behavior.
It is not intended to serve as financial advice, but rather as an additional tool to reference while performing your own due diligence on UTSL.
Technical Analysis Of UTSL, The Direxion Daily Utilities Bull 3x Shares ETF
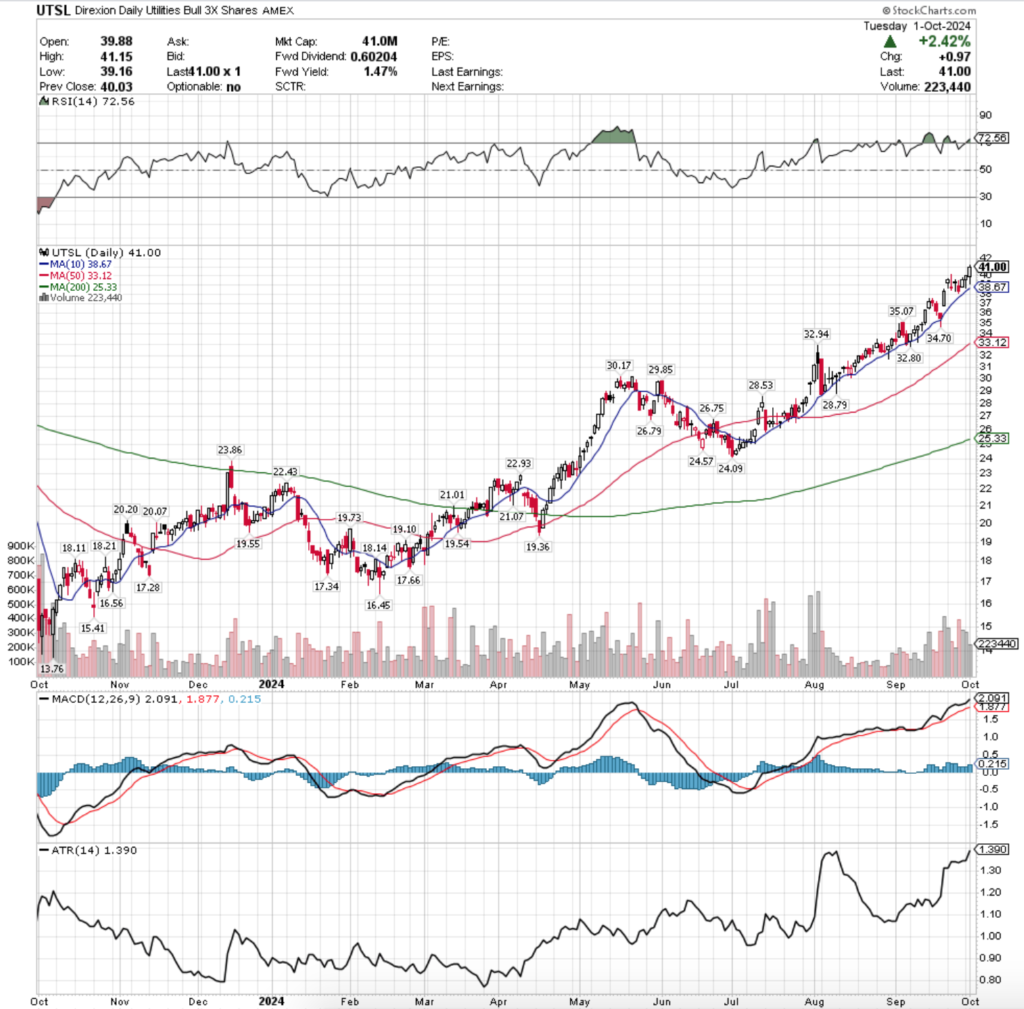
Their RSI is trending deeper into overbought territory & currently sits at 72.56, while their MACD is still trending bullishly after today’s session set a new 52-week high for UTSL.
Volumes were +46.25% above the prior year’s average volume over the past week & a half (292,697.14 vs. 200,138.1), as investors have been pouring into UTSL after the gap up from two Friday’s ago, and some profit taking along the way up.
Starting with two Friday’s ago, following three straight days of declines that saw the 10 day moving average’s support be temporarily broken through, investors piled into UTSL forcing a gap up session on the highest volume seen since the beginning of August.
This sentiment carried into last week when Monday too opened on a gap higher with strong volume, although there was some profit taking as shown by the lower shadow of the session’s candle & some reasons for caution early in the week.
Tuesday confirmed this uncertain sentiment as the session opened on a gap lower, traded higher above Monday’s range, but ultimately all roads led to a daily decline.
Much of this is likely to be due to profit taking after such a dramatic climb in two days, but the spinning top candle indicated that there was still uncertainty among market participants.
Wednesday opened on another gap higher, but wound up testing lower than Tuesday’s session’s lows, only to close higher as a dragonfly doji, indicating that there was still appetite for UTSL to go higher despite all of the uncertainty surrounding it.
There was additional bearish sentiment to Wednesday’s candle in that it closed below where it opened, but the low volume added additional uncertainty to the session.
But first, there was more downside testing & profit taking as Thursday opened on a gap down, made a run up to try to break above Wednesday’s open, only to take the elevator back down & close the day as a declining session.
Thursday’s volume should be noted though, as it was near that of the prior Friday & eclipsed all other sessions going back into the beginning of August & set the stage for a reversal as all of the profit taking was done & sentiment was ready to test higher.
Friday this happened where a high volume session was able to push UTSL higher heading into the weekend, and slight higher appetite was indicated based on the small upper shadow of the day’s candle.
The vote of confidence continued on Monday where similar volumes helped propel UTSL higher, but despite the session closing as an advancing session there was a bit of downside testing & bulls were clearly not in control.
This brought UTSL the closest it’s been to the 10 DMA’s support since Thursday 9/19/2024, but the day continued higher.
The day’s candle resulted in a hanging man, which has bearish implications & may be signaling that there will be more profit taking on the horizon after the run up of the past few days, which is also confirmed by their RSI.
Yesterday this sentiment also continued, as despite having a larger real body than Monday’s (a hanging man candle needs a spinning top for the real body, which is a tighter range) & ending in a +2.42% advance, bears were able to force prices temporarily down closer to the 10 DMA’s support.
In the event of a test lower, UTSL does not have many local support levels, as the closest one is currently the 10 day moving average, which despite moving higher daily is still -5.68% below yesterday’s closing price.
In the event that profit taking leads to a breakdown in price for UTSL, the charts below will shed insight into how investors have viewed UTSL at each price level contained in them over the years.
Price Level:Volume Sentiment Analysis For UTSL, The Direxion Daily Utilities Bull 3x Shares ETF
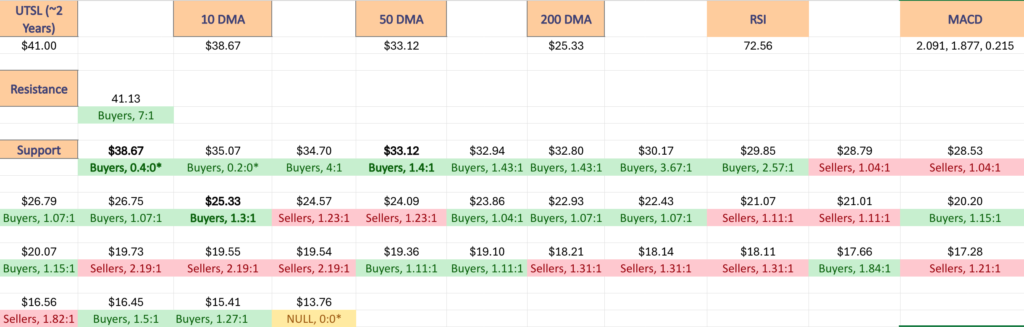
The top table below shows the support & resistance levels of UTSL from the past year’s chart, as well as their price level:volume sentiment at each, using Tuesday 10/1/24’s closing price.
The moving averages are denoted with bold.
The next charts show the volume sentiment at each individual price level UTSL has traded at over the past ~2 years.
Beneath them is a copy & pasteable list of the same data, where the support/resistance levels are denoted in bold.
All ratios with “0” in the denominator are denoted with a “*”.
NULL values are price levels that had limited trading volume, whether it be due to gaps, quick advances or they are at price extremes; in the event that they are retested & there is more data they would have a distinct “Buyers”, “Sellers” or “Even” title.
This is not intended as financial advice, but rather another tool to consider when performing your own research & due diligence on UTSL ETF.
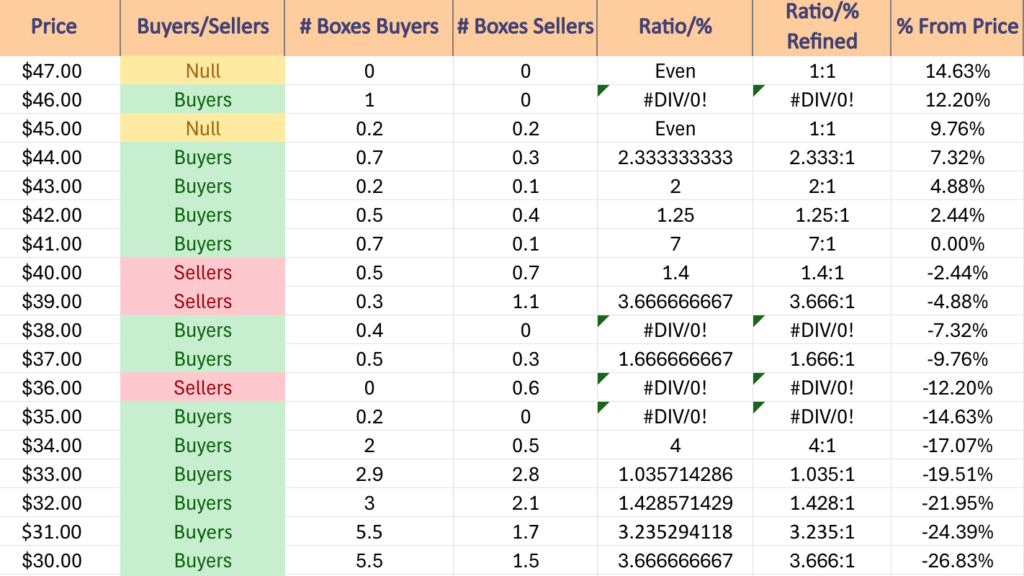
$47 – NULL – 0:0*, +14.63% From Current Price Level
$46 – Buyers – 1:0*, +12.2% From Current Price Level
$45 – Even, 1:1, +9.76% From Current Price Level
$44 – Buyers – 2.33:1, +7.32% From Current Price Level
$43 – Buyers – 2:1, +4.88% From Current Price Level
$42 – Buyers – 1.25:1, +2.44% From Current Price Level
$41 – Buyers – 7:1, 0.00% From Current Price Level – Current Price Level & 52-Week High**
$40 – Sellers – 1.4:1, -2.44% From Current Price Level
$39 – Sellers – 3.67:1, -4.88% From Current Price Level
$38 – Buyers – 0.4:0*, -7.32% From Current Price Level – 10 Day Moving Average*
$37 – Buyers – 1.67:1, -9.76% From Current Price Level
$36 – Sellers – 0.6:0*,-12.2% From Current Price Level
$35 – Buyers – 0.2:0*, -14.63% From Current Price Level
$34 – Buyers – 4:1, -17.07% From Current Price Level
$33 – Buyers – 1.04:1, -19.51% From Current Price Level – 50 Day Moving Average*
$32 – Buyers – 1.43:1, -21.95% From Current Price Level
$31 – Buyers – 3.24:1, -24.39% From Current Price Level
$30 – Buyers – 3.67:1, -26.83% From Current Price Level
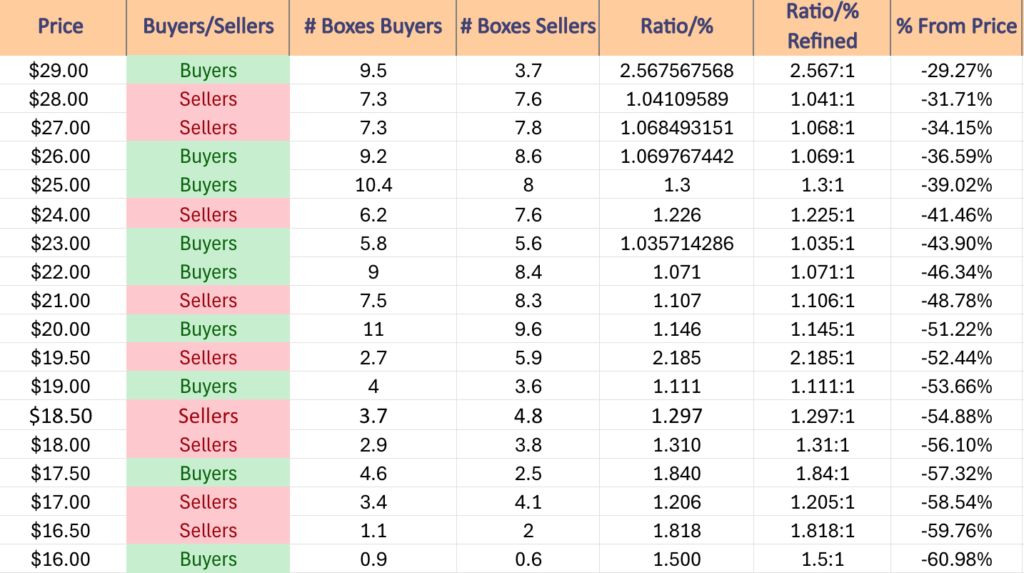
$29 – Buyers – 2.57:1, -29.27% From Current Price Level
$28 – Sellers – 1.04:1, -31.71% From Current Price Level
$27 – Sellers – 1.07:1, -34.15% From Current Price Level
$26 – Buyers – 1.07:1, -36.59% From Current Price Level
$25 – Buyers – 1.3:1, -39.02% From Current Price Level – 200 Day Moving Average*
$24 – Sellers – 1.23:1, -41.46% From Current Price Level
$23 – Buyers – 1.04:1, -43.9% From Current Price Level
$22 – Buyers – 1.07:1, -46.34% From Current Price Level
$21 – Sellers – 1.11:1, -48.78% From Current Price Level
$20 – Buyers – 1.15:1, -51.22% From Current Price Level
$19.50 – Sellers – 2.19:1, -52.44% From Current Price Level
$19 – Buyers – 1.11:1, -53.66% From Current Price Level
$18.50 – Sellers – 1.3:1, -54.88% From Current Price Level
$18 – Sellers – 1.31:1, -56.1% From Current Price Level
$17.50 – Buyers – 1.84:1, -57.32% From Current Price Level
$17 – Sellers – 1.21:1, -58.54% From Current Price Level
$16.50 – Sellers – 1.82:1, -59.76% From Current Price Level
$16 – Buyers – 1.5:1, -60.98% From Current Price Level
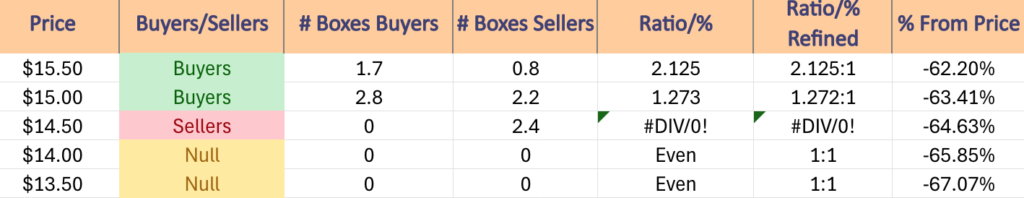
$15.50 – Buyers – 2.13:1, -62.2% From Current Price Level
$15 – Buyers – 1.27:1, -63.41% From Current Price Level
$14.50 – Sellers – 2.4:0*, -64.63% From Current Price Level
$14 – NULL – 0:0*, -65.85% From Current Price Level
$13.50 – NULL – 0:0*, -67.07% From Current Price Level
*** I DO NOT OWN SHARES OR OPTIONS CONTRACT POSITIONS IN UTSL AT THE TIME OF PUBLISHING THIS ARTICLE ***