DFEN, the Direxion Daily Aerospace & Defense Bull 3x Shares ETF has advanced +154.6% over the past year, gaining +176.78% since their 52-week low in October of 2023, and closed -1.55% below their 52-week high that was set today (all figures ex-distributions).
Escalating global tensions have helped propel DFEN & its component stocks higher this year & these gains look to continue in the coming months based on what we just saw in the news between Israel & Iran.
Some of DFEN ETF’s largest holdings include GE Aerospace (GE), Raytheon Technologies Corporation (RTX), Boeing (BA), L3 Harris Technologies (LHX), Northrop Grumman (NOC), Lockheed Martin (LMT), General Dynamics (GD), Axon Enterprise Inc. (AXON), Transdigm Group (TDG) & Howmet Aerospace Inc. (HWM).
Below is a brief technical analysis of DFEN’s past week & a half, as well as a price level:volume sentiment analysis of the price levels DFEN has traded at over the past ~2 years.
Included in this data is also their recent support & resistance levels so that readers can gain insight into how strong/weak these support/resistance levels may be in the future, based on past investor behavior.
It is not intended to serve as financial advice, but rather as an additional tool to reference while performing your own due diligence on DFEN.
Technical Analysis Of DFEN, The Direxion Daily Aerospace & Defense Bull 3x Shares ETF
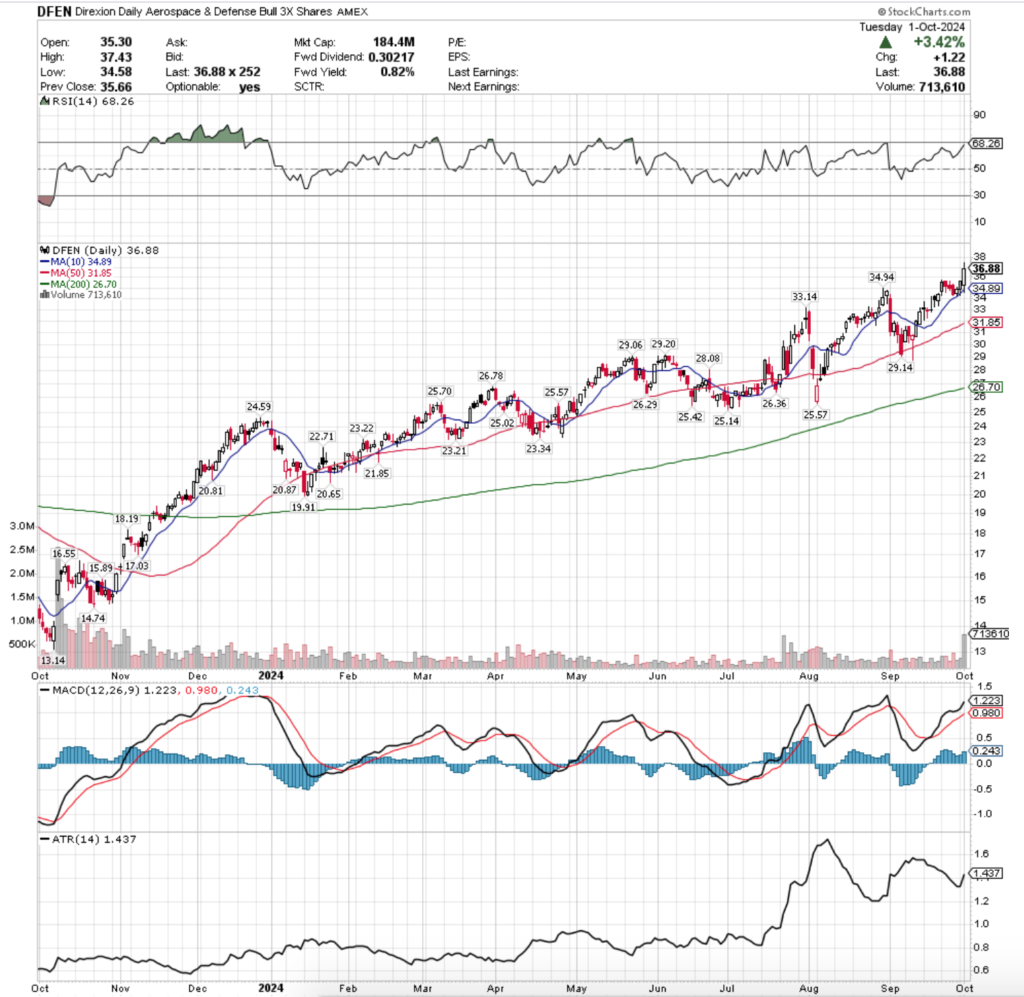
Their RSI is approaching overbought territory, sitting currently at 68.26, while their MACD is still signaling bullish sentiment as they notch a new 52-week high today.
Volumes were +6.39% above the prior year’s average this past week & a half (293,318.57 vs. 275,696.94), primarily due to yesterday’s high volume & wide range session that closed as a +3.42% advance for the day.
Last Monday began on a bullish note for DFEN, as the session resulted in an advance on the highest advancing volume they’d had in roughly a month.
Tuesday day DFEN open higher, but immediately began to decline as market participants were eager to collect some profits following their run up that lasted nearly two weeks.
Prices closed about midway through Monday’s candle’s real body, but tested below the opening price of Monday indicating that there was more appetite to the downside in the near-term.
Wednesday followed suit, opening near the close of Tuesday’s session & showing some signs of risk-on appetite based on their upper shadow that was close to Tuesday’s opening price level.
However, Wednesday’s candle’s lower shadow showed that the bulls were still not fully in control & that the declines may not be over.
Thursday confirmed this as the session opened near Wednesday’s open, tested a hair higher before ultimately declining the rest of the day, although not coming near the support of the 10 day moving average.
It should be noted that Thursday’s declining volume was the highest level since the first day of September, as given that the price didn’t actually test the 10 DMA then it can be seen as a likely reversal point as the bears had become exhausted.
Friday opened slightly higher, dipped briefly to test the support of the 10 DMA, but ultimately it was back to risk-on for the DFEN names heading into the weekend (although on low volume, indicating there was still a sense of hesitancy).
DFEN started the new week off on a strong foot, opening above its closing price from Friday, testing lower against the support of the 10 DMA, which despite breaking down briefly managed to hold up & DFEN rallied higher to close the day.
Israel & Iran’s situation continued escalating, leading DFEN to have yesterday’s +3.42% advancing session on volume that eclipsed most of the volume levels of the past year.
While there was some downside appetite, which notably included another temporary breakdown of the 10 DMA’s support this can be attributed to the broader market index weakness yesterday, as clearly DFEN investors were ready for risk-on.
Moving forward there are now two support levels in the $34.89-34.94/share price zone which haven’t seen much in terms of downside testing, which will be an area to keep an eye on in the event of any near-term declines.
In the even that occurs, it is important to have an understanding of how investors have behaved at DFEN previously traded at price levels in order to understand how they may behave at these levels again.
This will help navigate how market participants may behave again at the same levels in the event of support level re-tests.
Price Level:Volume Sentiment For DFEN, The Direxion Daily Aerospace & Defense Bull 3x Shares ETF
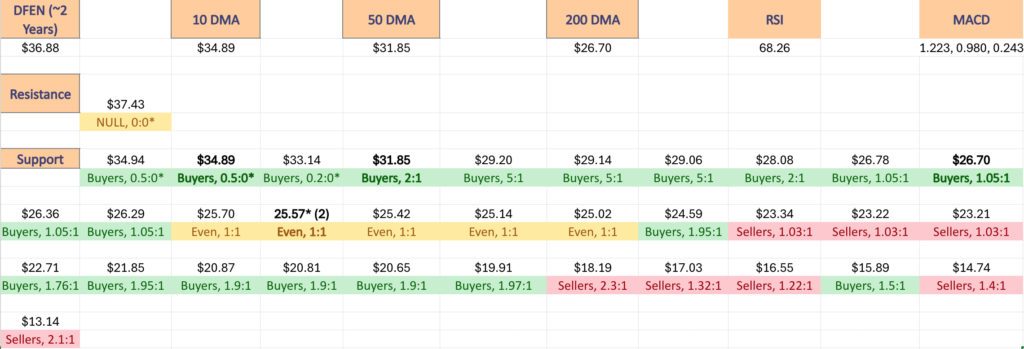
The top table below shows the support & resistance levels of DFEN from the past year’s chart, as well as their price level:volume sentiment at each, using Tuesday 10/1/24’s closing price.
The moving averages are denoted with bold.
The next charts show the volume sentiment at each individual price level DFEN has traded at over the past ~2 years.
Beneath them is a copy & pasteable list of the same data, where the support/resistance levels are denoted in bold.
All ratios with “0” in the denominator are denoted with a “*”.
NULL values are price levels that had limited trading volume, whether it be due to gaps, quick advances or they are at price extremes; in the event that they are retested & there is more data they would have a distinct “Buyers”, “Sellers” or “Even” title.
This is not intended as financial advice, but rather another tool to consider when performing your own research & due diligence on DFEN ETF.
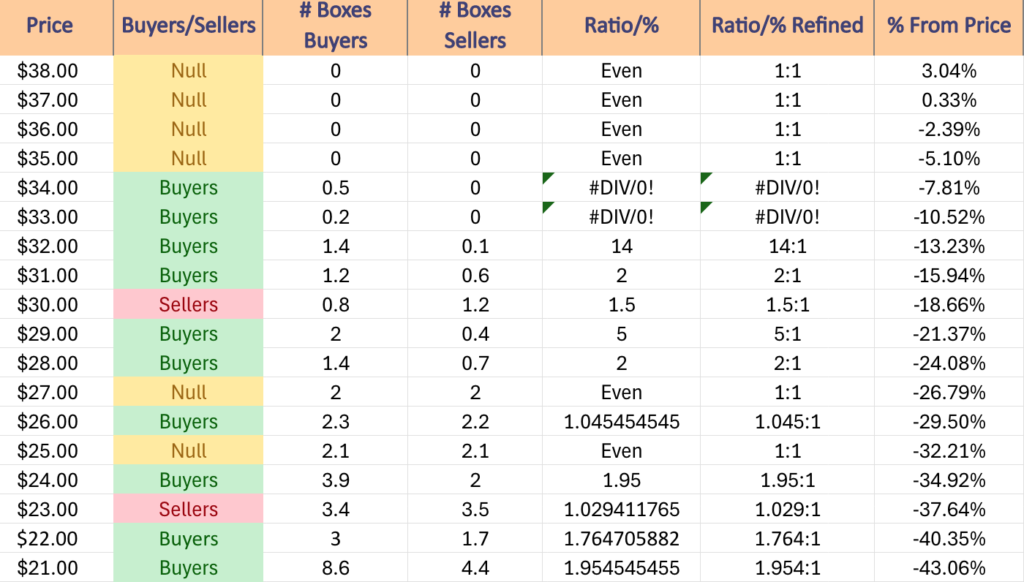
$38 – NULL – 0:0*, +3.04% From Current Price Level
$37 – NULL – 0:0*, +0.33% From Current Price Level
$36 – NULL – 0:0*, -2.39% From Current Price Level – Current Price Level*
$35 – NULL – 0:0*, -5.1% From Current Price Level
$34 – Buyers – 0.5:0*, -7.81% From Current Price Level – 10 Day Moving Average*
$33 – Buyers – 0.2:0*, -10.52% From Current Price Level
$32 – Buyers – 14:1, -13.23% From Current Price Level
$31 – Buyers – 2:1, -15.94% From Current Price Level – 50 Day Moving Average*
$30 – Sellers – 1.5:1, -18.66% From Current Price Level
$29 – Buyers – 5:1, -21.37% From Current Price Level
$28 – Buyers – 2:1, -24.08% From Current Price Level
$27 – Even – 1:1, -26.79% From Current Price Level
$26 – Buyers – 1.05:1, -29.5% From Current Price Level
$25 – Even – 1:1, -32.21% From Current Price Level – Double Touch-Point At $25.57*
$24 – Buyers – 1.95:1, -34.92% From Current Price Level
$23 – Sellers – 1.03:1, -37.64% From Current Price Level
$22 – Buyers – 1.76:1, -40.35% From Current Price Level
$21 – Buyers – 1.95:1, -43.06% From Current Price Level
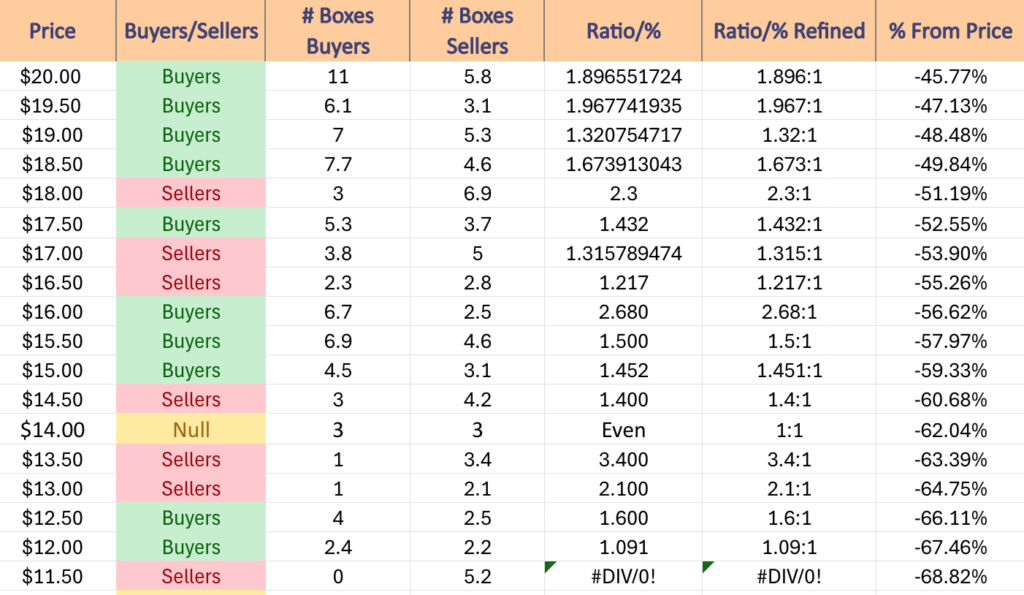
$20 – Buyers – 1.9:1, -45.77% From Current Price Level
$19.50 – Buyers – 1.97:1, -47.13% From Current Price Level
$19 – Buyers – 1.32:1, -48.48% From Current Price Level
$18.50 – Buyers – 1.67:1, -49.84% From Current Price Level
$18 – Sellers – 2.3:1, -51.19% From Current Price Level
$17.50 – Buyers – 1.43:1, -52.55% From Current Price Level
$17 – Sellers – 1.32:1, -53.9% From Current Price Level
$16.50 -Sellers – 1.22:1, -55.26% From Current Price Level
$16 – Buyer s- 2.68:1, -56.62% From Current Price Level
$15.50 – Buyers – 1.5:1, -57.97% From Current Price Level
$15 – Buyers – 1.45:1, -59.33% From Current Price Level
$14.50 – Sellers – 1.4:1, -60.68% From Current Price Level
$14 – Even – 1:1, -62.04% From Current Price Level
$13.50 – Sellers – 3.4:1, -63.39% From Current Price Level
$13 – Sellers – 2.1:1, -64.75% From Current Price Level
$12.50 – Buyers – 1.6:1, -66.11% From Current Price Level
$12 – Buyers – 1.09:1, -67.46% From Current Price Level
$11.50 – Sellers – 5.2:0*, -68.82% From Current Price Level
$11 – NULL – 0:0*, -70.17% From Current Price Level
*** I DO NOT OWN SHARES OR OPTIONS CONTRACT POSITIONS IN DFEN AT THE TIME OF PUBLISHING THIS ARTICLE ***