DPST, the Direxion Daily Regional Banks Bull 3x Shares ETF has had an impressive year, advancing +123.71% for the year, 203.19% since their 52-week low in October of 2023 & currently sits just -3.62% below their 52-week high set in July of 2024 (all figures exclude distributions).
Some of their largest holdings include Regions Financial (RF), M&T Bank (MTB), Citizens Financial Group Shares (CFG), Huntington Bancshares (HBAN), Truist Financial Corporation (TFC), First Horizon Corporation (FHN), Zions (ZION), Western Alliance (WAL), Bank Ozk (OZK), & Webster Financial Corporation (WBS).
Below is a brief technical analysis of DPST’s past week & a half, as well as a price level:volume sentiment analysis of the price levels DPST has traded at over the past year.
Included in this data is also their recent support & resistance levels so that readers can gain insight into how strong/weak these support/resistance levels may be in the future, based on past investor behavior.
It is not intended to serve as financial advice, but rather as an additional tool to reference while performing your own due diligence on DPST.
Technical Analysis Of DPST, The Direxion Daily Regional Banks Bull 3x Shares ETF
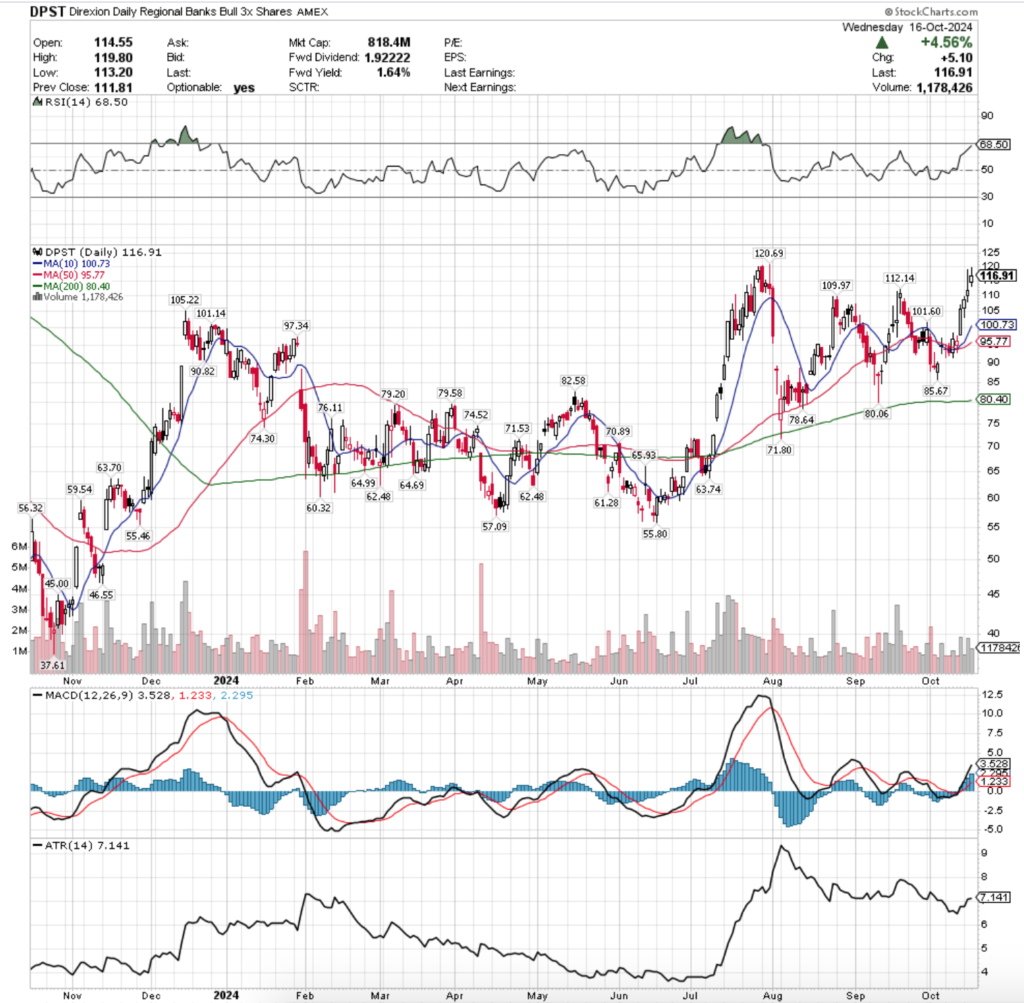
Their RSI is trending into overbought territory & currently sits at 68.5, while their MACD is currently bullish in the wake of the run up that began last Wednesday.
Volumes were -22.97% below the prior year’s average over the past week & a half (1,115,638.75 vs. 1,448,306.05), indicating that there may not be sustainable strength in the near-term to continue pushing DPST higher, despite yesterday’s close coming in above the previous two price peaks of the past two months.
Last week began on an uncertain note after the previous Friday’s gap up long-legged doji closed nestled in between the 10 & 50 day moving averages, as Monday’s session was a slight decline that resulted in a doji candle that straddled the 10 day moving average’s support.
Volumes were not noteworthy on this decline though, particularly when compared to the prior day’s advancing volume.
The next day opened on a gap up that was able to test slightly higher, but ultimately lacked the steam to continue higher & the session crashed below the support of the 10 & 50 DMAs, closing just beneath them on similarly lackluster volume.
Wednesday marked a weak reversal point after the prior three sessions all closed lower than they opened, where the day opened slightly higher than Tuesday’s close, tested lower than Tuesday’s low, but ultimately rallied up to $98.49 & closed at $96.56, signaling that the bulls were back in control & that the 10 & 50 DMAs were now support levels.
Some short term profit taking occurred on Thursday, albeit a low amount given the session’s volume, where the day opened about midway between Wednesday’s candle’s real body, temporarily declined below the 10 & 50 day moving averages’ support, before recovering to test above Wednesday’s close & settled for the day just beneath it.
This created a bearish harami based on the day’s decline, but given that the session closed higher than it opened this is negated & it can be seen as a bullish implication.
Friday confirmed this, when investors piled into DPST at the highest one-day rate since 10/1/2024 on a gap up session that ran higher resulting in a 10% day-over-day advance.
Monday the climb higher continued, despite some test into Friday’s trading range the bulls regained control & pushed DPST to a higher close for the session.
Thursday is where things began to look a little shaky & investors began to signal that their risk tolerance may be waning, as DPST opened on a gap up at $110.18, tested slightly into Wednesday’s candle’s real body, before charging higher up to $119.10.
However, this resulted in a bit of profit taking after the run up of the past week & the day’s high fell within 1.32% of the 52-week high, which sent prices to close -6.12% below the day’s high at $111.81, a +2.9% advance day-over-day.
Yesterday similarly opened on a gap up for DPST, with a slight test lower before it made another run at the 52-week high, but was stopped at $119.80 & closed slightly below that at $116.91 (-2.41% off of the day’s high).
Volumes of the past two days were stronger than most of the month of October to date, but DPST will need a larger push in terms of participation to break through their current only resistance level, the 52-week high.
This becomes particularly evident when looking back at the low of mid-June that led into the month & a half long rally to reach the 52-week high on 7/31/2024.
The good news is that DPST has been achieving higher peaks & higher troughs since it’s early-August decline, but even as of today’s high (10/17/2024) of $120.42 they have not been able to break out above the 52-week high.
Recent momentum will be difficult to continue without some profit taking & declines in the coming days-week(s), especially given their current RSI reading & low participation rate (volume).
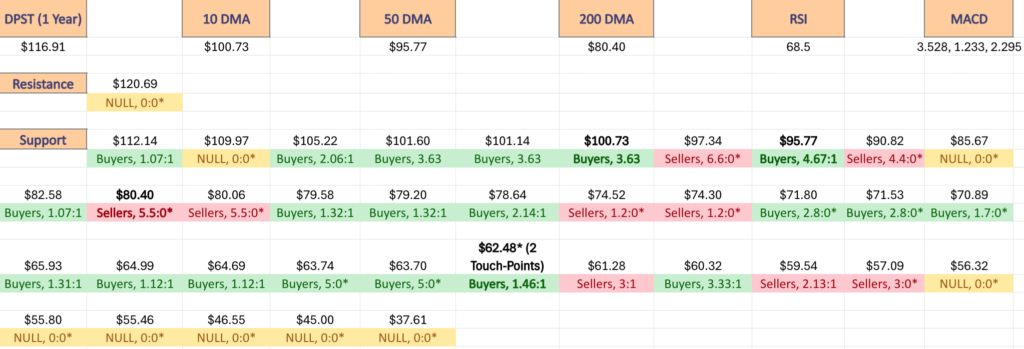
In terms of the downside & DPST’s support levels, they are all NULL (not 0, but not enough data to form a meaningful ratio yet) or Buyer dominated until the $99-99.99/share price level, which is Seller dominated & sits -15.32% below yesterday’s closing price.
Upon a closer examination of their chart this makes sense given the way they’ve advanced rapidly with frequent gap ups (due to the 3x levered nature of the ETF), while declining days tend to occur in consecutive clusters of wide-range declining sessions.
The table in the section below is meant to serve as a barometer, indicating where investor sentiment has been more strongly positive/negative in terms of price levels & support/resistance levels.
An example, the $112-113.99/share price zone has been dominated by Buyers over the past year at a rate of 1.07:1, while $110-111.99 has seen Buyers come out in packs of 2.43:1 Seller, which means that there may be stronger support in the latter price level given past behavior.
These readings can in turn be used to assess the likelihood of support/resistance holding up, or being broken through based on previous investor behavior.
It is not intended to serve as financial advice, but rather is an additional tool that can be used as part of your own due diligence process.
Price Level:Volume Sentiment Analysis For DPST, The Direxion Daily Regional Banks Bull 3x Shares ETF
The top table below shows the support & resistance levels of DPST from the past year’s chart, as well as their price level:volume sentiment at each, using Wednesday 10/16/24’s closing price.
The moving averages are denoted with bold.
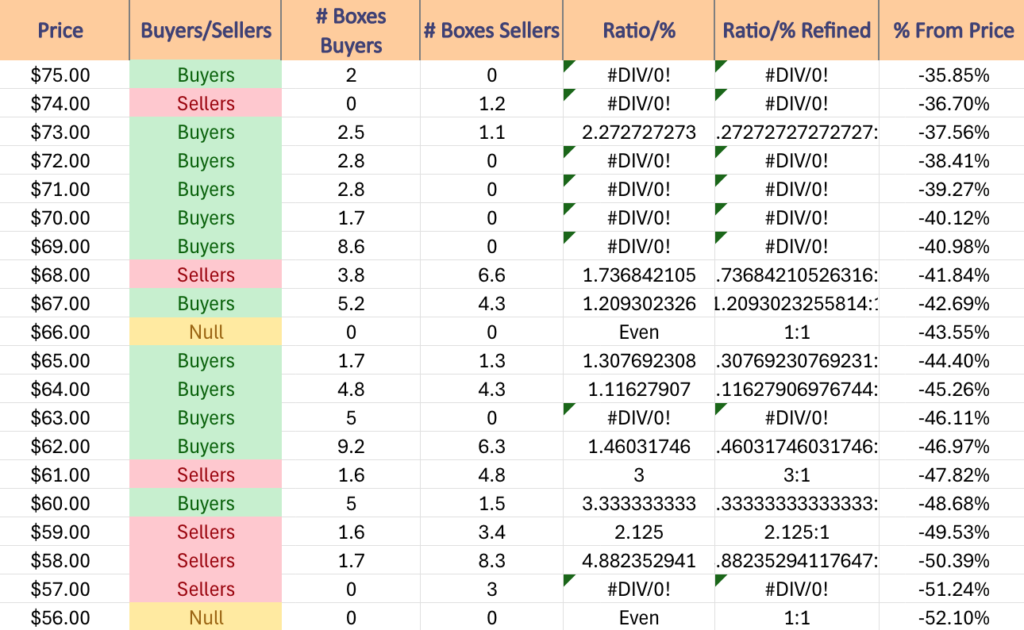
The next charts show the volume sentiment at each individual price level DPST has traded at over the past year (excluding the extreme lows of the year).
Beneath them is a copy & pasteable list of the same data, where the support/resistance levels are denoted in bold.
All ratios with “0” in the denominator are denoted with a “*”.
NULL values are price levels that had limited trading volume, whether it be due to gaps, quick advances or they are at price extremes; in the event that they are retested & there is more data they would have a distinct “Buyers”, “Sellers” or “Even” title.
This is not intended as financial advice, but rather another tool to consider when performing your own research & due diligence on DPST ETF.
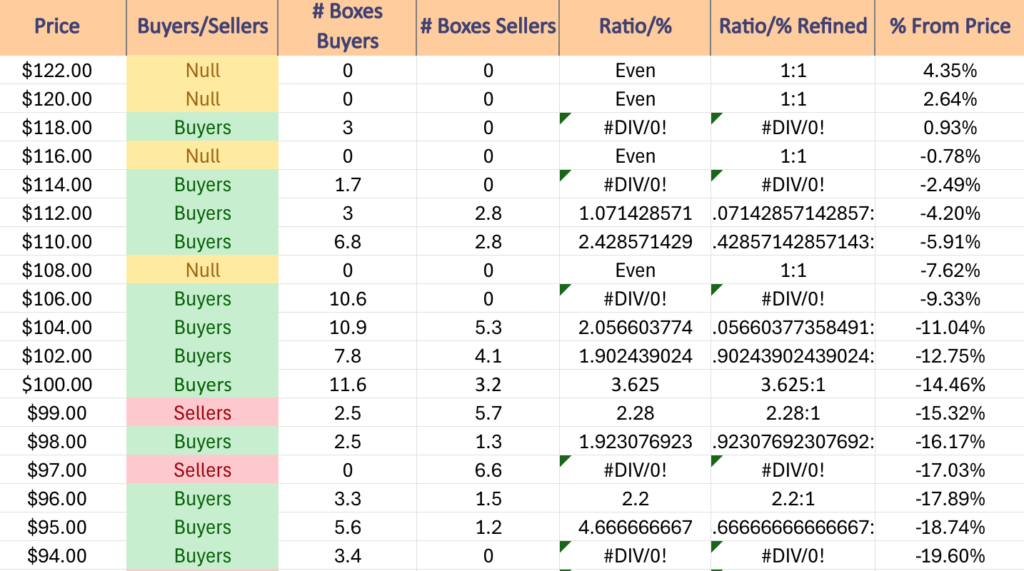
$122 – NULL – 0:0*, +4.35% From Current Price Level
$120 – NULL – 0:0*, +2.64% From Current Price Level
$118 – Buyers – 3:0*, +0.93% From Current Price Level
$116 – NULL – 0:0*, -0.78% From Current Price Level – Current Price Block*
$114 – Buyers – 1.7:0*, -2.49% From Current Price Level
$112 – Buyers – 1.07:1, -4.2% From Current Price Level
$110 – Buyers – 2.43:1, -5.91% From Current Price Level
$108 – NULL – 0:0*, -7.62% From Current Price Level
$106 – Buyers – 10.6:0*, -9.33% From Current Price Level
$104 – Buyers – 2.06:1, -11.04% From Current Price Level
$102 – Buyers – 1.9:1, -12.75% From Current Price Level
$100 – Buyers – 3.63:1, -14.46% From Current Price Level – 10 Day Moving Average*
$99 – Sellers – 2.28:1, -15.32% From Current Price Level
$98 – Buyers – 1.92:1, -16.17% From Current Price Level
$97 – Sellers – 6.6:0*, -17.03% From Current Price Level
$96 – Buyers – 2.2:1, -17.89% From Current Price Level
$95 – Buyers – 4.67:1, -18.74% From Current Price Level – 50 Day Moving Average*
$94 – Buyers – 3.4:0*, -19.6% From Current Price Level
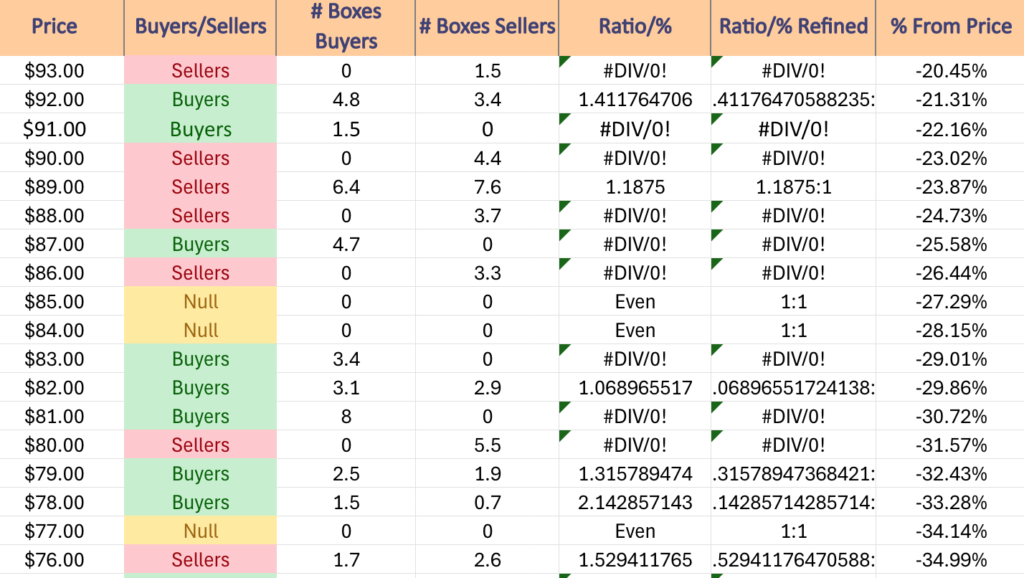
$93 – Sellers – 1.5:0*, -20.45% From Current Price Level
$92 – Buyers – 1.41:1, -21.31% From Current Price Level
$91 – Buyers – 1.5:0*, -22.16% From Current Price Level
$90 – Sellers – 4.4:0*, -23.02% From Current Price Level
$89 – Sellers – 1.19:1, -23.87% From Current Price Level
$88 – Sellers – 3.7:0*, -24.73% From Current Price Level
$87 – Buyers – 4.7:0*, -25.58% From Current Price Level
$86 – Sellers – 3.3:0*, -26.44% From Current Price Level
$85 – NULL – 0:0*, -27.29% From Current Price Level
$84 – NULL – 0:0*, -28.15% From Current Price Level
$83 – Buyers – 3.4:0*, -29.01% From Current Price Level
$82 – Buyers – 1.07:1, -29.86% From Current Price Level
$81 – Buyers – 8:0*, -30.72% From Current Price Level
$80 – Sellers – 5.5:0*, -31.57% From Current Price Level – 200 Day Moving Average*
$79 – Buyers – 1.32:1, -32.43% From Current Price Level
$78 – Buyers – 2.14:1, -33.28% From Current Price Level
$77 – NULL – 0:0*, -34.14% From Current Price Level
$76 – Sellers – 1.53:1, -34.99% From Current Price Level
$75 – Buyers – 2:0*, -35.85% From Current Price Level
$74 – Sellers – 1.2:0*, -36.7% From Current Price Level
$73 – Buyers – 2.27:1, -37.56% From Current Price Level
$72 – Buyers – 2.8:0*, -38.41% From Current Price Level
$71 – Buyers – 2.8:0*, -39.27% From Current Price Level
$70 – Buyers – 1.7:0*, -40.12% From Current Price Level
$69 – Buyers – 8.6:0*, -40.98% From Current Price Level
$68 – Sellers – 1.74:1, -41.84% From Current Price Level
$67 – Buyers – 1.21:1, -42.69% From Current Price Level
$66 – NULL – 0:0*, -43.55% From Current Price Level
$65 – Buyers – 1.31:1, -44.4% From Current Price Level
$64 – Buyers – 1.12:1, -45.26% From Current Price Level
$63 – Buyers – 5:0*, -46.11% From Current Price Level
$62 – Buyers – 1.46:1, -46.97% From Current Price Level – Double Touch-Points*
$61 – Sellers – 3:1, -47.82% From Current Price Level
$60 – Buyers – 3.33:1, -48.68% From Current Price Level
$59 – Sellers – 2.13:1, -49.53% From Current Price Level
$58 – Sellers – 4.88:1, -50.39% From Current Price Level
$57 – Sellers – 3:0*, -51.24% From Current Price Level
$56 – NULL – 0:0*, -52.1% From Current Price Level
*** I DO NOT OWN SHARES OR OPTIONS CONTRACT POSITIONS IN DPST AT THE TIME OF PUBLISHING THIS ARTICLE ***