NAIL, the Direxion Daily Homebuilders & Supplies Bull 3x Shares ETF has had an impressive year, advancing +238.29% while gaining +245.85% since their 52-week low set in October of 2023 & sits currently -20.18% below their 52-week high from October 18, 2024 (all figures ex-distributions).
NAIL provides investors with 3x levered exposure to the homebuilders & home building supplies industry, which have had a very strong past year as shown by their past year’s performance.
Some of NAIL’s largest holdings include D.R. Horton (DHI), Lennar Corporation (LEN), NVR (NVR), Pultegroup (PHM), Lowe’s Companies Inc. (LOW), Home Depot (HD), Sherwin Williams (SHW), Toll Brothers (TOL), Topbuild Corporation (BLD) & Builders Firstsource (BLDR).
Below is a brief technical analysis of NAIL, as well as a price level:volume sentiment analysis of the price levels NAIL has traded at over the past year.
Included in this data is also their recent support & resistance levels so that readers can gain insight into how strong/weak these support/resistance levels may be in the future, based on past investor behavior.
It is not intended to serve as financial advice, but rather as an additional tool to reference while performing your own due diligence on NAIL.
Technical Analysis Of NAIL, The Direxion Daily Homebuilders & Supplies Bull 3x Shares ETF
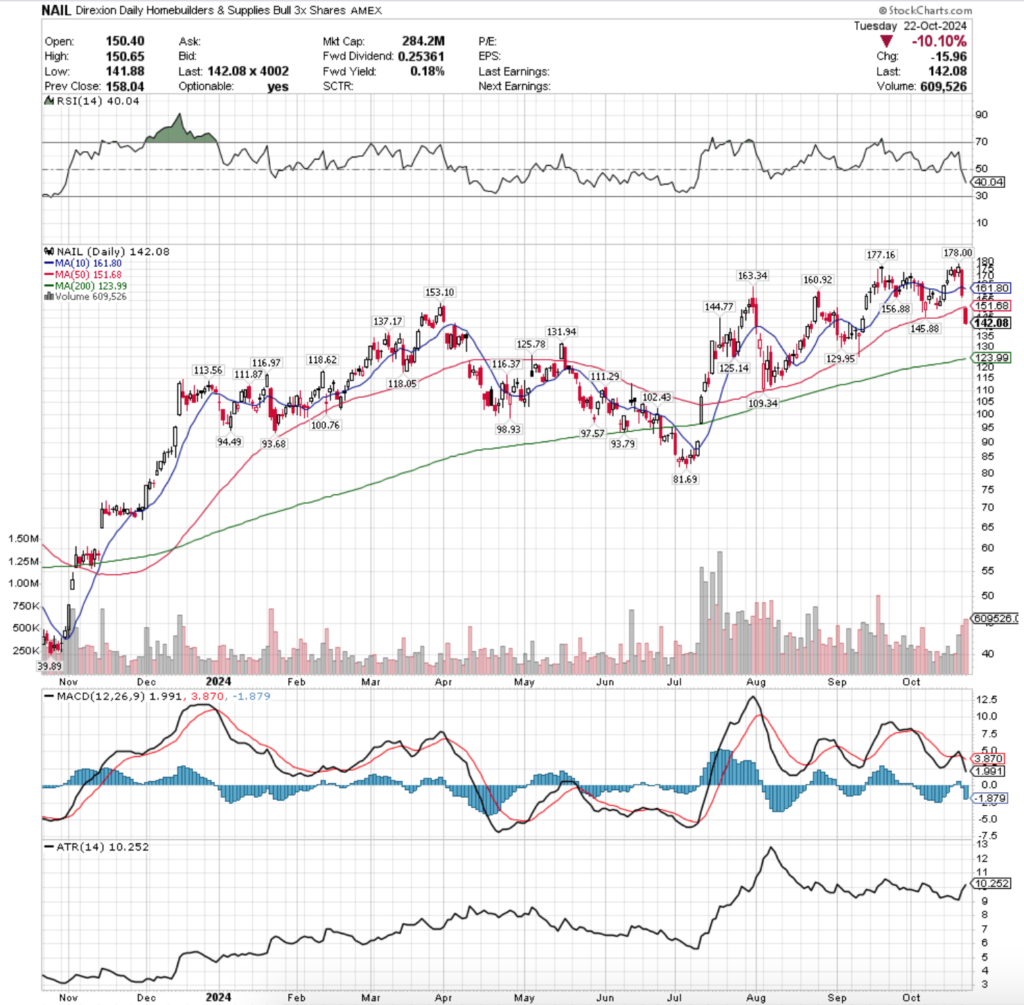
Their RSI is currently trending towards the oversold level of 30 & sits currently at the 40.04 level, while their MACD crossed over bearishly on Monday & looks to continue downward in the near-term following yesterday’s -10.1% gap down session.
Volumes over the past week & a half have been +15.92% above the prior year’s average (364,430 vs. 314,385.65), as market participants have been eager to take profits following last Friday’s reaching of a new all-time high.
Last Monday NAIL opened on a gap up on very low volume & was able to break out above the 10 day moving average’s resistance & closed the day above it, setting the stage for reaching their new all-time high later in the week.
The low volume on such a large bullish candle did add a hint of skepticism about how strong the move actually was though, as there was not a great deal of participation despite the day’s wide trading range & higher close that resulted.
Tuesday confirmed this, when despite gapping up again on the open (which also is a function of the 3x leverage at play), NAIL continued higher to the $174/share mark before the bears stepped in & forced the closing price down to $167.26 (-3.87% lower from high to close).
It should be noted that the spinning top candle is concentrated near the bottom of the day’s range, indicating that market participants were showing uncertainty in the direction as to where NAIL’s shares should be valued.
Tuesday’s session’s volume was slightly higher than Monday’s, likely due to the profit taking in that 3.87% window after a few days of gains, but it was still relatively low, indicating weakness & a lack of conviction behind the move.
Wednesday opened on another gap up at $171.38 & moved higher, but still closed as a spinning top candle at $174.26, which when paired with the even lower volumes than the prior two days had indicates that investors were on edge & becoming cautious as prices approached their previous all-time high that was set in September.
The end of the line came in sight on Thursday, when the session opened higher & closed lower, resulting in a bearish engulfing candle as investors took profits from the prior days’ gap ups, although at a low rate given the low volume of the day.
The lower shadow on the day’s candle went down to $167.67, indicating that while the bulls were able to step in & force prices higher from there for the day, market participants were growing tired & losing steam.
Friday was the last hurrah for NAIL, as it opened higher & was able to clinch a new all-time high on the highest volume it has seen in weeks, but this proved to be the top of the diving board.
Monday saw volumes that eclipsed Fridays on a declining session that saw NAIL shed -10.17% on the day & smash through the support of the 10 day moving average.
Things got worse on Tuesday, when NAIL gapped down to open below the 50 DMA & lost another -10.1% on even higher volume for the day, as market participants began running towards the exits.
It is important to note as well that in addition to the support of the 50 DMA breaking down that day, the $145.88 & $144.77 support levels were also broken through, leaving the next support level at $137.17, -3.46% below yesterday’s closing price.
After that, the next highest support level is -7.14% below yesterday’s closing level, which might normally sound like a steep decline, but NAIL is 3x leveraged making it less steep of a fall compared to an un-levered ETF.
In the coming week it will be worth keeping an eye on whether or not NAIL can begin to consolidate & form a range off of the recent-20% drop or if it will continue lower to test those next support levels.
If it is able to consolidate keep an eye on the 10 DMA & 50 DMA as they approach the price to see how they influence it higher or lower.
Another key area to watch will be their volume, as it will lend clues into what their next direction may be.
If there is an uptick in advancing volume then there may be some strength to force another run upwards, but if prices continue to move in the low volume trends that marked much of October (minus the last three days & 10/4/24) then caution should be taken moving forward as the lack of participation should be viewed as a lack of confidence in the price moves.
It should also be noted that broader indexes have been showing signs of weakness in the past week & should they see fallout NAIL will not be exempt – more on that in this week’s market review note.
Price Level:Volume Sentiment Analysis For NAIL, The Direxion Daily Homebuilders & Supplies Bull 3x Shares ETF
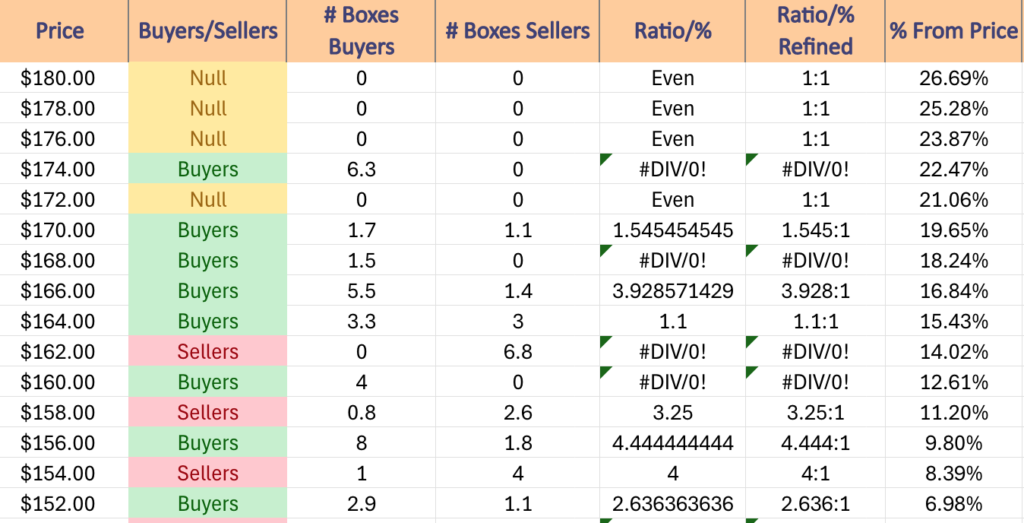
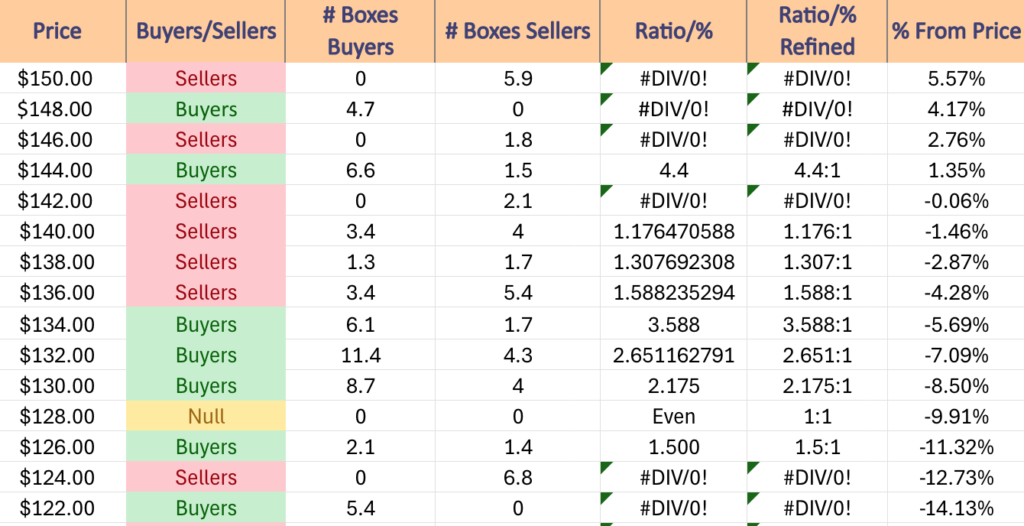
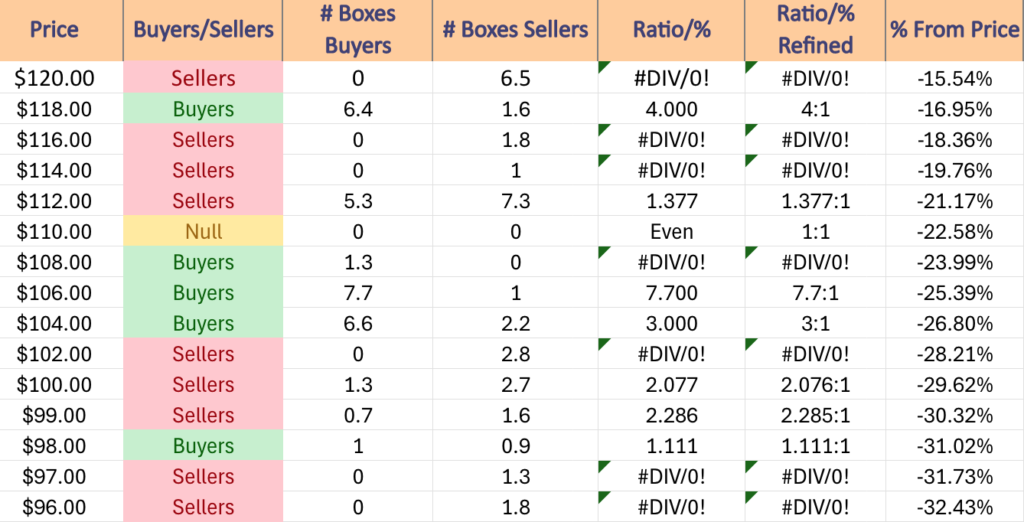
The top table below shows the support & resistance levels of NAIL from the past year’s chart, as well as their price level:volume sentiment at each, using Tuesday 10/22/24’s closing price.
The moving averages are denoted with bold.
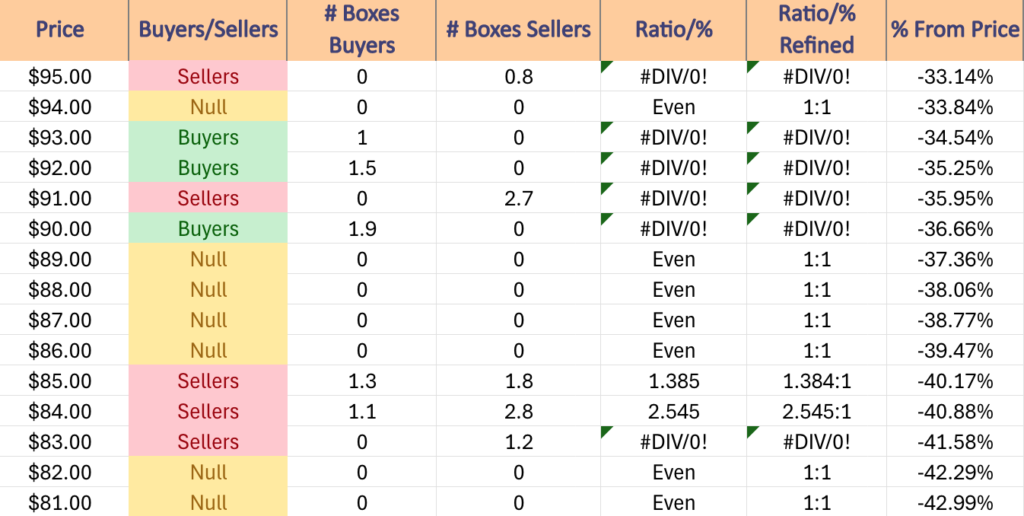
The next charts show the volume sentiment at each individual price level NAIL has traded at over the past year.
Beneath them is a copy & pasteable list of the same data, where the support/resistance levels are denoted in bold.
All ratios with “0” in the denominator are denoted with a “*”.
NULL values are price levels that had limited trading volume, whether it be due to gaps, quick advances or they are at price extremes; in the event that they are retested & there is more data they would have a distinct “Buyers”, “Sellers” or “Even” title.
This is not intended as financial advice, but rather another tool to consider when performing your own research & due diligence on NAIL ETF.

$180 – NULL – 0:0*, +26.69% From Current Price Level
$178 – NULL – 0:0*, +25.28% From Current Price Level – All-Time High*
$176 – NULL – 0:0*, +23.87% From Current Price Level
$174 – Buyers – 6.3:0*, +22.47% From Current Price Level
$172 – NULL – 0:0*, +21.06% From Current Price Level
$170 – Buyers – 1.55:1, +19.65% From Current Price Level
$168 – Buyers – 1.5:0*, +18.24% From Current Price Level
$166 – Buyers – 3.93:1, +16.84% From Current Price Level
$164 – Buyers – 1.1:1, +15.43% From Current Price Level
$162 – Sellers – 6.8:0*, +14.02% From Current Price Level
$160 – Buyers – 4:0*, +12.61% From Current Price Level – 10 Day Moving Average*
$158 – Sellers – 3.25:1, +11.2% From Current Price Level
$156 – Buyers – 4.44:1, +9.8% From Current Price Level
$154 – Sellers – 4:1, +8.39% From Current Price Level
$152 – Buyers – 2.64:1, +6.98% From Current Price Level
$150 – Sellers – 5.9:0*, +5.57% From Current Price Level – 50 Day Moving Average*
$148 – Buyers – 4.7:0*, +4.17% From Current Price Level
$146 – Sellers – 1.8:0*, +2.76% From Current Price Level
$144 – Buyers – 4.4:1, +1.35% From Current Price Level
$142 – Sellers 2.1:0*, -0.06% From Current Price Level – Current Price Block*
$140 – Sellers – 1.18:1, -1.46% From Current Price Level
$138 – Sellers – 1.31:1, -2.87% From Current Price Level
$136 – Seller s- 1.59:1, -4.28% From Current Price Level
$134 – Buyers – 3.59:1, -5.69% From Current Price Level
$132 – Buyers – 2.65:1, -7.09% From Current Price Level
$130 – Buyers – 2.18:1, -8.5% From Current Price Level
$128 – NULL – 0:0*, -9.91% From Current Price Level
$126 – Buyers – 1.5:1, -11.32% From Current Price Level
$124 – Sellers – 6.8:0*, -12.73% From Current Price Level
$122 – Buyers – 5.4:0*, -14.13% From Current Price Level – 200 Day Moving Average*
$120 – Sellers – 6.5:0*, -15.54% From Current Price Level
$118 – Buyers – 4:1, -16.95% From Current Price Level
$116 – Sellers – 1.8:0*, -18.36% From Current Price Level
$114 – Sellers – 1:0*, -19.76% From Current Price Level
$112 – sellers – 1.38:1, -21.17% From Current Price Level
$110 – NULL – 0:0*, -22.58% From Current Price Level
$108 – Buyers – 1.3:0*, -23.99% From Current Price Level
$106 – Buyers – 7.7:1, -25.39% From Current Price Level
$104 – Buyers – 3:1, -26.8% From Current Price Level
$102 – Sellers – 2.8:0*, -28.21% From Current Price Level
$100 – Sellers – 2.08:1, -29.62% From Current Price Level
$99 – Sellers – 2.29:1, -30.32% From Current Price Level
$98 – Buyers – 1.11:1, -31.02% From Current Price Level
$97 – Sellers – 1.3:0*, -31.73% From Current Price Level
$96 – Sellers – 1.8:0*, -32.43% From Current Price Level
$95 – Sellers – 0.8:0*, -33.14% From Current Price Level
$94 – NULL – 0:0*, -33.84% From Current Price Level
$93 – Buyers – 1:0*, -34.54% From Current Price Level
$92 – Buyers – 1.5:08, -35.25% From Current Price Level
$91 – Sellers – 2.7:0*, -35.95% From Current Price Level
$90 – Buyers – 1.9:0*, -36.66% From Current Price Level
$89 – NULL – 0:0*, -37.36% From Current Price Level
$88 – NULL – 0:0*, -38.06% From Current Price Level
$87 – NULL – 0:0*, -38.77% From Current Price Level
$86 – NULL – 0:0*, -39.47% From Current Price Level
$85 – Sellers – 1.38:1, -40.17% From Current Price Level
$84 – Sellers – 2.55:1, -40.88% From Current Price Level
$83 – Sellers – 1.2:0*, -41.58% From Current Price Level
$82 – NULL – 0:0*, -42.29% From Current Price Level
$81 – NULL – 0:0*, -42.99% From Current Price Level
*** I DO NOT OWN SHARES OR OPTIONS CONTRACT POSITIONS IN NAIL AT THE TIME OF PUBLISHING THIS ARTICLE ***