Well, things have become interesting… the week ended relatively in-line with last week’s expectations.
SPY, the SPDR S&P 500 ETF dipped -0.96% this past week, while the VIX closed at 19.63, indicating an implied one day move of +/-1.24% & an implied one month move of +/-5.67%.
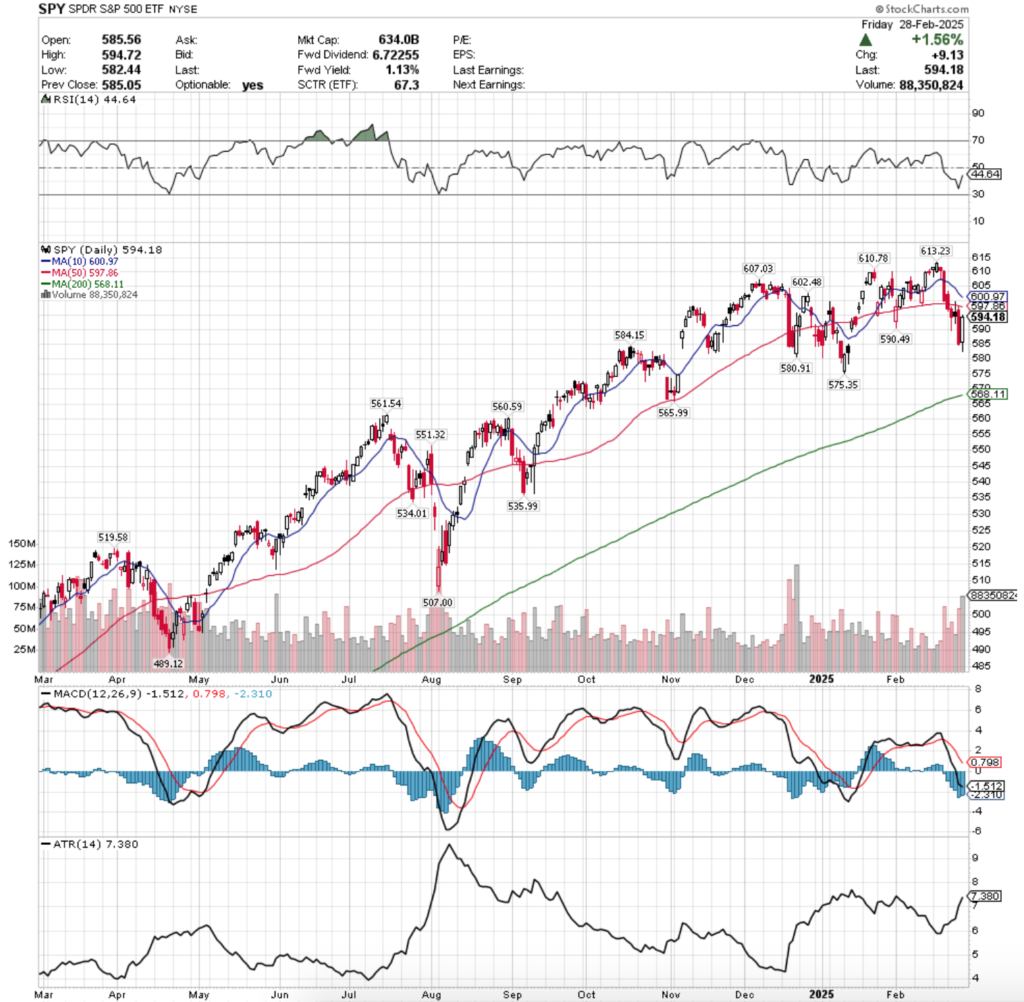
Their RSI is advancing towards the neutral 50 mark & sits currently at 44.54, while their MACD is bearish, but their histogram has begun to taper off following Friday’s session.
Volumes were +18.77% above the previous year’s average level (63,054,000 vs. 53,091,315), which should be viewed as problematic given the declines of the last week that were saved by Friday’s squeeze heading into the weekend.
Monday the week kicked off on a sour note, as while SPY opened above Friday’s close it was unable to stay above the support of the 50 day moving average, closing below it to not return above the medium-term trend line for the remainder of the week.
Tuesday the declines continued, on slightly higher volume than Monday, indicating that market participants had become antsy, particularly as the $590/share price level was temporarily broken during the session.
Wednesday the declines took a breather, but there was no indication that things were going to turn around, as the day flashed many bearish signals.
The session opened in the middle of Tuesday’s range, tested higher to break above the 50 day moving average’s resistance, before cratering & settling below the open, with the sessions’s lower shadow indicating that there was still downside appetite as well.
It should be noted that the session closed as a spinning top as well, on the week’s lowest volume while forming a bearish harami pattern with Tuesday’s candle, signaling that there was a bit of anxiety in the market.
Thursday opened on a gap up just beneath the 50 day moving average’s resistance, tested higher but was unable to break above the 50 DMA & ultimately dropped to below the $585/share price level on the second highest volume of the week.
It should also be noted that this was the third highest volume of the year, trailing the previous Friday’s volume & the volume that was produced in the following day’s session.
There was clearly a bit of fear in the air.
Friday had the highest volume of 2025 on a +1.56% advancing session which saved SPY’s week in terms of final performance.
It closed with signs of uncertainty, as there was high volume & the candle formed a bullish harami pattern, which could indicate a reversal is in the making, especially given that the volume was the highest of 2025.
It may be worth taking a look to back on December 20,2025 when a similar pattern emerged in terms of both the pattern & the volume spike while SPY was below their 50 DMA.
While the next three sessions advanced, the next few weeks saw increased declines, creating the $575.35/share support level that we will be keeping an eye on over the coming weeks.
One point of difference is that there is more distance between the 10 & 50 DMAs, follow the volume trends over the coming week(s) to see if there is an increase in advancing volume levels, which will be imperative to sustain the reversal.
It currently looks like the 50 DMA will be straddled/oscillated around moving into the next week, particularly as it is -0.52% below the 10 DMA, which is ready to cross over bearishly in the next few sessions.
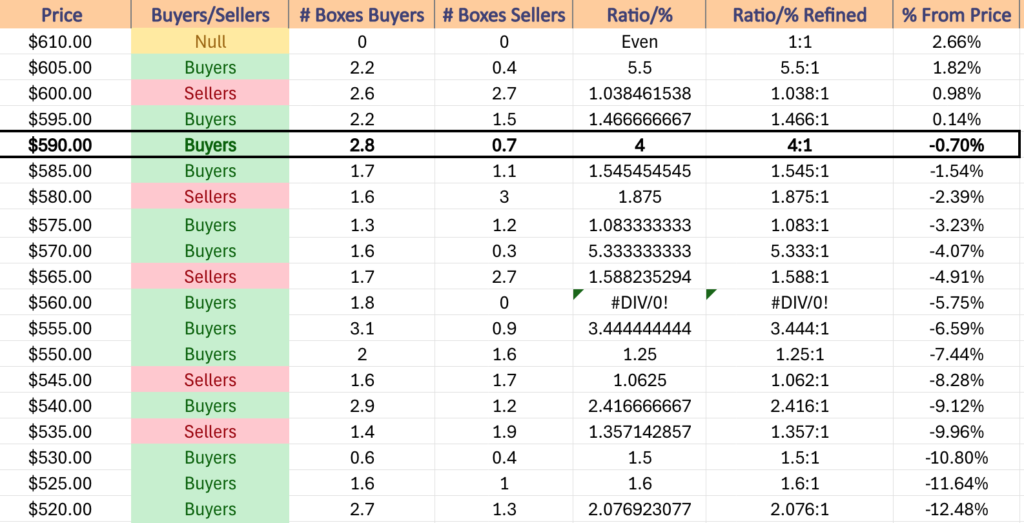
Should the $590.49/share support level break down, the following two support levels have been dominated by Sellers at the rate of 1.88:1 over the past ~3-4 years.
That $575.35 support level happens to be in a Buyer dominated zone, but the ratio has been only 1.08:1, which means that the long-term trend line is now in play, as the 200 DMA’s support is only -4.39% below Friday’s closing price & is the next support level.
Should there be any advances, the $600/share mark will be difficult to cross bullishly & sustain further advances based on the volume data in the table below.
SPY has support at the $590.49 (Volume Sentiment: Buyers, 4:1), $584.15 (Volume Sentiment: Sellers, 1.88:1), $580.19 (Volume Sentiment: Sellers, 1.88:1) & $575.35/share (Volume Sentiment: Buyers, 1.08:1) price levels, with resistance at the $597.86 (50 Day Moving Average, Volume Sentiment: Buyers, 1.47:1), $600.97 (10 Day Moving Average, Volume Sentiment: Sellers, 1.04:1), $602.48 (Volume Sentiment: Sellers, 1.04:1) & $607.03/share (Volume Sentiment: Buyers, 5.5:1) price levels.
QQQ, the Invesco QQQ Trust ETF declined -3.4% last week, faring the worst of the major index ETFs.
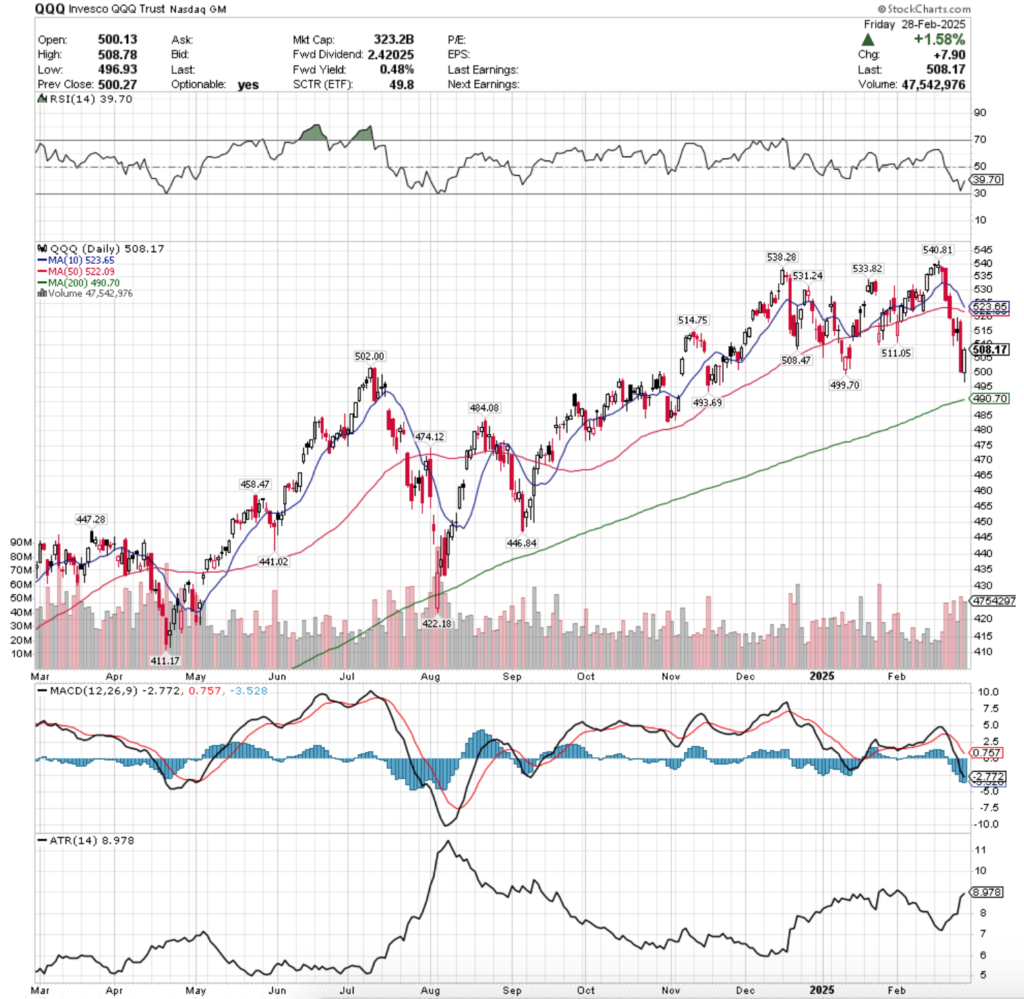
Their RSI is advancing towards the neutral 50 level, but currently sits at 39.7, while their MACD is bearish & looks set to continue lower.
Volumes were +26.82% above the previous year’s average (44,554,000 vs. 35,131,713), which paints an even bleaker picture than was just described regarding SPY.
Much like SPY, Monday opened the week off on a sour note for QQQ, as the session broke down through the 50 day moving average’s support to close beneath it, setting the stage for a week of declines.
Volume was light, but it was the kindling that lit the fire for the rest of the week.
Tuesday opened on a gap lower, but more sellers entered the arena than Monday & forced a temporary breakdown of the $510/share price level, but prices were able to recover enough to close down, but above $510/share.
Wednesday saw a temporary breather, but much like SPY’s chart, it did not paint a picture of recovery.
The day formed a bearish harami pattern with Tuesday on a high wave spinning top, indicating a great deal of indecision, particularly as the day had the weakest volume of the week.
Thursday opened on a gap up, formed a bearish engulfing pattern on Wednesday’s candle & had the second highest volume of the year, indicating that there was a large abandoning of ship after the NVDA earnings calls which was after Wednesday’s close.
Friday did QQQ no favors either, as despite the +1.58% advance the $500/share level was blatantly broken down before the rally that pushed QQQ to close higher, and volumes were lower than Thursday’s, making it appear like a bait & switch squeeze in the wake of the major declining day.
Heading into the new week QQQ has a slightly different set up than SPY, given that their 10 DMA is set to crossover bearishly through the 50 DMA by Wednesday & the proximity of their close to their long-term trend line.
QQQ closed the week with their 200 DMA’s support just -3.44% below their closing price, which indicates that prices may venture back north to near where the 10 & 50 DMA’s are temporarily, else consolidate within the range established by Friday’s candle for the week.
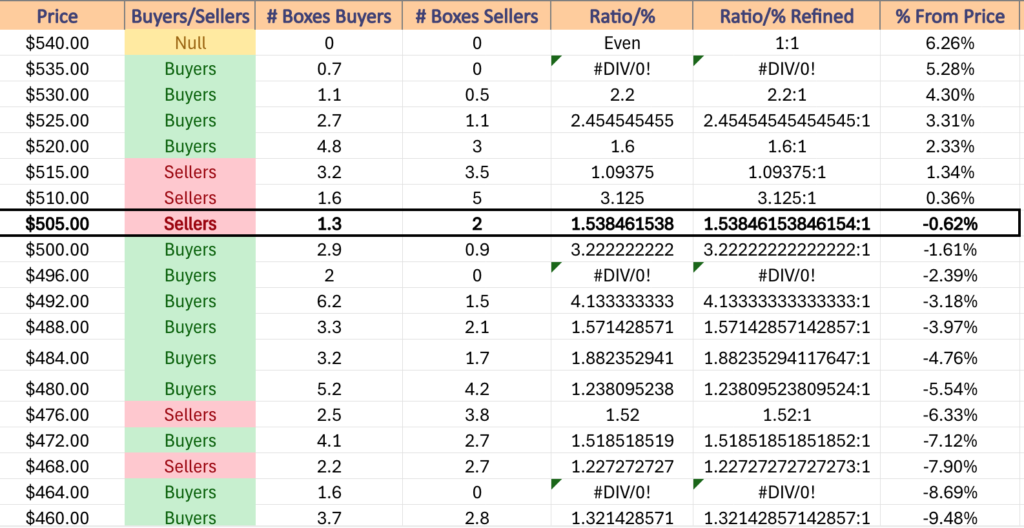
The good news for bulls is that QQQ is currently in the last of three major Seller dominated price levels that were outline below (also on the table below), but the bad news is that given how fast they fell last week & at such high participation rates, that even consolidating temporarily seems tricky without some increase in volume vs. the prior year’s average.
Should prices advance & retest the 10 & 50 DMAs’ resistance levels, the December 20th mark listed above is worth revisiting to get an idea of where things may go, as well as the chart below for the volume sentiment reading.
Should the 200 DMA’s support break down, $487.99-484.00 will be the last stalwart of support, with Buyers besting Sellers at a ratio of 4.133:1 over the past ~2-3 years, else there’ll likely be a further breakdown from the $484.08/share support level.
QQQ has support at the $502.00 (Volume Sentiment: Buyers, 3.22:1), $499.70 (Volume Sentiment: Buyers, 2:0*), $493.69 (Volume Sentiment: Buyers, 4.13:1) & $490.70/share (200 Day Moving Average, Volume Sentiment: Buyers, 1.57:1) price levels, with resistance at the $508.47 (Volume Sentiment: Sellers, 1.54:1), $511.05 (Volume Sentiment: Sellers, 3.13:1), $514.75 (Volume Sentiment: Sellers, 3.13:1) & $522.09/share (50 Day Moving Average, Volume Sentiment: Buyers, 1.6:1) price levels.
IWM, the iShares Russell 2000 ETF fell -1.45% last week, as small caps held steady on volume, but were unable to finish above par.
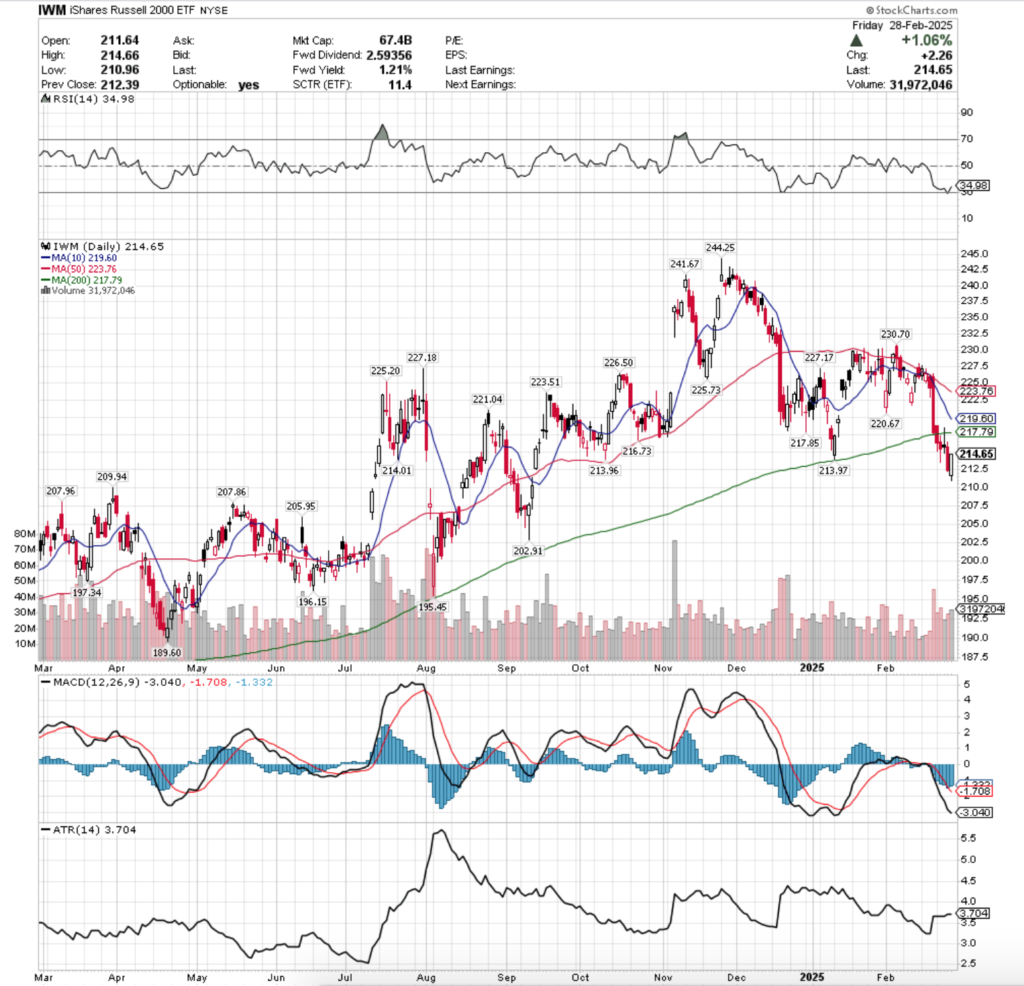
Their RSI is advancing after bouncing off of the oversold 30 level & sits currently at 34.98, while their MACD is still bearish, but the histogram is waning after Friday’s advancing session.
Volumes were +4.82% above the previous year’s average (30,156,000 vs. 28,769,163), which while it appears irrelevant compared to SPY & QQQ does indicated that there is trouble brewing for small caps as well.
Monday set the week up for failure quickly, as the session immediately broke down the long-term trend line of support & tested the downside of $215/share, indicating that folks were hopping out of the pool.
Tuesday this continued, when the session opened & tried to test the resistance of the 200 DMA, failed & went south to close on a decline on the highest volume of the week.
Wednesday attempted a “Hail Mary” & wound up just forming a bearish harami pattern on the week’s weakest volume, but the upper shadow shows that at least for a moment, there were some buyers in the room.
IWM closed as a spinning top candle that closed lower than it opened, indicating indecision-to-negative sentiment, with the lower shadow of the day’s range breaking below $215/share, setting the stage for further losses.
This was also the week’s weakest session by volume, indicating that there was not much validity to the upwards moves of the day & that profits were taken.
Thursday produced further declines that lead to IWM being under $212.50/share, with the upper shadow of the day’s candle not signaling much upside appetite.
Friday opened on a gap lower, tested lower, before closing out as an advance of +1.06%, but the volumes tell the same story of short-term squeeze, which the 200 DMA’s resistance at 1.46% above Friday’s close will likely prove true.
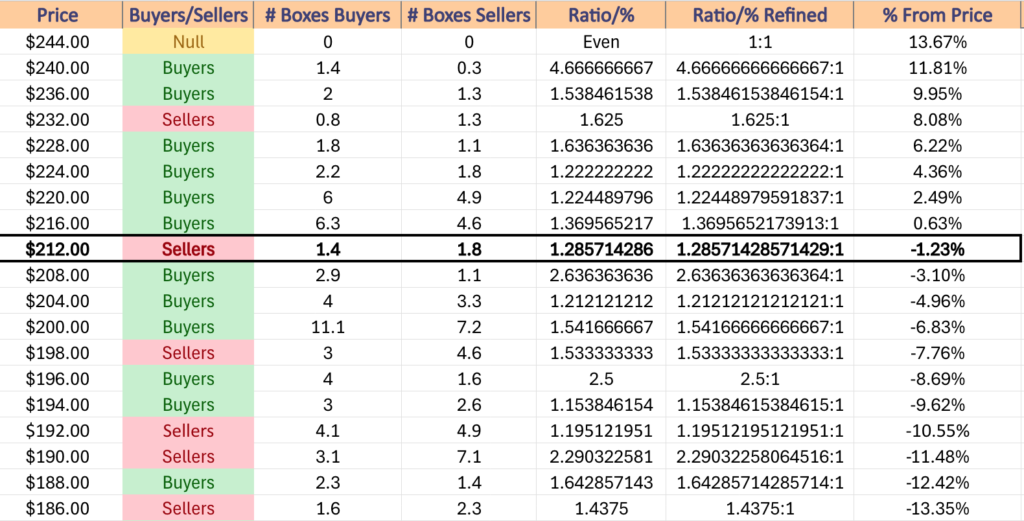
IWM is currently in the $212-213.99/share price zone, which over the past ~2-3 years has been primarily dominated by the Sellers at a ratio of 1.29:1, signaling that the added resistance of the long-term trend line may add trouble for the index.
Look for the 10 & 50 Day Moving Averages to cross bearishly through the 200 DMA over the next 6 sessions, and unless we get some bullish catalyst, it looks like we’ll see some consolidation with further declines in the near-term.
Any catalyst will need sufficient levels of volume behind it to become sustainable, so this week’s levels are nothing of note, unless we see more days with higher levels of advancing volume.
The $209.94/share support level has typically been won by the Buyers at a rate of 2.64:1, which will be a key area to watch should we see any declines through the three closer support levels that are all in a Seller zone.
Reference the table below for more information on IWM’s volume sentiment by price level.
IWM has support at the $214.01 (Volume Sentiment: Sellers, 1.29:1), $213.97 (Volume Sentiment: Sellers, 1.29:1), $213.96 (Volume Sentiment: Sellers, 1.29:1) & $209.94/share (Volume Sentiment: Buyers, 2.64:1) price levels, with resistance at the $216.73 (Volume Sentiment: Buyers, Buyers, 1.37:1), $217.79 (200 Day Moving Average, Volume Sentiment: Buyers, 1.37:1), $217.85 (Volume Sentiment: Buyers, 1.37:1) & $219.60/share (10 Day Moving Average, Volume Sentiment: Buyers, 1.37:1) price levels.
DIA, the SPDR Dow Jones Industrial Average ETF squeaked out an advance of +0.97%, as the blue chip index remained resilient while the other majors declined, but participation was low.
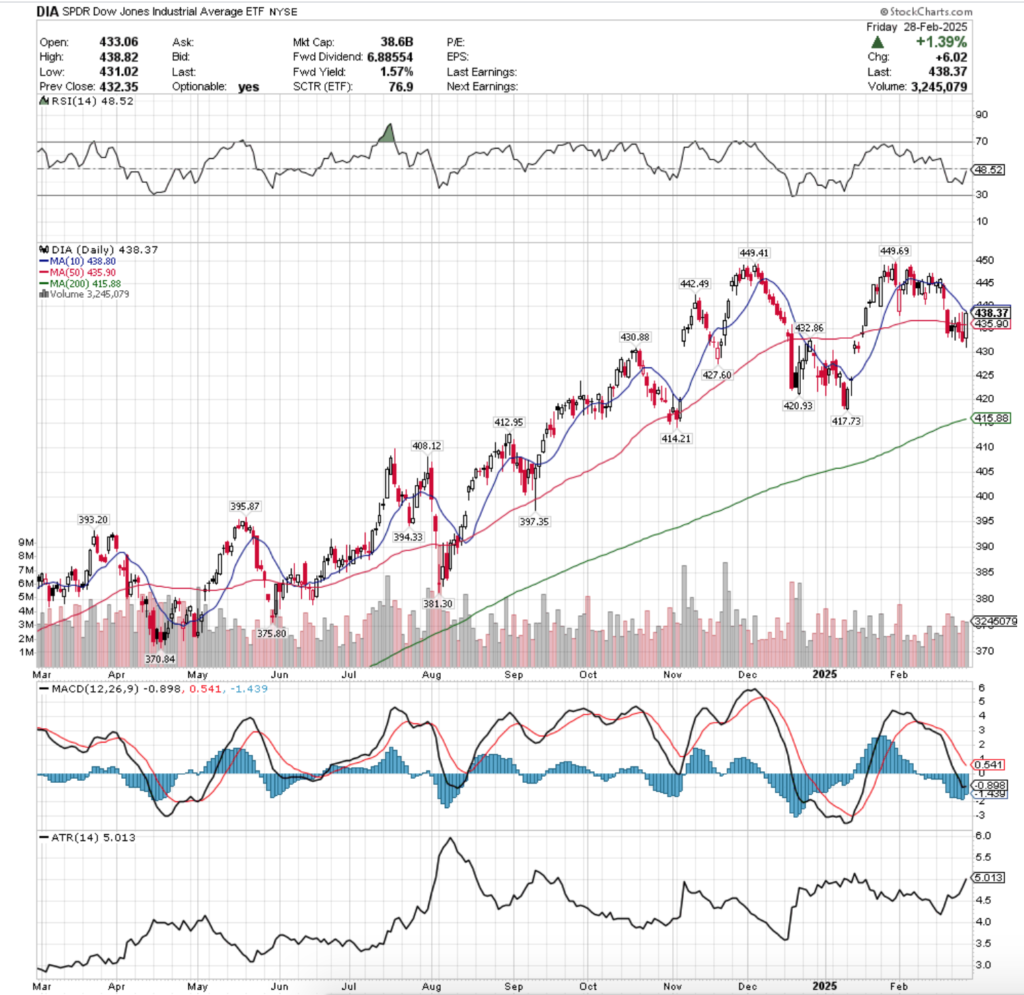
Their RSI is approaching the neutral 50-mark at 48.52, while their MACD is bearish, but has flattened out in the wake of Friday’s session.
Volumes were -4.22% lower than their prior year’s average level (3,112,000 vs. 3,249,163), bucking the trend on volume & advance/decline, but not showing much sign of life.
Monday kicked the week off in spooky-spirit, with a spinning top bearish harami pattern that had the week’s highest volume & a close that was lower than the open, but the lower shadow indicated that there was more appetite lower vs. higher.
Tuesday also gave off a lack of confidence, as DIA tested even lower, before temporarily breaking through the 50 day moving average’s resistance & closing as a spinning top, in-line with the 50 DMA.
Wednesday showed the worst volume of the week, on a session that featured a gap up, a test slightly higher than Tuesday & then a decline that was slightly above Tuesday’s low, inspiring a slight bit of optimism.
Thursday gave an indication that we may see the 10 DMA be straddled as it bearishly approaches the 50 day moving average based on its upper shadow, which also broke the day prior’s high, but that bearish day was the second highest volume day of the week.
Partially due to the wide range & likely some intra-day profit taking, but it showed that folks were willing to see the 10 DMA for a brief vacation.
Friday had the third highest volume of the week, which is troubling as it shows that the 10 DMA’s resistance is proving temporarily resilient, as it sits <1% above the 50 DMA’s support, indicating price will likely straddle the 10 & consolidate, else decline unless we see a substantial uptick in volume on some advances.
It’s also worth looking at the unfilled gaps of early 2025; DIA is the blue chip index, everyone buys into them at the end of the day for the most part for safety, this is in part why they’ve weathered the storm so well.
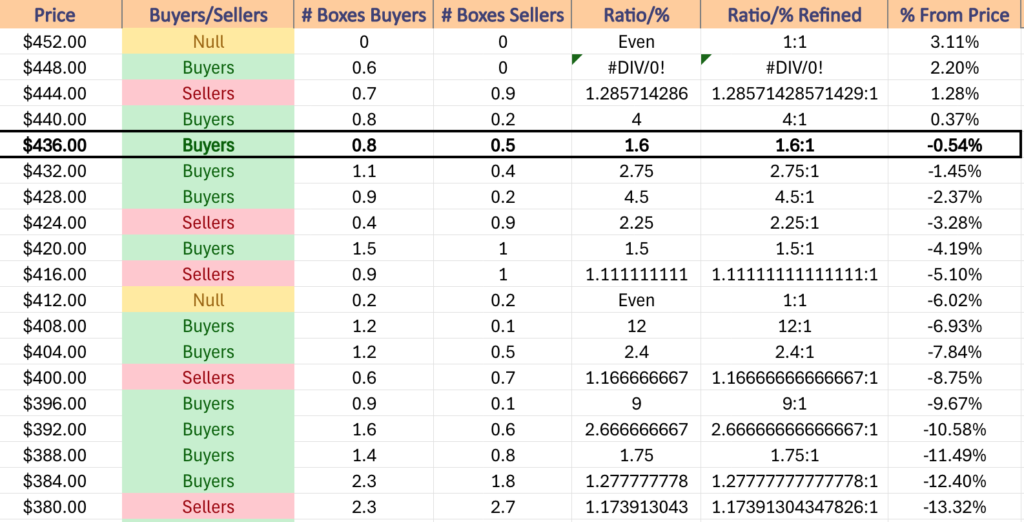
After a -2.37% decline, per the table below, there is a bit of room for declines based on previous volume trends, which will be key areas to keep an eye on in the coming week(s).
DIA has support at the $435.90 (50 Day Moving Average, Volume Sentiment: Buyers, 2.75:1), $432.86 (Volume Sentiment: Buyers, 2.75:1), $430.88 (Volume Sentiment: Buyers, 4.5:1) & $427.60/share (Volume Sentiment: Sellers, 2.25:1) price levels, with resistance at the $438.80 (10 Day Moving Average, Volume Sentiment: Buyers, 1.6:1), $442.49 (Volume Sentiment: Buyers, 4:1), $449.41 (Volume Sentiment: Buyers, 0.6:0*) & $449.69/share (All-Time High, Volume Sentiment: Buyers, 0.6:0*) price levels.
The Week Ahead
Monday the week kicks off with S&P Final U.S. Manufacturing PMI data at 9:45 am, followed by Construction Spending & ISM Manufacturing data at 10 am, Fed President Musalem speaking at 12:35 pm & Auto Sales data.
Avadel Pharmaceuticals, California Resources Corp., Fortrea, N-able, Nomad Foods, Plug Power, Sunnova Energy & Surgery Partners are all due to report earnings on Monday morning, followed by ADMA Biologies, Concentra Group Holdings, GigaCloud Technology, GitLab, NuScale Power, Okta, Repay Holdings & W&T Offshore after the closing bell.
Fed President Williams speaks at 2:20 pm Tuesday, with Fed President Barkin speaking at a time yet to be determined.
Tuesday morning begins with earnings from Target, AutoZone, Best Buy, EV Go, Genius Sports, Olaplex, ON Semiconductor, Paysafe & Sea Ltd., with AeroVironment, Box, ChargePoint Holdings, Credo Technology Group, Credo Technology Group, Evolus, Flutter Entertainment, Nordstrom, Ross Stores & Sociedad Quimica y Minera due to report after the closing bell.
Wednesday begins with ADP Employment data at 8:15 am, before S&P Final U.S. Services PMI at 9:45 am, Factory Orders & ISM Services data at 10 am & the Fed Beige Book at 2 pm.
Abercrombie & Fitch, Brown-Forman, CG Oncology, Dine Brands, Foot Locker, REV Group, Riskified, SmartRent, South Bow, Stratasys & Thor Industries are all reporting earnings Wednesday morning before the session opens, with Descartes, Kodiak Gas Services, LandBridge, Marvell Technology, MongoDB, Sleep Number, Veeva Systems, Victoria’s Secret, Yext, Zscaler & Zymeworks all scheduled to report after the close.
Initial Jobless Claims, U.S. Productivity (Final) & U.S. Trade Deficit data are all due Thursday at 8:30 am, followed by Wholesale Inventories data at 10 am, Fed Governor Waller speaking at 3:30 pm & Fed President Bostic speaking at 7 pm.
Thursday morning’s earnings include America’s Car-Mart, BJ’s Wholesale, BrightSpring Health Services, Burlington Stores, Canadian Natural Resources, Cracker Barrel Old Country Store, GMS, Macy’s, Marex Group, Stevanato Group, The Toro Company & Turning Point Brands, before Broadcom, Costco Wholesale, Asure Software, BigBear.ai, Cooper, Domo, El Pollo Loco, Funko, Gap, Guidewire Software, Hewlett Packard Enterprise, MeridianLink, Samsara & Smith & Wesson Brands after the session’s close.
Friday the week winds down with U.S. Jobs Report, U.S. Unemployment Rate, U.S. Hourly Wages & Hourly Wages Year-over-Year data at 8:30 am, before Fed Governor Bowman speaks at 10:15 am, Fed President Williams speaks at 10:45 am, Fed Governor Kugler speaks at 12:20 pm, Fed Chairman Powell speaking at 12:30 pm & Consumer Credit data at 3pm.
Algonquin Power & Utilities & Genesco are both due to report earnings after the session’s close.
See you back here next week!
*** I DO NOT OWN SHARES OR OPTIONS CONTRACT POSITIONS IN SPY, QQQ, IWM OR DIA AT THE TIME OF PUBLISHING THIS ARTICLE ***