XLK, the Technology Sector Select SPDR Fund ETF has had quite the volatile past year, sitting currently just +4.43% above it’s price one year ago, -11.4% below their 52-week high in February of 2025 & +12.94% above their 52-week low in August of 2024 (all figures ex-distributions).
This shouldn’t come as a surprise given how volatile the tech sector has been over the past year, but it is interesting to think that they’re basically just above par from one year ago & right in the center of their 52-week high/low range.
Some of XLK’s largest holdings include Apple Inc. (AAPL), NVIDIA Corp. (NVDA), Microsoft Corp. (MSFT), Broadcom Inc. (AVGO), Salesforce Inc. (CRM), Oracle Corp. (ORCL), Cisco Systems Inc. (CSCO), International Business Machines Corp. (IBM), Accenture PLC. A (ACN) & Palantir Technologies Inc. Class A (PLTR).
XLK has not been able to escape the difficult past month that broader markets have faced due to tariff excitement & mixed news on inflation across the globe & will likely continue to see volatility in the weeks to come.
With that in mind, it is a good time to check in on their volume sentiment at the price levels that they’ve traded at over the past few years to gauge how market participants have behaved at these levels before.
Below is a brief technical analysis of XLK, as well as a price level:volume sentiment analysis of the price levels XLK has traded at over the ~3 years.
Included in this data is also their recent support & resistance levels so that readers can gain insight into how strong/weak these support/resistance levels may be in the future, based on past investor behavior.
It is not intended to serve as financial advice, but rather as an additional tool to reference while performing your own due diligence on XLK.
Technical Analysis Of XLK, The Technology Sector Select SPDR Fund
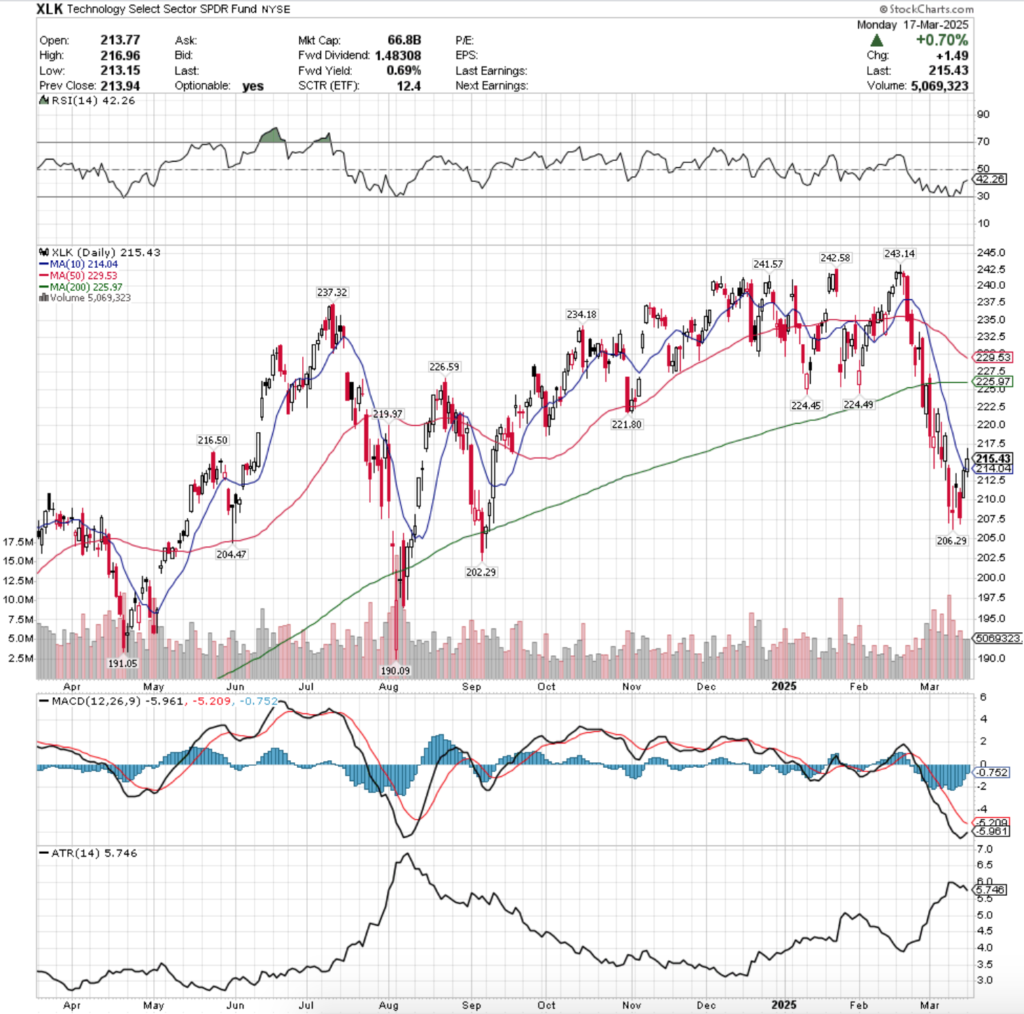
Their RSI is trending back towards the neutral 50 mark & closed yesterday at 42.26, while their MACD is still in bearish territory, but is rapidly approaching the signal line & may cross bullishly in the coming two days.
Volumes over the past week & a day have been +32.83% above the prior year’s average level (6,661,666.67 vs. 5,015,240), which is cause for concern given that there have only really been two truly advancing days, both of which had the lowest volumes of that time period.
There has been a lot of enthusiasm to get out of the pool among market participants, and with the 50 day moving average bearing down on the 200 DMA & set to bearishly crossover within a week there appears to be more declines on the horizon.
Last Monday’s declining volume eclipses all other volumes going back until August when XLK faced serious declines & went down to reach their 52-week low, but these recent losses have been more gradual & controlled compared to the large gaps seen seven months ago.
Last Monday’s session opened as a gap down, but far closer to the previous Friday’s candle than the gaps down of the aforementioned period.
Tuesday resulted in a high wave spinning top, indicating a great deal of indecision, but the low range of the day became a local support level at $206.29, while the day’s high was $211.91 on the second highest volume of the past six sessions.
This marks extreme indecision in the market, which was reflected in the next day’s spinning top with long upper & lower shadows, except on Wednesday there was light volume and despite the gap up open, the session closed lower than the open, indicating bearish sentiment was spreading.
Thursday opened on a gap down & temporarily broke down the $207.50/share level, but managed to recover to close above it, before Friday’s squeeze into the weekend session, where on low volume prices were able to power higher to close at $213.94/share, just below the 10 day moving average’s resistance.
Yesterday was able to open higher and retraced into Friday’s range briefly before breaking out above the 10 DMA’s resistance.
Yesterday was unable to reach the $217.50/share level, and closed with a long upper shadow, indicating that the bears were still relatively in control, particularly given the low volume, which was not enough to build a sustainable reversal.
Pending some type of upside catalyst, XLK doesn’t look primed to break out to the upside in the near-term, and even then it will require a great deal of advancing volume behind the move in order to be sustainable.
Now that price has met the 10 DMA it is likely to oscillated around it in the coming week(s) while we await news to send XLK higher or lower & while the 200 & 50 day moving averages continue lower towards price.
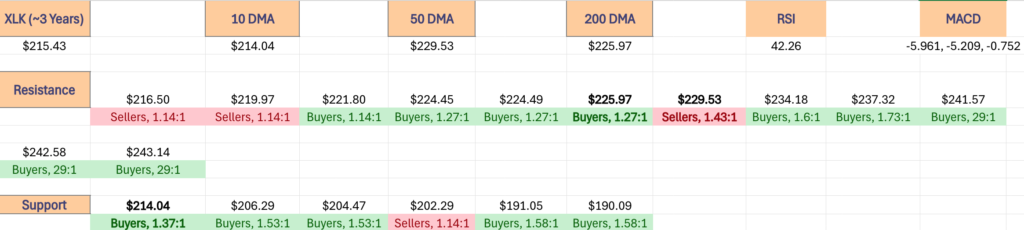
Thee $206.29/share support level will be an interesting one to watch, as should XLK get there it leads into a zone where there is a level of support for the next ~1 & 2% moves down, but then on the one year chart the floor falls out below XLK & the next support level is -5.56% lower.
Should we enter that zone, the $202.29/share support level will be critical, and it falls in a price zone that has historically been Seller dominated at a rate of 1.14:1.
From there, if the $198-199.99/share level doesn’t hold up, it is all Seller zones until the $191.99/share mark, so there will be an expected further slide down towards testing the lower one year support levels.
The following section lays out XLK’s one year support/resistance levels, as well as their Buyer:Seller (Seller:Buyer) ratios at each price level that they’ve traded at over the past ~3 years, which can be used as a barometer for estimating the expected strength/weakness of each of the support/resistance levels.
Price Level:Volume Sentiment Analysis For XLK, The Technology Select Sector SPDR Fund ETF
The top table below shows the support & resistance levels of XLK from the past year’s chart, as well as their price level:volume sentiment at each from data covering the past ~3 years, using Wednesday 3/17/2025’s closing data for their price & moving averages/other technicals.
The moving averages are denoted with bold.
The next charts show the volume sentiment at each individual price level XLK has traded at over the past ~3 years.
Beneath them is a copy & pasteable list of the same data, where the support/resistance levels are denoted in bold.
All ratios with “0” in the denominator are denoted with a “*”.
NULL values are price levels that had limited trading volume, whether it be due to gaps, quick advances or they are at price extremes; in the event that they are retested & there is more data they would have a distinct “Buyers”, “Sellers” or “Even” title.
This is not intended as financial advice, but rather another tool to consider when performing your own research & due diligence on XLK.
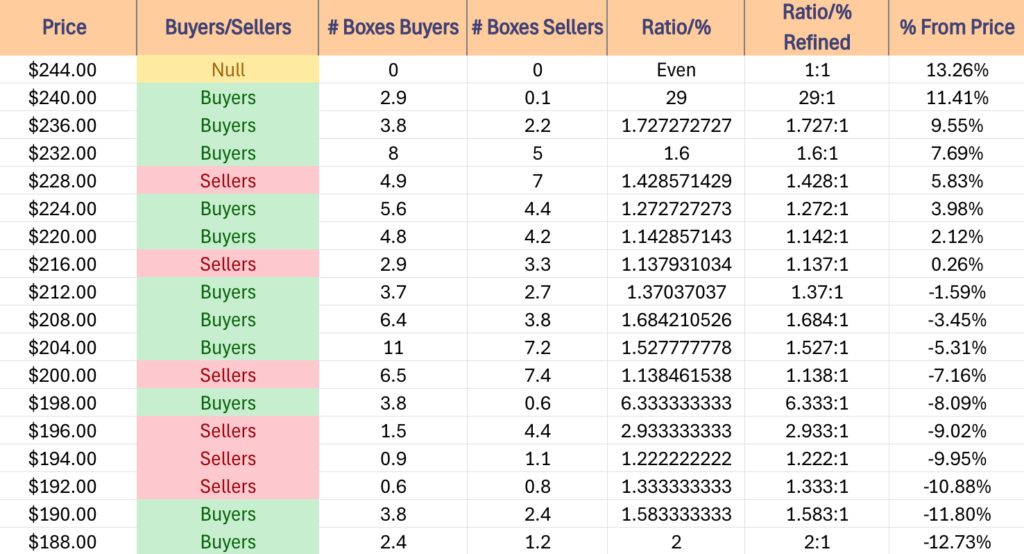
$244 – NULL – 0:0*, +13.26% From Current Price Level
$240 – Buyers – 29:1, +11.41% From Current Price Level
$236 – Buyers – 1.73:1, +9.55% From Current Price Level
$232 – Buyers – 1.6:1, +7.69% From Current Price Level
$228 – Sellers – 1.43:1, +5.83% From Current Price Level – 50 Day Moving Average*
$224 – Buyers – 1.27:1, +3.98% From Current Price Level – 200 Day Moving Average*
$220 – Buyers – 1.14:1, +2.12% From Current Price Level
$216 – Sellers – 1.14:1, +0.26% From Current Price Level
$212 – Buyers – 1.37:1, -1.59% From Current Price Level – 10 Day Moving Average & Current Price Box**
$208 – Buyers – 1.68:1, -3.45% From Current Price Level
$204 – Buyers – 1.53:1, -5.31% From Current Price Level
$200 – Sellers – 1.14:1, -7.16% From Current Price Level
$198 – Buyers – 6.33:1, -8.09% From Current Price Level
$196 – Sellers – 2.93:1, -9.02% From Current Price Level
$194 – Sellers – 1.22:1, -9.95% From Current Price Level
$192 – Sellers – 1.33:1, -10.88% From Current Price Level
$190 – Buyers – 1.58:1, -11.8% From Current Price Level
$188 – Buyers – 2:1, -12.73% From Current Price Level
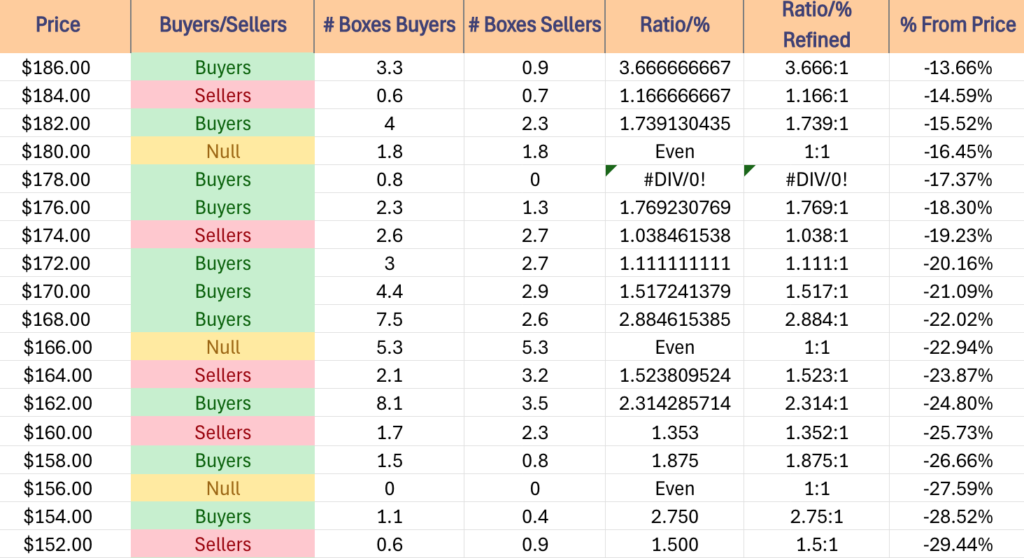
$186 – Buyers – 3.67:1, -13.66% From Current Price Level
$184 – Sellers – 1.17:1, -14.59% From Current Price Level
$182 – Buyers – 1.74:1, -15.52% From Current Price Level
$180 – Even – 1:1, -16.45% From Current Price Level
$178 – Buyers – 0.8:0*, -17.37% From Current Price Level
$176 – Buyers – 1.77:1, -18.3% From Current Price Level
$174 – Sellers – 1.04:1, -19.23% From Current Price Level
$172 – Buyers – 1.11:1, -20.16% From Current Price Level
$170 – Buyers – 1.52:1, -21.09% From Current Price Level
$168 – Buyers – 2.88:1, -22.02% From Current Price Level
$166 – Even – 1:1, -22.94% From Current Price Level
$164 – Sellers – 1.52:1, -23.87% From Current Price Level
$162 – Buyers – 2.31:1, -24.8% From Current Price Level
$160 – Sellers – 1.35:1, -25.73% From Current Price Level
$158 – Buyers- 1.88:1, -26.66% From Current Price Level
$156 – NULL – 0:0*, -27.59% From Current Price Level
$154 – Buyers – 2.75:1, -28.52% From Current Price Level
$152 – Sellers – 1.5:1, -29.44% From Current Price Level
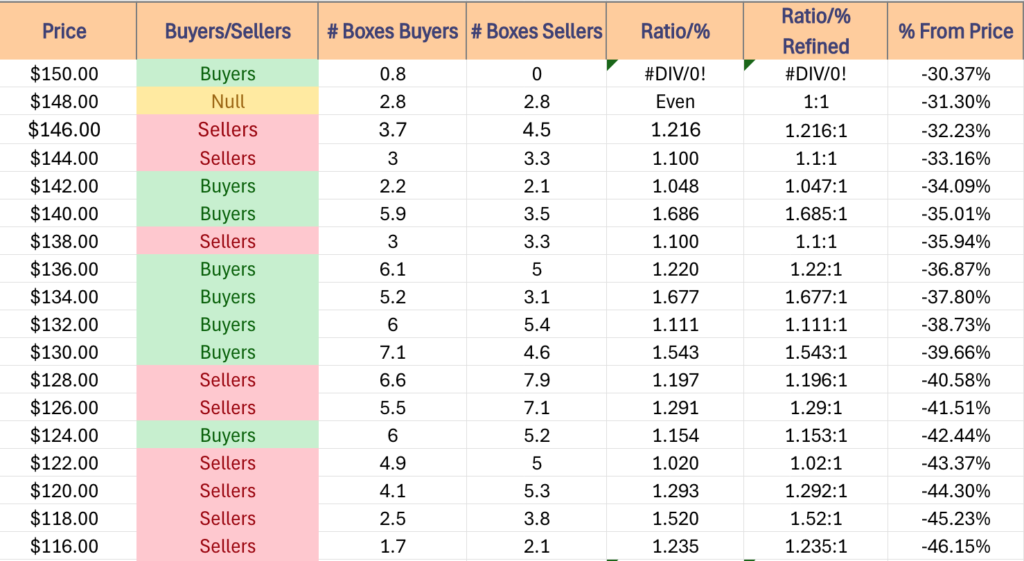
$150 – Buyers – 0.8:0*, -30.37% From Current Price Level
$148 – Even, 1:1, -31.3% From Current Price Level
$146 – Sellers – 1.22:1, -32.23% From Current Price Level
$144 – Sellers – 1.1:1, -33.16% From Current Price Level
$142 – Buyers – 1.05:1, -34.09% From Current Price Level
$140 – Buyers – 1.69:1, -35.01% From Current Price Level
$138 – Sellers – 1.1:1, -35.94% From Current Price Level
$136 – Buyers – 1.22:1, -36.87% From Current Price Level
$134 – Buyers – 1.68:1, -37.8% From Current Price Level
$132 – Buyers – 1.11:1, -38.73% From Current Price Level
$130 – Buyers – 1.54:1, -39.66% From Current Price Level
$128 – Sellers – 1.2:1, -40.58% From Current Price Level
$126 – Sellers – 1.29:1, -41.51% From Current Price Level
$124 – Buyers – 1.15:1, -42.44% From Current Price Level
$122 – Sellers – 1.02:1, -43.37% From Current Price Level
$120 – Sellers – 1.29:1, -44.3% From Current Price Level
$118 – Sellers – 1.52:1, -45.23% From Current Price Level
$116 – Sellers – 1.24:1, -46.15% From Current Price Level
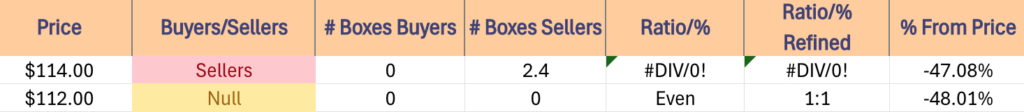
$114 – Sellers – 2.4:0*, -47.08% From Current Price Level
$112 – NULL – 0:0*, -48.01% From Current Price Level
*** I DO NOT OWN SHARES OR OPTIONS CONTRACT POSITIONS IN XLK AT THE TIME OF PUBLISHING THIS ARTICLE ***