XLC, the Communication Services Select Sector SPDR ETF has gained +12% over the past year, adding +17.19% since their 52-week low in April of 2024, but has lost -15.11% since their 52-week high set in February of 2025.
Their top holdings include Meta Platforms Inc Class A (META), Alphabet Inc. Class A (GOOGL), Alphabet Inc. Class C (GOOG), Netflix Inc. (NFLX), Take Two Interactive Software (TTWO), Live Nation Entertainment Inc. (LYV), Electronic Arts Inc (EA), T Mobile US Inc. (TMUS), Verizon Communications Inc. (VZ) & AT&T Inc. (T).
Below is a brief technical analysis of XLC, as well as a price level:volume sentiment analysis of the price levels XLC has traded at over the ~4 years.
Included in this data is also their recent support & resistance levels so that readers can gain insight into how strong/weak these support/resistance levels may be in the future, based on past investor behavior.
It is not intended to serve as financial advice, but rather as an additional tool to reference while performing your own due diligence on XLC.
Technical Analysis Of XLC, The Communication Services Select Sector SPDR ETF Fund
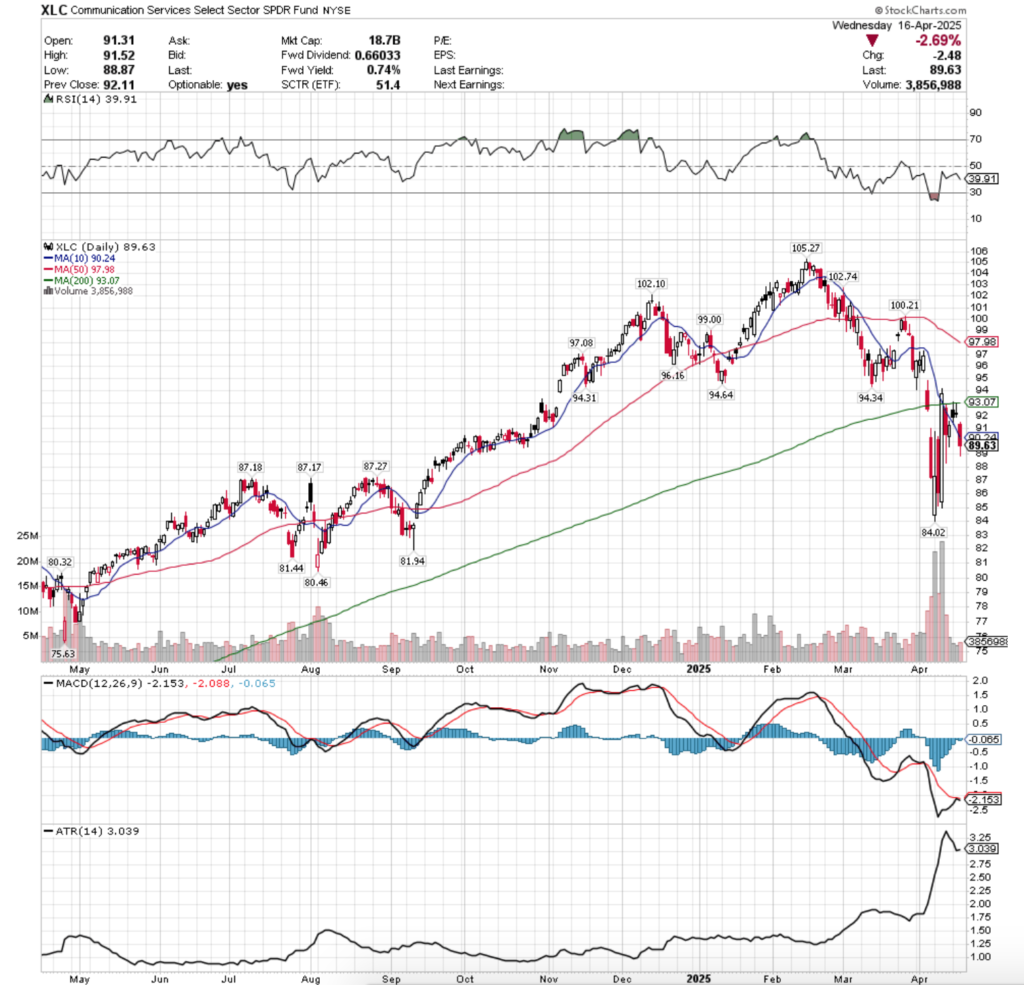
Their RSI is trending back towards oversold & sits currently at 39.91, after bouncing back from oversold territory last week, while their MACD line is at the signal line, but looks to either get rejected & head lower, and or we may see a dolphin jump over it briefly, which will ultimately be determined by today’s session.
Volumes over the past week & a half have been +130.71% higher than the prior year’s average (10,527,500 vs. 4,563,174.6), most due to last week’s volatility & have subsided now, as communications services names are beginning to look like a volatility safehaven.
It is important to note that the two highest volume sessions of this time period were advancing days, as it shows that there was positive sentiment amid uncertainty for XLC.
Last Monday marked a short-term reversal point for XLC, coming after back to back gap down sessions that broke down the long-term trend line (200 day moving average).
Volumes spiked to almost double that of the previous day’s levels, while XLC opened on a gap down, bounced off of the $84.02/share level & made a run up to $90.75, but intraday profits were taken, forcing the price to close at $87.35.
Tuesday kicked off on a gap up, but saw nowhere to run as the day’s upper shadow indicates & XLC profits were swept off of the board, exposing downside appetite to almost the $85/share level, but was able to close at $86.13/share.
Wednesday saw another gap down open & bounce off of the $84.97/share price level, before ripping higher to breach the $94/share level & ultimately close at $93.74/share, above the resistance of both the 10 & 200 day moving averages on what was by far the highest volume of the year.
As noted in this week’s weekly market review note, while this was a great storyline in terms of market participation, it did not show signs of short-term sustainability, which XLC & the major index ETFs all went on to show.
The whipsawing continued on Thursday, resulting in a bearish harami pattern, and the support of both the 10 & 200 day moving averages was broken down after that short-lived crossover.
The most important takeaway from Thursday’s session is the downside appetite that the day showed, as market participants were ok with sending XLC below $89/share, which will be important to watch as their moving averages begin to apply downwards pressure on the price.
Thursday’s volume indicated that there were a lot of folks happy to stay put, when comparing the profit taking of Thursday with the high volume of Wednesday.
Friday opened on a gap down, but was able to recover, test just below the short-term trend line (10 DMA), but there wasn’t enough volume to power it through to the upside.
This week the bearish sentiment crept back into XLC’s chart right off of the bat, as a gap up open was unable to break above the 200 DMA, and while the 10 DMA’s support held up, but the close was lower than the open, signaling that market participants had become exhausted & wanted to take some profits.
Tuesday confirmed this, as the day was rejected to the upside by the long-term trend line for a second consecutive day & while it held the $92/share mark, it formed a bearish harami with Monday’s pattern & closed as a very small spinning top, which is not a vote of confidence.
Yesterday confirmed this when XLC opened on a gap down, broke through the support of the 10 day moving average, and only sunk lower, at one point breaking below $89/share to close at $89.63/share, a -2.69% decline.
There is little upside sentiment right now, and while XLC has seen some massive inflows of advancing volume over the past couple of weeks, it will require a great deal of higher, consistent advancing sessions before a bottom is in.
To the downside there is strong Buyer sentiment at $88-88.99 & $87-87.99/share (see table below), but this may be where we see those ratios become diluted in the event of new retests.
It would be wise to review the support levels listed in the top table below to realize how spread apart they all are should the $87.27-87.17/share (Buyers, 3.11:1) be broken through in terms of support levels from the past year.
The most likely scenario in the near-term to see XLC oscillate around the 10 day moving average & react to headlines/upcoming earnings announcements accordingly, consolidating within the range of two Friday’s ago high & the lows of Monday.
If there is a gap through that support zone mentioned above, things will become difficult for XLC, as it will become a resistance zone & the would not likely be a quick recovery as the 50 day moving average approaches the 200 DMA, which a death cross would add more bearish sentiment into the mix.
While no one know’s for certain, being armed with the information in the table below will help market participants navigate XLC’s upcoming moves.
Price Level:Volume Sentiment Analysis For XLC, The Communication Services Select Sector SPDR ETF Fund
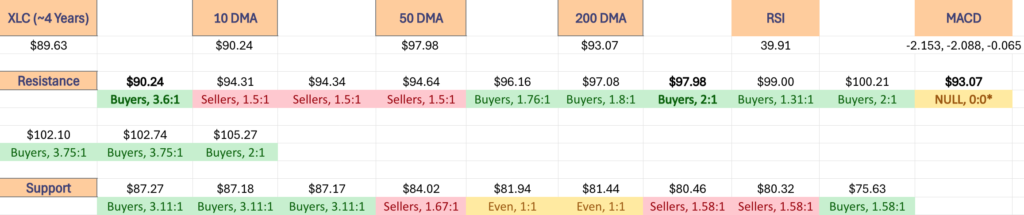
The top table below shows the support & resistance levels of XLC from the past year’s chart, as well as their price level:volume sentiment at each from data covering the past ~4 years, using Wednesday 4/16/2025’s closing data for their price & moving averages/other technicals.
The moving averages are denoted with bold.
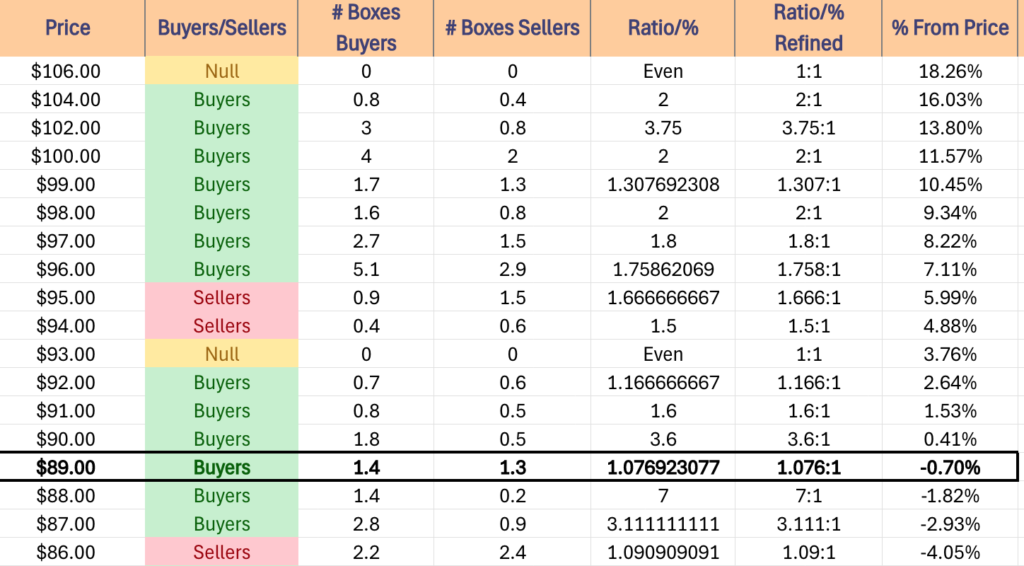
The next charts show the volume sentiment at each individual price level XLC has traded at over the past ~4 years.
Beneath them is a copy & pasteable list of the same data, where the support/resistance levels are denoted in bold.
All ratios with “0” in the denominator are denoted with a “*”.
NULL values are price levels that had limited trading volume, whether it be due to gaps, quick advances or they are at price extremes; in the event that they are retested & there is more data they would have a distinct “Buyers”, “Sellers” or “Even” title.
This is not intended as financial advice, but rather another tool to consider when performing your own research & due diligence on XLC.
The following section lays out XLC’s one year support/resistance levels, as well as their Buyer:Seller (Seller:Buyer) ratios at each price level that they’ve traded at over the past ~4 years, which can be used as a barometer for estimating the expected strength/weakness of each of the support/resistance levels.
$106 – NULL – 0:0*, +18.26% From Current Price Level
$104 – Buyers – 2:1, +16.03% From Current Price Level
$102 – Buyers – 3.75:1, +13.8% From Current Price Level
$100 – Buyers – 2:1, +11.57% From Current Price Level
$99 – Buyers, 1.31:1, +10.45% From Current Price Level
$98 – Buyers – 2:1, +9.34% From Current Price Level
$97 – Buyers – 1.8:1, +8.22% From Current Price Level – 50 Day Moving Average*
$96 – Buyers – 1.76:1, +7.11% From Current Price Level
$95 – Sellers – 1.67:1, +5.99% From Current Price Level
$94 – Sellers – 1.5:1, +4.88% From Current Price Level
$93 – NULL – 0:0*, +3.76% From Current Price Level – 200 Day Moving Average*
$92 – Buyers – 1.17:1, +2.64% From Current Price Level
$91 – Buyers – 1.6:1, +1.53% From Current Price Level
$90 – Buyers – 3.6:1, +0.41% From Current Price Level – 10 Day Moving Average*
$89 – Buyers – 1.08:1, -0.7% From Current Price Level – Current Price Level*
$88 – Buyers – 7:1, -1.82% From Current Price Level
$87 – Buyers – 3.11:1, -2.93% From Current Price Level
$86 – Sellers – 1.09:1, -4.05% From Current Price Level
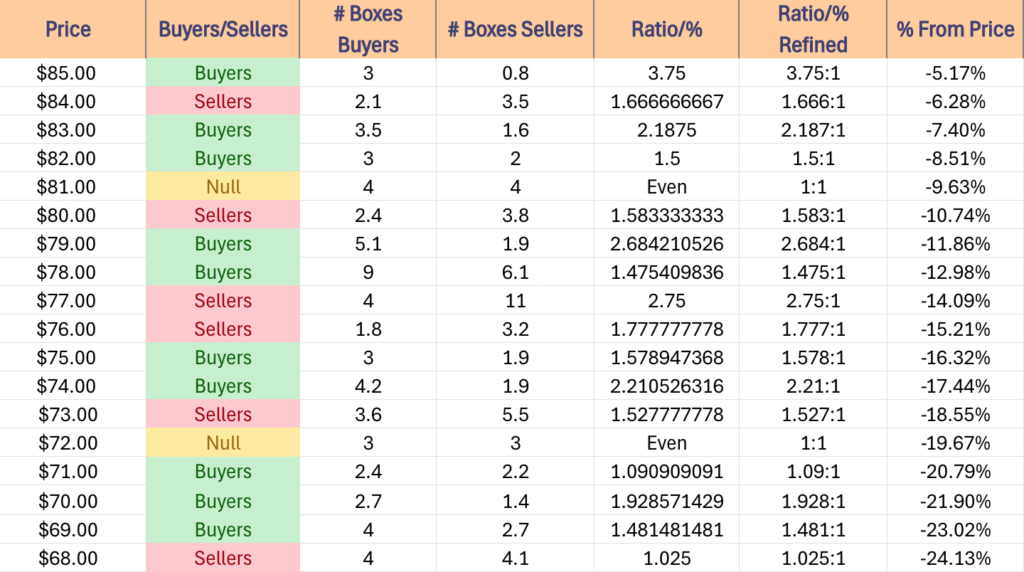
$85 -Buyers – 3.75:1, -5.17% From Current Price Level
$84 – Sellers – 1.67:1, -6.28% From Current Price Level
$83 – Buyers – 2.19:1, -7.4% From Current Price Level
$82 – Buyers – 1.5:1, -8.51% From Current Price Level
$81 – Even – 1:1, -9.63% From Current Price Level
$80 – Sellers – 1.58:1, -10.74% From Current Price Level
$79 – Buyers – 2.68:1, -11.86% From Current Price Level
$78 – Buyers – 1.48:1, -12.98% From Current Price Level
$77 – Sellers – 2.75:1, -14.09% From Current Price Level
$76 – Sellers – 1.78:1, -15.21% From Current Price Level
$75 – Buyers – 1.58:1, -16.32% From Current Price Level
$74 – Buyers – 2.21:1, -17.44% From Current Price Level
$73 – Sellers – 1.53:1, -18.55% From Current Price Level
$72 – Even – 1:1, -19.67% From Current Price Level
$71 – Buyers – 1.09:1, -20.79% From Current Price Level
$70 – Buyers – 1.93:1, -21.9% From Current Price Level
$69 – Buyers – 1.48:1, -23.02% From Current Price Level
$68 – Sellers – 1.03:1, -24.13% From Current Price Level
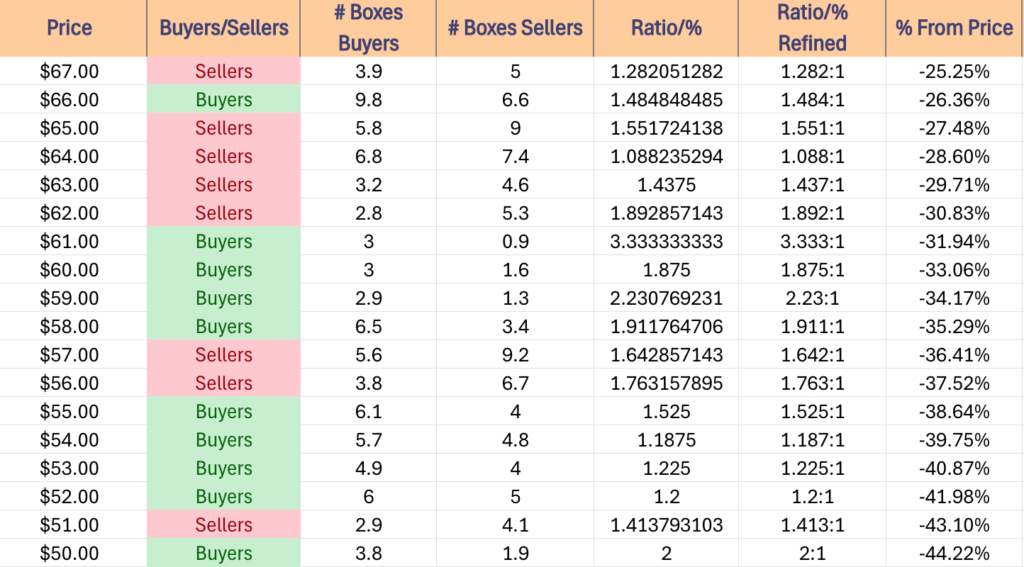
$67 – Sellers – 1.28:1, -25.25% From Current Price Level
$66 – Buyers – 1.49:1, -26.36% From Current Price Level
$65 – Sellers – 1.55:1, -27.48% From Current Price Level
$64 – Sellers – 1.09:1, -28.6% From Current Price Level
$63 – Sellers – 1.44:1, -29.71% From Current Price Level
$62 – Sellers – 1.89:1, -30.83% From Current Price Level
$61 – Buyers – 3.33:1, -31.94% From Current Price Level
$60 – Buyers – 1.88:1, -33.06% From Current Price Level
$59 – Buyers – 2.23:1, -34.17% From Current Price Level
$58 – Buyers – 1.91:1, -35.29% From Current Price Level
$57 – Sellers – 1.64:1, -36.41% From Current Price Level
$56 – Sellers – 1.76:1, -37.52% From Current Price Level
$55 – Buyers – 1.53:1, -38.64% From Current Price Level
$54 – Buyers – 1.19:1, -39.75% From Current Price Level
$53 – Buyers – 1.23:1, -40.87% From Current Price Level
$52 – Buyers – 1.2:1, -41.98% From Current Price Level
$51 – Sellers – 1.41:1, -43.1% From Current Price Level
$50 – Buyers – 2:1, -44.22% From Current Price Level
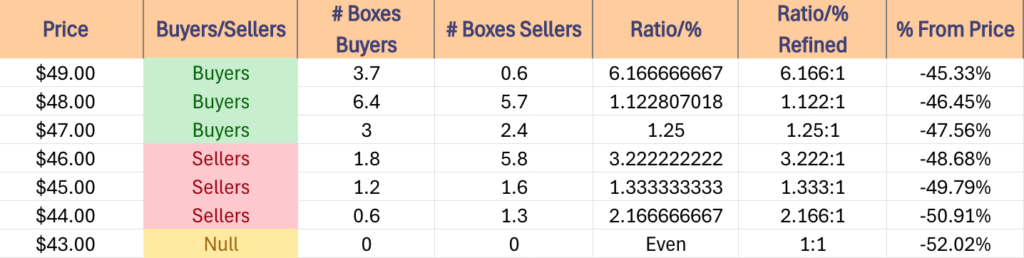
$49 – Buyers – 6.17:1, -45.33% From Current Price Level
$48 – Buyers – 1.12:1, -46.45% From Current Price Level
$47 – Buyers – 1.25:1, -47.56% From Current Price Level
$46 – Sellers – 3.22:1, -48.68% From Current Price Level
$45 – Sellers – 1.33:1, -49.79% From Current Price Level
$44 – Sellers – 2.17:1, -50.91% From Current Price Level
$43 – NULL – 0:0*, -52.02% From Current Price Level
*** I DO NOT OWN SHARES OR OPTIONS CONTRACT POSITIONS IN XLC AT THE TIME OF PUBLISHING THIS ARTICLE ***