SPY, the SPDR S&P 500 ETF declined -2.54% last week, while the VIX closed the week out at 20.57, indicating an implied one day move of +/-1.3% & an implied one month move of +/-5.95%.
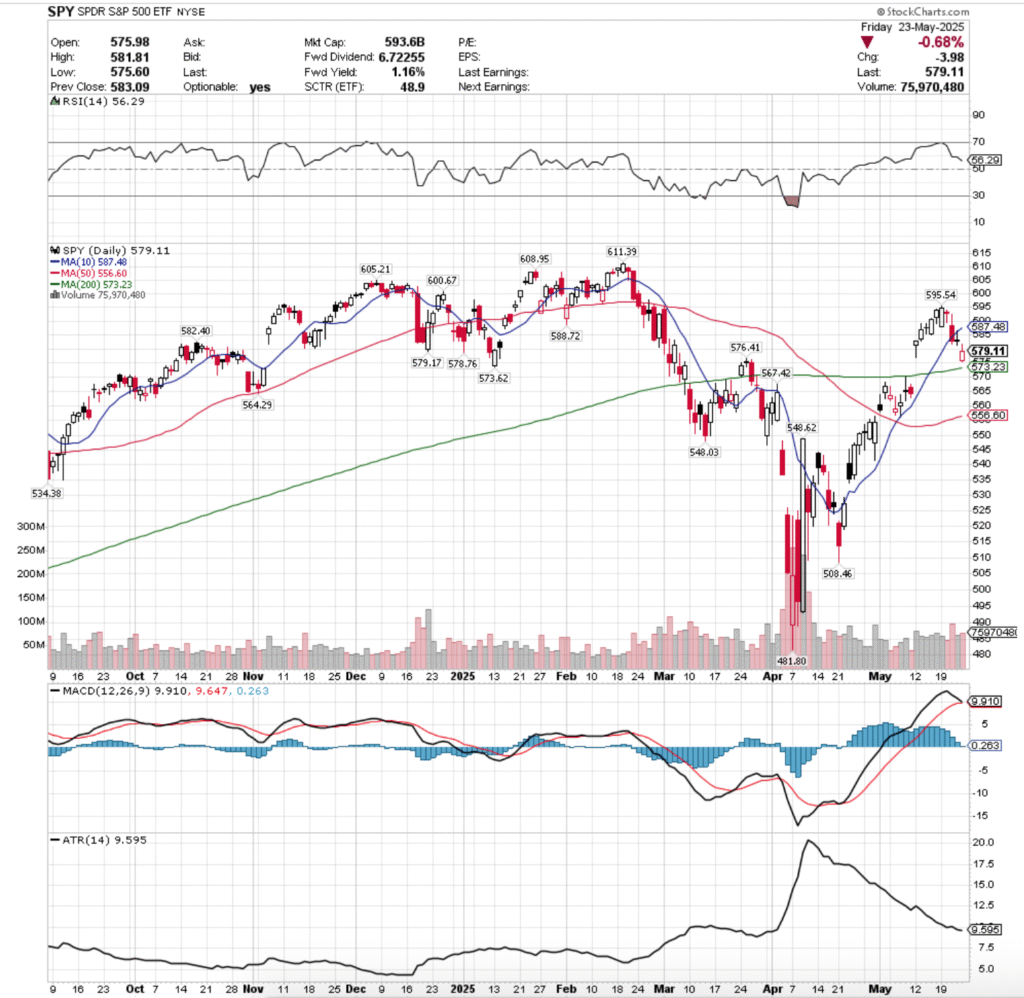
Their RSI is trending down towards the neutral 50 level & sits currently at 56.29, while their MACD is set to cross over bearishly on Tuesday or Wednesday of this coming week (barring any unusual jumps in price).
Volumes were +31.36% higher than the prior year’s average levels (74,174,000 vs. 56,466,920), which certainly does not inspire near-term confidence, especially heading into a shortened holiday week.
Monday saw SPY walk up to the edge of the diving board, as the week’s second lowest volume session formed a bullish engulfing pattern with the previous Friday’s session, but SPY’s oscillators had begun to show fatigue as we noted last week.
Tuesday is when the breakdown began, as the session opened & formed a dragonfly doji that also created a bearish harami with Monday’s candle on the lowest volume of the week.
While many analysts think of the dragonfly doji as indicating that there is a spike on the horizon & maybe a reversal occuring, the low volume paired with the lower shadow’s range set the stage for more pain throughout the week, particularly given SPY’s proximity to their 10 day moving average.
Wednesday confirmed this, when SPY opened on a gap down, attempted to retrace back towards its closing price level on Tuesday, only to on the highest volume of the week see market participants head towards the exits, and SPY declined -1.69% on the day, closing down by the support of their 10 DMA.
It is worth noting that the 10 DMA temporarily broke down during the session as well, as there was quite a bit of selling pressure surrounding SPY.
Thursday saw SPY opened below the resistance of the 10 day moving average, attempt a run up at it, but it was unable to break out above it & the session closed as a gravestone doji for a gain of +0.04% for the day.
Thursday’s lower shadow also signaled that there was slightly more appetite to the downside day-over-day, which while it was a small amount, isn’t something to be ignored.
Friday showed a risk-off into the holiday weekend theme, as the week’s second highest volume session opened on a gap down, managed to briefly break above Thursday’s low price, and wound up settling higher than it opened, but for a day-over-day loss of -0.68%.
The support of the 200 day moving average was not tested, but prices were trending more in that direction than higher by the end of the week.
Heading into the new week the upside will be contingent on the strength or weakness of the 10 day moving average’s resistance.
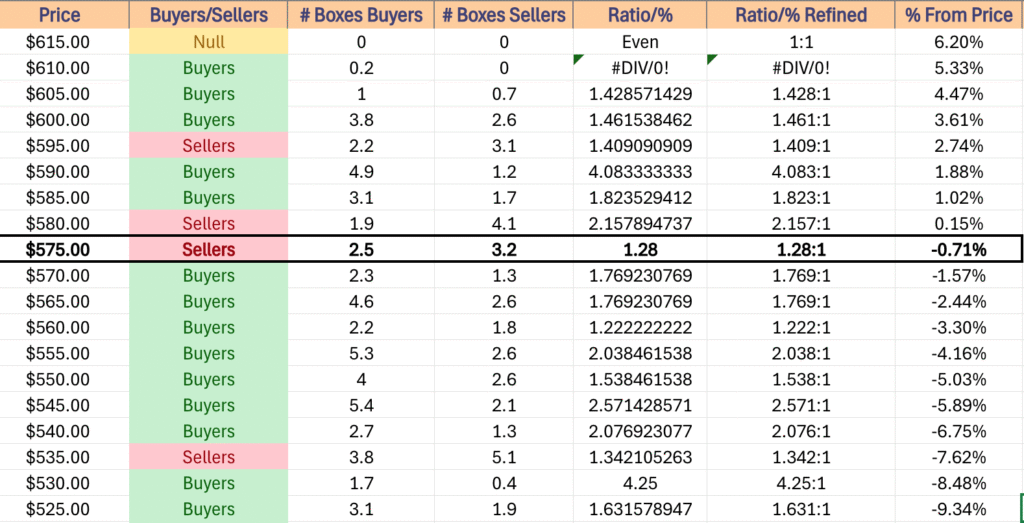
What will make this even more interesting to watch is that the current price zone that the 10 DMA is in is historically a Buyer dominated zone, but SPY must first travel through the Seller dominated zone in the middle to earn said re-test, which may wind up showing signs of Buyer-fatigue even in the even that prices make it to that level.
SPY will still need to show strong, consistent advancing volume in order to begin to appear like a base that can be built off of is forming for a reversal.
Should the 10 DMA dip into the Seller dominated zone just above Friday’s closing price it is unlikely that there will be a successful retest of the 10 DMA this week.
The consolidation case involves oscillating between the 200 & 10 day moving averages, while staying around the window created by the gap up open from two Monday’s ago while awaiting a catalyst to the upside or the downside.
There are still some highly anticipated earnings calls this week, including the likes of NVDIA & Salesforce, a slew of Federal Reserve speakers on tap for the week & we’ll get a read on inflation based on PCE data that comes out Friday.
Without any meaningful catalyst in either direction & without some strong volume the consolidation & “wait & see” heading into next week seems the most likely.
In the event of downside action, should the 200 day moving average’s support break down then we will likely see a drop below $570/share & since there are only two support touch-points in the $560’s price range all eyes will be looking towards the 50 day moving average’s support, which will be moving higher to greet SPY’s price.
Given that this week is a short one, unless there is a major catalyst to the upside or downside it seems most likely that things will remain relatively quiet, barring any extreme news or surprises.
SPY has support at the $578.76 (Volume Sentiment: Sellers, 1.28:1), $576.41 (Volume Sentiment: Sellers, 1.28:1), $573.62 (Volume Sentiment: Buyers, 1.77:1) & $573.23/share (200 Day Moving Average, Volume Sentiment: Buyers, 1.77:1) price levels, with resistance at the $579.17 (Volume Sentiment: Sellers, 1.28:1), $582.40 (Volume Sentiment: Sellers, 2.16:1), $587.48 (10 Day Moving Average, Volume Sentiment: Buyers, 1.82:1) & $588.72/share (Volume Sentiment: Buyers, 1.82:1).
QQQ, the Invesco QQQ Trust ETF dipped -2.35% last week, as the tech-heavy index managed to log the best performance of the four majors.
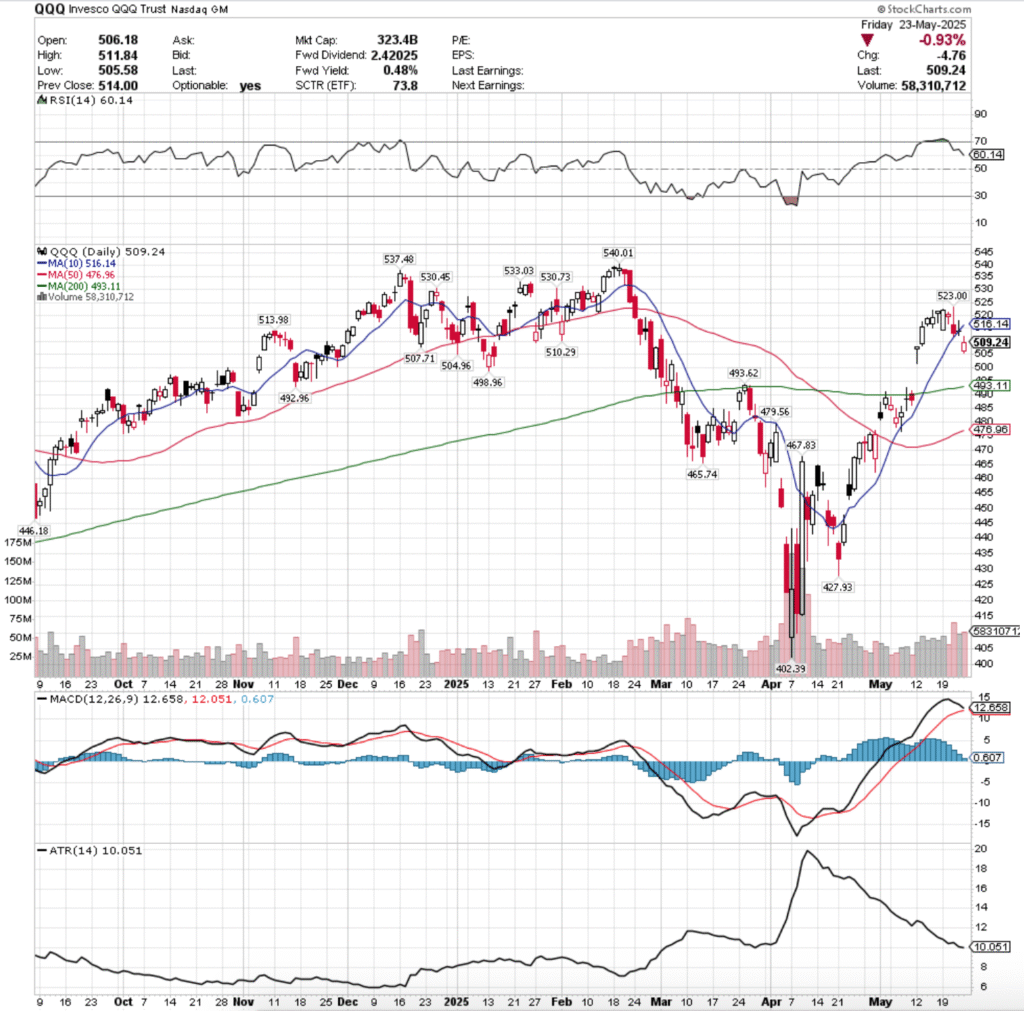
Their RSI dropped back below overbought levels last week & is currently trending lower at 60.14, while their MACD is set to crossover bearishly either Tuesday or Wednesday of this week following last week’s declines.
Volumes were +49.63% higher than the prior year’s average levels (56,066,000 vs. 37,470,0040), which while it shows that there was certainly a degree of profit taking during a week when all major index ETF’s declined, also shows that there is still a decent degree of hopes & optimism attached to Wednesday’s earnings calls for NVDA & Salesforce.
Monday opened the week up for QQQ in a similar manner to SPY, setting the stage for price to jump off of the diving board into the rest of the week.
Tuesday opened lower, tested to below the midway point of Monday’s session before recovering to close higher than it opened, but as a hanging man candle (bearish).
Tuesday also featured the week’s lowest volume, indicating that there was not much positive sentiment behind the day’s price action, even though it did manage to close above its opening price level.
Wednesday saw a shimmer of optimism, as despite a gap down open QQQ’s price was able to rally back to touch $523/share temporarily, but intraday profits were taken quickly, forcing QQQ to retreat & close in-line with the support of their 10 day moving average.
Thursday it was clear that market participants didn’t know which way was up, but they did know that they were only willing to go so much higher up from Wednesday’s close.
The session opened nearly in-line with Wednesday’s close & the 10 day moving average, attempted to rally higher, but was thwarted not much higher than Wednesday’s open, and the support of the 10 day moving average was temporarily broken through.
Friday this carried into the weekend, when the week’s second highest session by Volume opened on a gap lower, tested but managed to stay above the $505/share level, closing the day above its open at $509.24/share.
QQQ is in a similar boat to SPY (as they’ve been relatively similar for years), any upside movement is going to require some stable, strong advancing volume & some form of an upside catalyst, at which point all eyes will be on the 10 day moving average.
Without those conditions, at best any upside move will result in oscillations around the 10 day moving average while awaiting something to move the market.
The consolidation case features oscillations in between the 10 & 200 day moving averages while awaiting news to propel QQQ higher or to break down the 200 day moving average’s support.
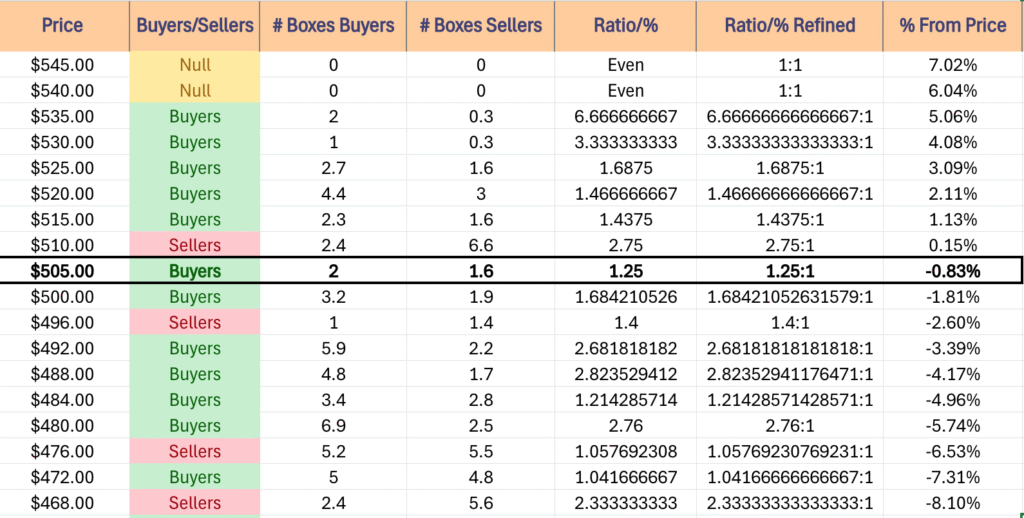
In the event of a move lower, the $496-499.99/share price level is Seller dominated over the past year, which would walk prices up with some momentum behind them to retest that 200 DMA.
The window formed at the end of April/early May would then become of interest, as it was never fully closed.
It would also then see the 50 day moving average’s support be tested, which is interesting given that said gap up occurred last time that QQQ’s price tested the 50 DMA.
The table below will be handy for navigating these re-tests.
QQQ has support at the $507.71 (Volume Sentiment: Buyers, 1.25:1), $504.96 (Volume Sentiment: Buyers, 1.68:1), $498.96 (Volume Sentiment: Sellers, 1.4:1) & $493.62/share (Volume Sentiment: Buyers, 2.68:1) price levels, with resistance at the $510.29 (Volume Sentiment: Sellers, 2.75:1), $513.98 (Volume Sentiment: Sellers, 2.75:1), $516.14 (10 Day Moving Average, Volume Sentiment: Buyers, 1.44:1) & $523/share (Volume Sentiment: Buyers, 1.47:1).
IWM, the iShares Russell 2000 ETF fell -3.47% last week, as market participants shunned the small cap index in favor of the other four major indexes.

Their RSI has flattened out just above the neutral 50 level & is currently at 52.21, while their MACD just crossed over bearishly late last week.
Volumes were -2.8% lower than the prior year’s average level (29,110,000 vs. 29,949,360), which indicates that there is certainly a bit of negative sentiment attached to the small cap index currently amidst market volatility.
Small cap names are not going to have an easy time recovering in the event that weakness is shown by SPY, QQQ or DIA in the next week or two, given how much uncertainty market participants are showing around those larger, more household names.
Monday the small cap index opened on a gap down, but managed to rally back to close above its open, but the session occurred on very weak volume.
Tuesday the uncertainty continued, when prices closed as a spinning top candle, indicating indecision on the weakest volume of the week (which only added to said sense of uncertainty).
Wednesday is when the damn gave way, opening on a gap down in-line with the 10 day moving average, briefly testing higher, but ultimately sliding back beneath the resistance of the 10 day moving average & declining -2.81% for the day.
Given the week’s highest volume occurred Wednesday, this should be taken as a sign of “everybody out of the pool” & that there is slipping levels of confidence in IWM.
The rest of the week IWM moved almost as though it was on stairs, opening Thursday on a gap down & closing the day as a spinning top, which indicates that there was indecision in the air, and lots of it given it occurred on the week’s second strongest volume.
This is especially true given the nature in how much profit taking (and loss cutting) was taking place intra-day when you look at the price levels that IWM was circling around all day.
Friday the week wound down on another gap down open to $199.78, but prices managed to find footing heading into the holiday weekend & closed at $202.56/share.
Heading into the fresh, shortened holiday week IWM has less upside potential of the index ETF’s listed so far, mostly as they have little to do with the major earnings calls of the week & the general uneasiness of market participants is not very telling of the strength of the small cap index.
However, in the event that a rising tide comes along to lift all boats, the 10 day moving average will be an interesting test for IWM, as even if they manage to break above it, they’ve got a Seller dominated zone right above it that seperates them from the long-term trend line.
IWM’s consolidation case revolves around price oscillating between the 10 & 50 day moving averages for the rest of the week, awaiting a nudge to the upside or downside.
The downside case involves a test of the 50 day moving average’s support, which is in a Buyer dominated price zone that falls just below a Seller zone.
If this does happen, all eyes should go to the windows that were created by gap up sessions on the bookends of April 2025, as those levels will likely be retested to formally close the window.
The table below is useful for assessing the strength/weakness of IWM’s support/resistance levels if they are approached again for re-tests.
IWM has support at the $202.46 (Volume Sentiment: Buyers, 1.23:1), $197.50 (50 Day Moving Average, Volume Sentiment: Buyers, 2.17:1), $196.56 (Volume Sentiment: Buyers, 2.17:1) & $192.11/share (Volume Sentiment: Buyers, 1.15:1) price levels, with resistance at the $206.83 (10 Day Moving Average, Volume Sentiment: Buyers, 1.16:1), $209.27 (Volume Sentiment: Buyers, 1.52:1), $210.13 Volume Sentiment: Buyers, 1.52:1) & $213.49/share (2 Touch-Points, Volume Sentiment: Sellers, 1.33:1).
DIA, the SPDR Dow Jones Industrial Average ETF lost -2.4% last week, as the blue chip index managed to continue to be a fan favorite among market participants & the “buy & hold” remained alive and well to a degree.
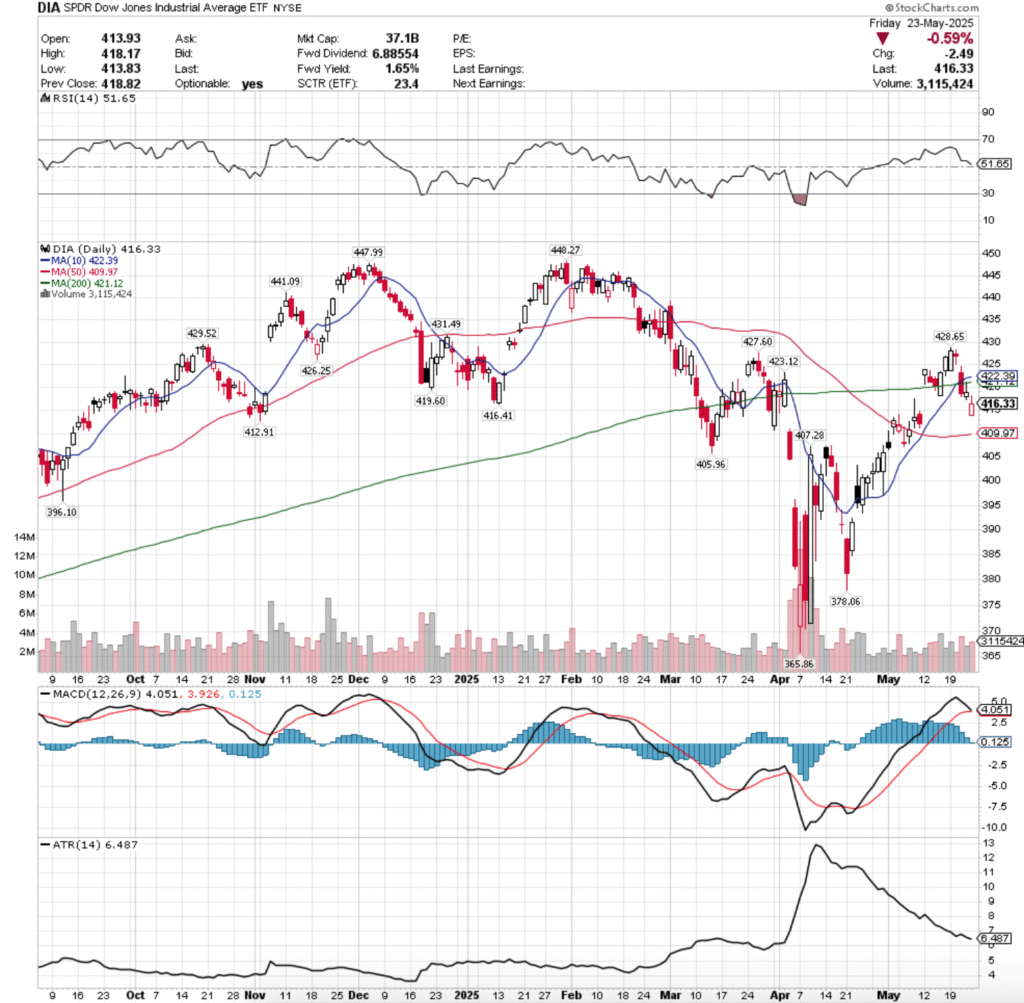
Their RSI is trending back down towards the neutral 50-level, sitting currently at 51.65, while their MACD is primed to cross over bearishly on Tuesday or Wednesday of this week.
Volumes were -9.06% lower than the previous year’s average though (2,894,000 vs. 3,182,400), showing that the “Buy & Hold” crowd is beginning to reassess their holdings & may be taking some profits down from the table.
Monday the week opened on a strong note for DIA, as it bravely walked up to the top of the diving board, ready to descend into the week.
Tuesday formed a bearish harami pattern with Monday’s candle and the day’s low signaled that the <$425/share level was on the menu in the coming days.
Wednesday the legs gave out for DIA, opening with a gap down that was able to below through the support of the 10 & 200 day moving averages & close -1.93% on the day on the highest volume of the week.
Thursday confirmed what the majority said with their sell buttons the previous day, when DIA was unable to break above the 200 DMA’s resistance & wound up resulting in a spinning top, indicating that there was a bit of indecision in the market, but that it should not be mistaken for optimism.
Friday showed another gap down open, but was able to rally higher & close at $416.33/share heading into the weekend.
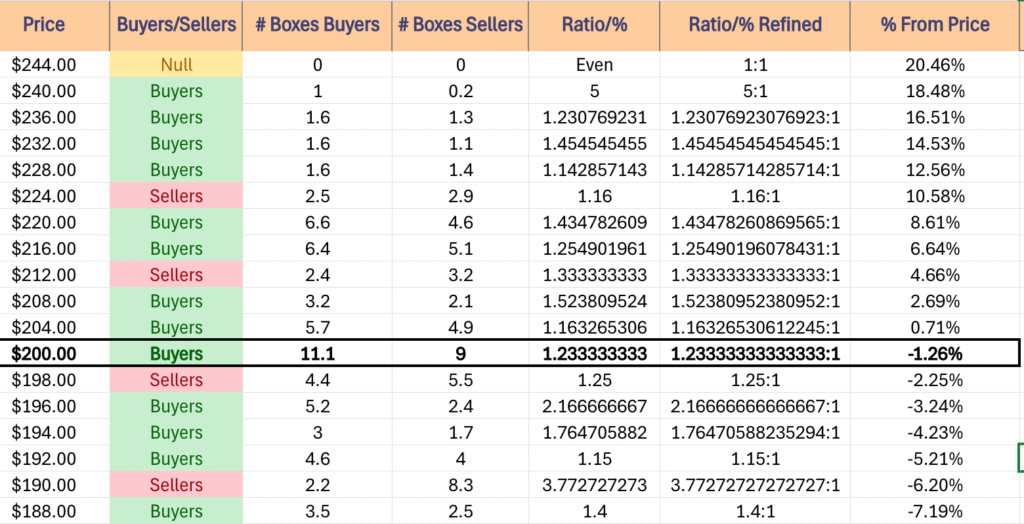
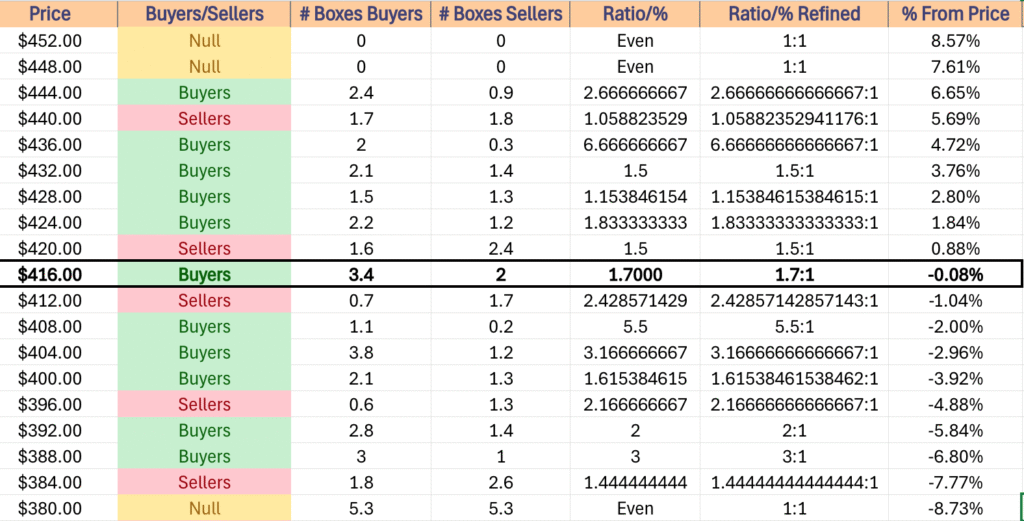
For DIA this week, the upside will require a breakthrough of the 10 & 200 day moving averages, which may prove difficult given that both reside in Seller dominated price levels.
In the event of consolidation while awaiting positive or negative news to dictate market direction, DIA is primed to oscillate between the 10/200 & 50 day moving averages while it closes the window that it created back earlier in May.
To the downside, in the event that the 50 DMA’s support breaks down, there is looking to be a bit of trouble for DIA, as that would leave only 5 support levels on their past year chart (one of which will be knocked off of it on next Monday’s session).
DIA has support at the $412.91 (Volume Sentiment: Sellers, 2.43:1), $409.97 (50 Day Moving Average, Volume Sentiment: Buyers, 5.5:1), $407.28 (Volume Sentiment: Buyers, 3.17:1) & $405.96/share (Volume Sentiment: Buyers, 3.17:1) price levels, with resistance at the $ 416.41(Volume Sentiment: Buyers, 1.7:1), $419.60 (Volume Sentiment: Buyers, 1.7:1), $421.12 (200 Day Moving Average, Volume Sentiment: Sellers, 1.5:1) & $422.39/share (10 Day Moving Average, Volume Sentiment: Sellers, 1.5:1).
The Week Ahead
Monday has no economic news or earnings reports as it is Memorial Day.
Fed President Kashkari speaks in Tokyo at 4 am on Tuesday, before Durable-Goods Orders & Du rable-Goods minus Transportation data at 8:30 am, S&P CoreLogic Case Shiller Home Price Index (20 cities) data at 9 am, Consumer Confidence data at 10 am & FEd President Williams speaking at 8 pm.
AutoZone, Bank of Nova Scotia & Skyline Champion all report earnings before Tuesday’s opening bell, followed by Box, Okta, Semtech & Sociedad Quimica y Minera after the session’s close.
Wednesday begins with Fed President Kashkari speaking at 4 am again, followed by May’s FOMC Minutes at 2 pm.
Abercrombie & Fitch, Bank of Montreal, Capri Holdings, Columbus McKinnon, Dick’s Sporting Goods, Kingsoft Cloud, Macy’s, Monro Muffler, Photronics & Phressia all report earnings before Wednesday’s session’s opening bell, before NVDIA, SalesForce, Agilent Technologies, C3.ai, e.l.f. Beauty, HP Inc., nCino, Nordson, Nutanix, Pure Storage, SentinelOne, Synopsys & Veeva Systems are due to report after the closing bell.
Initial Jobless Claims, GDP (First Revision) & Fed President Barkin speak at 8:30 am on Thursday, before Pending Home Sales at 10 am, Fed President Goolsbee speaking at 10:40 pm, Fed President Kugler Speaking at 2pm, Fed President Daly speaking at 4pm & Fed President Logan speaking at 8:25 pm.
Thursday morning’s earnings reports include American Woodmark, ATS Corp., Bath & Body Works, Best Buy, Burlington Stores, Caleres, CIBC, Foot Locker, Hamilton Lane, Hormel Foods, Kohl’s, Li Auto, Roivant Sciences, Royal Bank of Canada & SpartanNash, before Costco Wholesale, Ambarella, American Eagle, Cooper, Dell Technologies, Elastic, Gap, Marvell Technology, NetApp, PagerDuty, UiPath, Ulta Beauty & Zscaler all report following the closing bell.
Friday morning is a busy one, with Personal Income, Consumer Spending, PCE Index, PCE Year-over-Year, Core PCE Index, Core PCE YEar-over-Year, Advanced U.S. Trade Balance in Goods, Advanced Retail Inventories & Advanced Wholesale Inventories data at 8:30 am, followed by Chicago Business Barometer (PMI) data at 9:45 am, Consumer Sentiment (final) data at 10 am & Fed President Daly speaking at 4:45pm.
Shoe Carnival reports earnings after Friday afternoon’s closing bell.
See you back here next week!
*** I DO NOT OWN SHARES OR OPTIONS CONTRACT POSITIONS IN SPY, QQQ, IWM OR DIA AT THE TIME OF PUBLISHING THIS ARTICLE ***