XLP,the Consumer Staples Select Sector SPDR Fund ETF has advanced +6.18% over the past year, and is up +9.51% from its 52-week low set in April of 2025, while sitting just -2.05% below its 52-week high set in September of 2024 (per data from Investing.com, all figures are ex-distributions).
Some of their top holdings include Costco Wholesale Corp. (COST), Walmart Inc. (WMT), Proctor & Gamble Co. (PG), Phillip Morris International (PM), Coca Cola Co. (KO), Altria Group (MO), Mondelez International Inc. (MDLZ), Colgate Palmolive (CL), Pepsico Inc. (PEP) & Kimberly Clark Corp. (KMB).
While XLP is so close to it’s 52-week high it is a good time to check in on its historic volume sentiment from the past ~9 years to gain insight into how it may trade in any upcoming upside or downside re-tests, particularly around pivotal support/resistance levels.
Below is a brief technical analysis of XLP, as well as a price level:volume sentiment analysis of each of the price levels XLP has traded at over the past ~9 years.
Included in this data is also their recent support & resistance levels so that readers can gain insight into how strong/weak these support/resistance levels may be in the future, based on past market participant behavior.
It is not intended to serve as financial advice, but rather as an additional tool to reference while performing your own due diligence on XLP.
Technical Analysis Of XLP, The Consumer Staples Select Sector SPDR Fund ETF
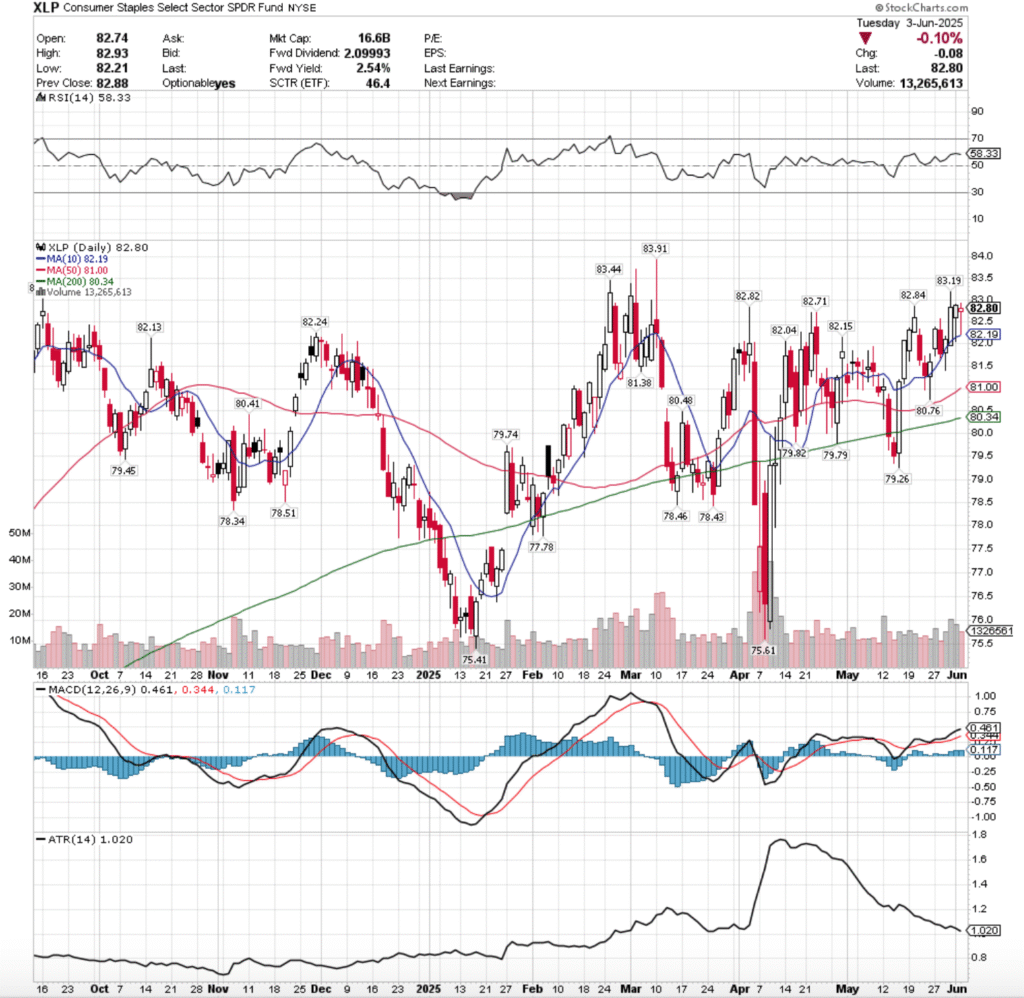
Their RSI is beginning to trend downward & currently sits at 58.33, while their MACD is bullish, but its histogram is flat, indicating that there is not a great deal of enthusiasm following their past week and a half.
Volumes have been +23.91% higher than the prior year’s average over the past week & a half (14,098,333.33 vs. 11,377,920), which is important to note asmost of it came on the past three sessions & went advance, advance, decline.
Last week began on a gap up session after the long holiday weekend, where Tuesday advanced +0.91%.
Wednesday opened lower, tested higher to break above the $82.50/share level temporarily, before declining down to the support of the 10 day moving average & closing the day for a loss just above the short-term trend line.
Wednesday had the weakest volume of all of the past week & a half, indicating that there is still “buy & hold” sentiment in the air for the Consumer Staples names, but that there is caution as well as the session hugged the 10 day moving average in the end.
Thursday opened slightly higher, showed that there was extreme downside appetite when the $81.50/share mark was temporarily broken through as short-term profits continued to be taken from Tuesday’s gap up, but Buyers came to the rescue & forced the close higher, forming a weak looking bullish harami pattern.
Friday saw the a major influx of both price & volume for XLP, as the session opened below the 10 DMA’s resistance, broke out above it on the highest volume since mid-May & touched a high price of $83.19/share, before closing up +0.88% for the day.
While the high volume was a sign in the right direction, the tall upper shadow on the day’s candle indicates that there was a solid deal of intraday profit taking taking place & that more could be on the horizon.
Opening this week, Monday featured a lower open, a decline that retested & temporarily broke through the support of the 10 day moving average, before a rally to close +0.06% higher day-over-day.
While the volume was similar to Friday’s (but slightly lower), the day’s lower shadow indicates that there is a severe amount of discomfort & hesitency among market participants at these high price levels.
Tuesday is when the real weakness began to be exposed though, as XLP opened lower, retraced down to re-test the support of the 10 day moving average, which held up before XLP rallied to close above its open, but there was a lot of profit taking & hints of fear beginning to emerge.
The amount of volume from the session also shows that there was strong sentiment to get out of the pool/take profits, which is a theme that is likely to continue in the near-term, particularly after today’s employment data & the upcoming FOMC Minutes.
XLP’s upside case isn’t much to write about, as they’re ~2% off of their all-time high, which would be the target price to be watching for in the near-term in terms of advances, before watching to see if there is an upside breakout.
In the event that there is, you’ll want to see high volume levels that are sustained for a bit of time before buying into anything long-term at these levels.
The consolidation case has been made recently by daily lows & lower shadows, as they all seem to revert back to the 10 day moving average (short-term trendline), which would mean that any consolidation would likely oscillate around the 10 DMA until we see an upside or downside catalyst.
To the downside, there is a healthy amount of support touchpoints into the $82-82.99/share zone, however, should they break down, the $81-81.99/share price zone is Seller dominated historically over near the past decade, which will likely mean that we will see some selling pressure should prices dip to those levels.
The $80-80.99/share price level is also Seller dominated, with the $79-79.99/share zone being a Buyer zone historically, before more Seller zones emerge.
Should the 200 day moving average break down, more than likely the $79/share level breaks down, exposing XLP to a great deal of Seller pressure.
While the names covered in this ETF are Consumer Staples, it does not make the downside scenario above impossible.
The section below outlines the volume sentiment at each price level XLP has traded at over the past ~9 years & can be used to assess the strength/weakness of the support/resistance levels & price levels that XLP retests in the coming weeks.
This can aid in understanding how market participants may behave again at each level.
Price Level:Volume Sentiment Analysis For XLP, The Consumer Staples Select Sector SPDR Fund ETF
The top table below shows the support & resistance levels of XLP from the past year’s chart, as well as their price level:volume sentiment at each from data covering the past ~9 years, using Tuesday 5/3/2025’s closing data for their price & moving averages/other technicals.
The 10, 50 & 200 day moving averages are denoted with bold.
The next tables show the volume sentiment at each individual price level XLP has traded at over the past ~9 years.
Beneath them is a copy & pasteable list of the same data, where the support/resistance levels are denoted in bold.
All ratios with “0” in the denominator are denoted with a “*”.
NULL values are price levels that had limited trading volume, whether it be due to gaps, quick advances or they are at price extremes; in the event that they are retested & there is more data they would have a distinct “Buyers”, “Sellers” or “Even” title.
This is not intended as financial advice, but rather another tool to consider when performing your own research & due diligence on XLP.
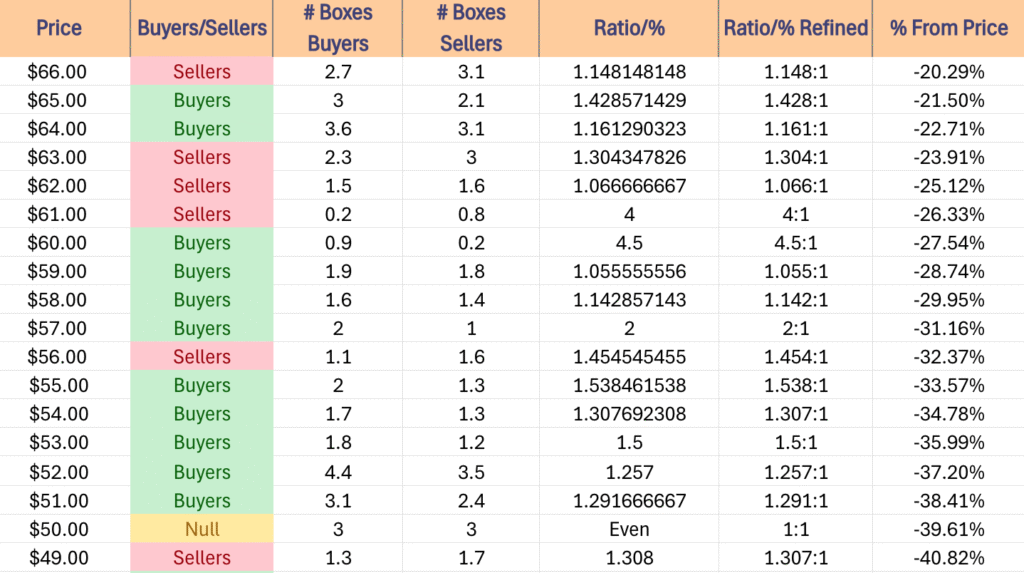
The following section lays out XLP’s one year support/resistance levels, as well as their Buyer:Seller (Seller:Buyer) ratios at each price level that they’ve traded at over the past ~9 years, which can be used as a barometer for estimating the expected strength/weakness of each of the support/resistance levels.

$84 – NULL – 0:0*, +1.45% From Current Price Level
$83 – Buyers – 0.3:0*, +0.24% From Current Price Level
$82 – Buyers – 2.5:1, -0.97% From Current Price Level – Current Price & 10 Day Moving Average**
$81 – Sellers – 1.3:1, -2.17% From Current Price Level – 50 Day Moving Average*
$80 – Sellers – 1.25:1, -3.38% From Current Price Level – 200 Day Moving Average*
$79 – Buyers – 2.38:1, -4.59% From Current Price Level
$78 – Sellers – 2.33:1, -5.8% From Current Price Level
$77 – Buyers – 1.67:1, -7% From Current Price Level
$76 – Sellers – 1.18:1, -8.21% From Current Price Level
$75 – Sellers – 1.33:1, -9.42% From Current Price Level
$74 – Buyers – 1.5:1, -10.63% From Current Price Level
$73 – Buyers – 1.43:1, -11.84% From Current Price Level
$72 – Buyers – 1.25:1, -13.04% From Current Price Level
$71 – Buyers – 1.32:1, -14.25% From Current Price Level
$70 – Sellers – 1.14:1, -15.46% From Current Price Level
$69 – Buyers – 1.18:1, -16.67% From Current Price Level
$68 – Buyers – 1.04:1, -17.87% From Current Price Level
$67 – Sellers – 1.07:1, -19.08% From Current Price Level
$66 – Sellers – 1.15:1, -20.29% From Current Price Level
$65 – Buyers – 1.43:1, -21.5% From Current Price Level
$64 – Buyers – 1.16:1, -22.71% From Current Price Level
$63 – Sellers – 1.3:1, -23.91% From Current Price Level
$62 – Sellers – 1.07:1, -25.12% From Current Price Level
$61 – Sellers – 4:1, -26.33% From Current Price Level
$60 – Buyers – 4.5:1, -27.54% From Current Price Level
$59 – Buyers – 1.06:1, -28.74% From Current Price Level
$58 – Buyers – 1.14:1, -29.95% From Current Price Level
$57 – Buyers – 2:1, -31.16% From Current Price Level
$56 – Sellers – 1.46:1, -32.37% From Current Price Level
$55 – Buyers – 1.54:1, -33.57% From Current Price Level
$54 – Buyers – 1.31:1, -34.78% From Current Price Level
$53 – Buyers – 1.5:1, -35.99% From Current Price Level
$52 – Buyers – 1.26:1, -37.2% From Current Price Level
$51 – Buyers – 1.29:1, -38.41% From Current Price Level
$50 – Even – 1:1, -39.61% From Current Price Level
$49 – Sellers – 1.31:1, -40.82% From Current Price Level
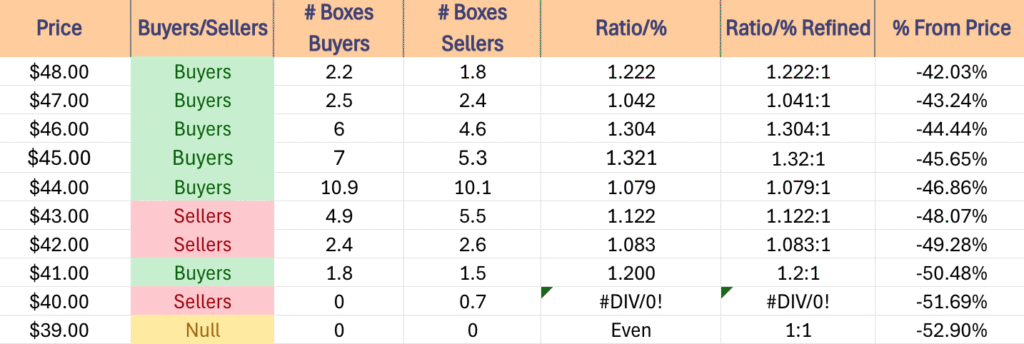
$48 – Buyers – 1.22:1, -42.03% From Current Price Level
$47 – Buyers – 1.04:1, -43.24% From Current Price Level
$46 – Buyers – 1.3:1, -44.44% From Current Price Level
$45 – Buyers – 1.32:1, -45.65% From Current Price Level
$44 – Buyers – 1.08:1, -46.86% From Current Price Level
$43 – Sellers – 1.12:1, -48.07% From Current Price Level
$42 – Sellers – 1.08:1, -49.28% From Current Price Level
$41 – Buyers – 1.2:1, -50.48% From Current Price Level
$40 – Sellers – 0.7:0*, -51.69% From Current Price Level
$39 – NULL – 0:0*, -52.9% From Current Price Level
*** I DO NOT OWN SHARES OR OPTIONS CONTRACT POSITIONS IN XLP AT THE TIME OF PUBLISHING THIS ARTICLE ***