Since our last Volume Sentiment Analysis major indexes have continued higher, with SPY & QQQ hitting new all-time highs, DIA approaching their all-time high & IWM has been battling to stay above its 200 day moving average this week.
Last night the VIX closed at 16.83, indicating an implied one day move of +/-1.06% & an implied one month move of +/-4.86% for the S&P 500, which appears oddly tame for a market whose primary gains came in the wake of a gap up on June 24.
Since that gap up there has been consistent upwards pressure, with SPY closing outside of its upper Bollinger Band almost every one of the past seven sessions, which is cause for concern & reason to view the situation as being overheated.
While volumes have been elevated (see last week’s market review note) compared to the year prior, the aforementioned gap up & the one from May 12, 2025 remain unfilled, mostly based on hope & optimism, but not on much in terms of actual facts.
Tariffs & foreign relations are still not entirely resolved & there are still companies announcing massive layoffs (MSFT announced 9,000 today), making these gains look more like the result of hopium than much else of substance.
This calls for a review of the volume sentiment at the price levels each of the major index ETFs have traded at in recent history to gain insight into how market participants have felt at each of these price levels.
This way, in the event of a retest there is some insight into how market participants may behave again.
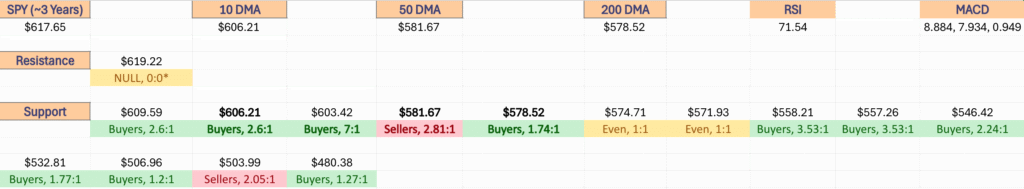
Each section below contains a view of each index ETF’s chart (for a technical breakdown of each’s chart, see the link above for last week’s note), as well as a list of their current one year support & resistance levels with the volume sentiment noted beneath it on the table.
There is an additional table beneath this table with each price level’s sentiment, as well as a typed text version below that is able to be copied & pasted.
Note that “NULL, 0:0*” values denote areas that each name has traded at but with limited volume data to work with from a comparison standpoint in terms of creating a ratio of buyers:sellers (or vice versa) or is the outlier above the highest/lowest level with price data.
Also, prices that do have a ratio of Buyers:Sellers (Sellers:Buyers) where the denominator is 0 are denoted with an asterisk “*” as well.
In the written lists of the price levels & volume sentiments the price levels that contain support & resistance levels are marked in BOLD.
Recall that at price extremes such as the highs that we have recently hit there will tend to be skewed data due to the small sample size & factor that into how you interpret each price level’s reported sentiment.
This is intended to serve as an additional tool, similar to a barometer to use during your due diligence process & is not meant to replace doing your own research & is not financial advice.
Price Level:Volume Sentiment Analysis For SPY, The SPDR S&P 500 ETF
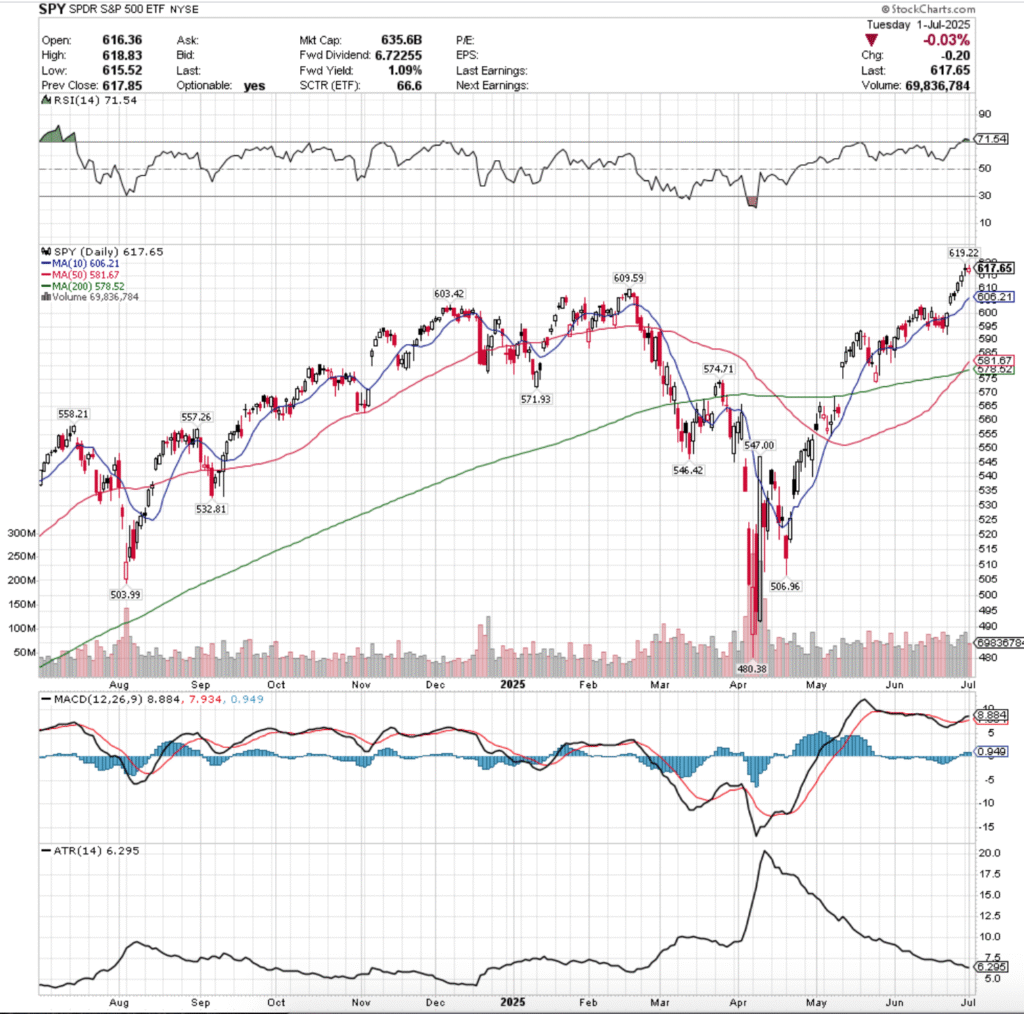
SPY, the SPDR S&P 500 ETF has pushed another all-time high today, two days before the July 4th holiday.
Given the speculative nature of the advances it is worth reviewing SPY’s support & resistance levels below, along with their historic Buyer:Seller (Seller:Buyer) ratio in order to aid in assessing how strong each is.
This is particularly important now as we approach the month of August, which historically is volatile for broader markets.
For a deeper dive into SPY’s near-term horizon take a look at the link above to this past week’s market review post.
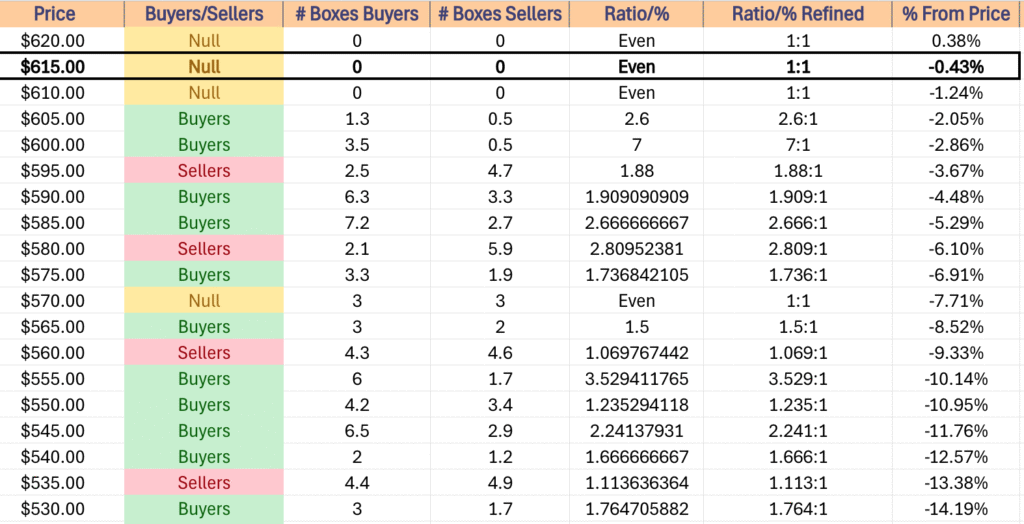
$620 – NULL – 0:0*, +0.38% From Current Price Level
$615 – NULL – 0:0*, -0.43% From Current Price Level – Current Price Level*
$610 – NULL – 0:0*, -1.24% From Current Price Level
$605 – Buyers – 2.6:1, -2.05% From Current Price Level – 10 Day Moving Average*
$600 – Buyers – 7:1, -2.86% From Current Price Level
$595 – Sellers – 1.88:1, -3.67% From Current Price Level
$590 – Buyers – 1.91:1, -4.48% From Current Price Level
$585 – Buyers – 2.67:1, -5.29% From Current Price Level
$580 – Sellers – 2.81:1, -6.1% From Current Price Level – 50 Day Moving Average*
$575 – Buyers – 1.74:1, -6.91% From Current Price Level – 200 Day Moving Average*
$570 – Even – 1:1, -7.71% From Current Price Level
$565 – Buyers – 1.5:1, -8.52% From Current Price Level
$560 – Sellers – 1.07:1, -9.33% From Current Price Level
$555 – Buyers – 3.53:1, -10.14% From Current Price Level
$550 – Buyers – 1.24:1, -10.95% From Current Price Level
$545 – Buyers – 2.24:1, -11.76% From Current Price Level
$540 – Buyers – 1.67:1, -12.57% From Current Price Level
$535 – Sellers – 1.11:1, -13.38% From Current Price Level
$530 – Buyers – 1.77:1, -14.19% From Current Price Level
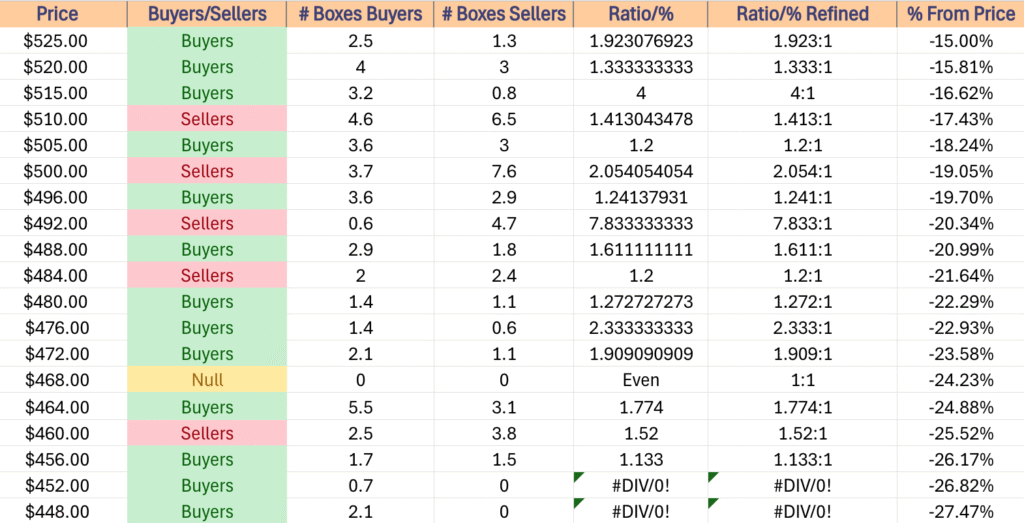
$525 – Buyers – 1.92:1, -15% From Current Price Level
$520 – Buyers – 1.33:1 -15.81% From Current Price Level
$515 – Buyers – 4:1, -16.62% From Current Price Level
$510 – Sellers – 1.41:1, -17.43% From Current Price Level
$505 – Buyers – 1.2:1, -18.24% From Current Price Level
$500 – Sellers – 2.05:1, -19.05% From Current Price Level
$496 – Buyers – 1.24:1, -19.7% From Current Price Level
$492 – Sellers – 7.83:1, -20.34% From Current Price Level
$488 – Buyers – 1.61:1, -20.99% From Current Price Level
$484 – Sellers – 1.2:1, -21.64% From Current Price Level
$480 – Buyers – 1.27:1, -22.29% From Current Price Level
$476 – Buyers – 2.33:1, -22.93% From Current Price Level
$472 – Buyers – 1.91:1, -23.58% From Current Price Level
$468 – Even – 1:1, -24.23% From Current Price Level
$464 – Buyers – 1.77:1, -24.88% From Current Price Level
$460 – Sellers – 1.52:1, -25.52% From Current Price Level
$456 – Buyers – 1.13:1, -26.17% From Current Price Level
$452 – Buyers – 0.7:0*, -26.82% From Current Price Level
$448 – Buyers – 2.1:0*, -27.47% From Current Price Level
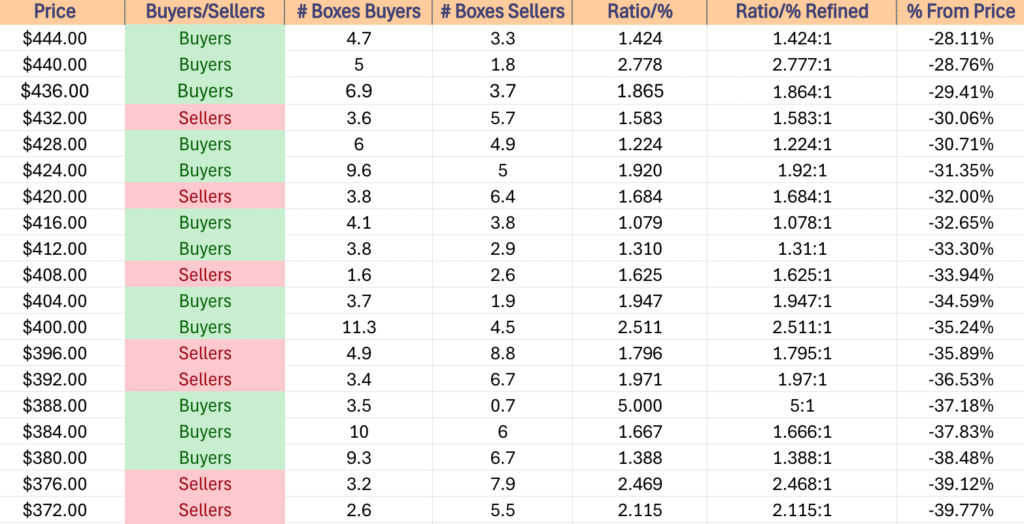
$444 – Buyers – 1.42:1, -28.11% From Current Price Level
$440 – Buyers – 2.78:1, -28.76% From Current Price Level
$436 – Buyers – 1.86:1, -29.41% From Current Price Level
$432 – Sellers – 1.58:1, -30.06% From Current Price Level
$428 – Buyers – 1.22:1, -30.71% From Current Price Level
$424 – Buyers – 1.92:1, -31.35% From Current Price Level
$420 – Sellers – 1.68:1, -32% From Current Price Level
$416 – Buyers – 1.08:1, -32.65% From Current Price Level
$412 – Buyers – 1.31:1, -33.3% From Current Price Level
$408 – Sellers – 1.63:1, -33.94% From Current Price Level
$404 – Buyers – 1.95:1, -34.59% From Current Price Level
$400 – Buyers – 2.51:1, -35.24% From Current Price Level
$396 – Sellers – 1.8:1, -35.89% From Current Price Level
$392 – Sellers – 1.97:1, -36.53% From Current Price Level
$388 – Buyers – 5:1, -37.18% From Current Price Level
$384 – Buyers – 1.67:1, -37.83% From Current Price Level
$380 – Buyers – 1.39:1, -38.48% From Current Price Level
$376 – Sellers – 2.47:1, -39.12% From Current Price Level
$372 – Sellers – 2.12:1, -39.77% From Current Price Level
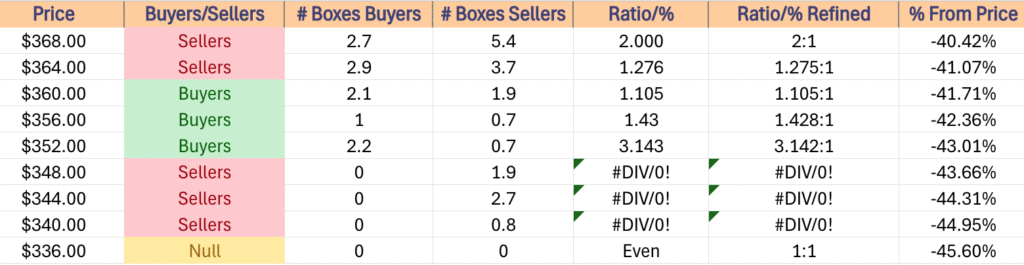
$368 – Sellers – 2:1, -40.42% From Current Price Level
$364 – Sellers – 1.28:1, -41.07% From Current Price Level
$360 – Buyers – 1.11:1, -41.71% From Current Price Level
$356 – Buyers – 1.43:1, -42.36% From Current Price Level
$352 – Buyers – 3.14:1, -43.01% From Current Price Level
$348 – Sellers – 1.9:0*, -43.66% From Current Price Level
$344 – Sellers – 2.7:0*, -44.31% From Current Price Level
$340 – Sellers – 0.8:0*, -44.95% From Current Price Level
$336 – NULL – 0:0*, -45.6% From Current Price Level
Price Level:Volume Sentiment For QQQ, The Invesco QQQ Trust
QQQ, the Invesco QQQ Trust ETF has just bounced down off of a new all-time high, but still remains moving in sync with SPY to a degree.
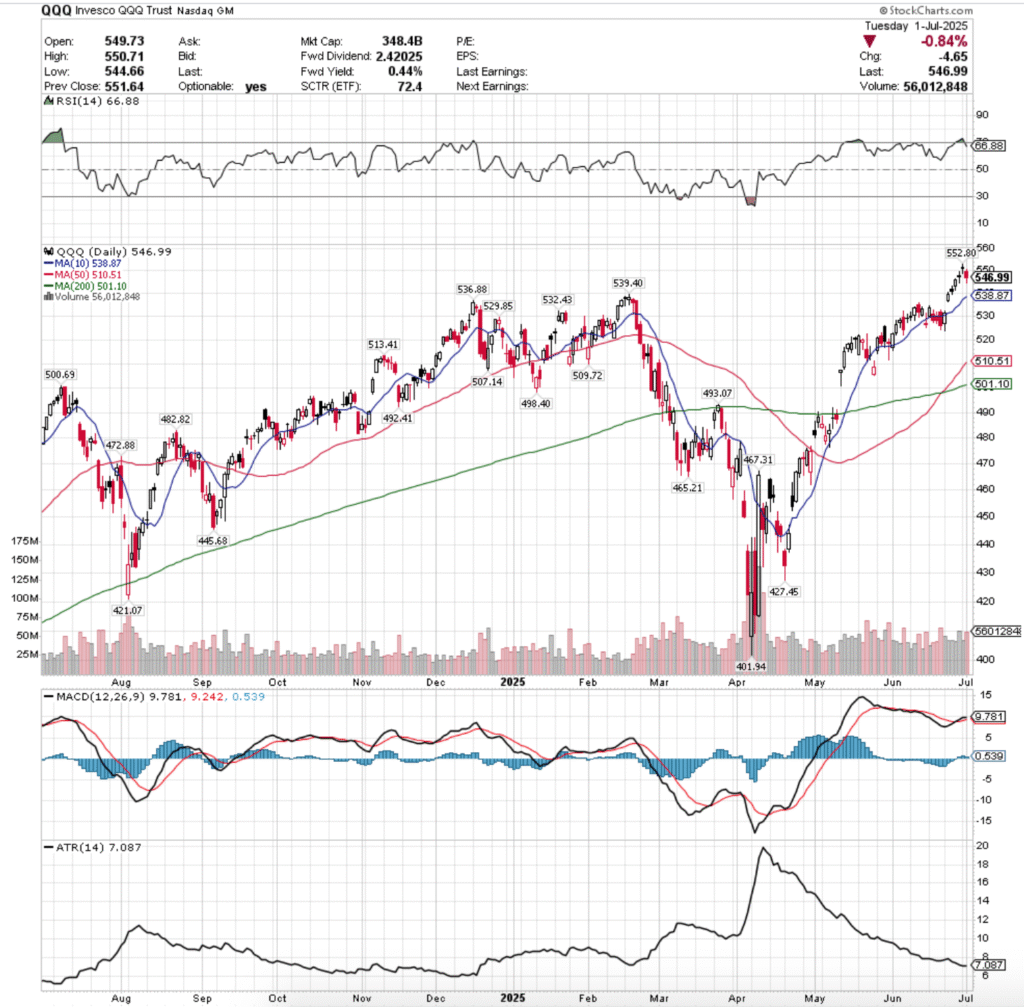
They’ve also seen an uptick in volume recently, however much of that is in response to recent earnings calls & continued AI speculation.
The data below can help map out how to navigate any potential corrections in the near-to-mid term for QQQ in terms of viewing how market participants have behaved historically.
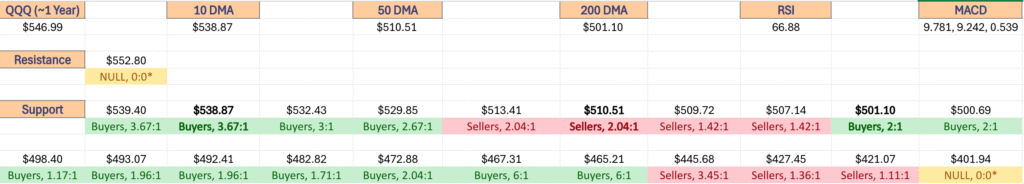
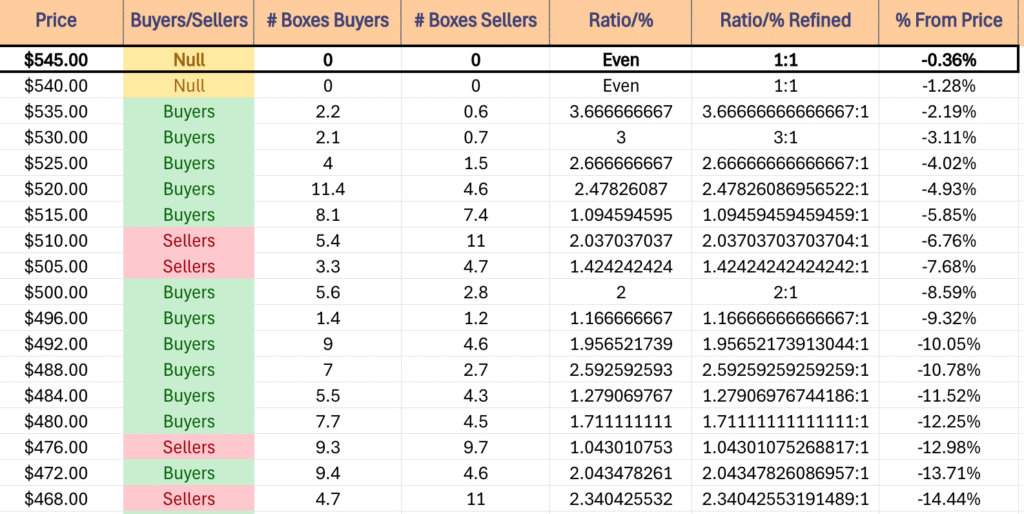
$545 – NULL – 0:0*, -0.36% From Current Price Level – Current Price Level*
$540 – NULL – 0:0*, -1.28% From Current Price Level
$535 – Buyers – 3.67:1, -2.19% From Current Price Level – 10 Day Moving Average*
$530 – Buyers – 3:1, -3.11% From Current Price Level
$525 – Buyers – 2.67:1, -4.02% From Current Price Level
$520 – Buyers – 2.48:1, -4.93% From Current Price Level
$515 – Buyers – 1.1:1, -5.85% From Current Price Level
$510 – Sellers – 2.04:1, -6.76% From Current Price Level – 50 Day Moving Average*
$505 – Sellers – 1.42:1, -7.68% From Current Price Level
$500 – Buyers – 2:1, -8.59% From Current Price Level – 200 Day Moving Average*
$496 – Buyers – 1.17:1, -9.32% From Current Price Level
$492 – Buyers – 1.96:1, -10.05% From Current Price Level
$488 – Buyers – 2.59:1, -10.78% From Current Price Level
$484 – Buyers – 1.28:1, -11.52% From Current Price Level
$480 – Buyers – 1.71:1, -12.25% From Current Price Level
$476 – Sellers – 1.04:1, -12.98% From Current Price Level
$472 – Buyers – 2.04:1, -13.71% From Current Price Level
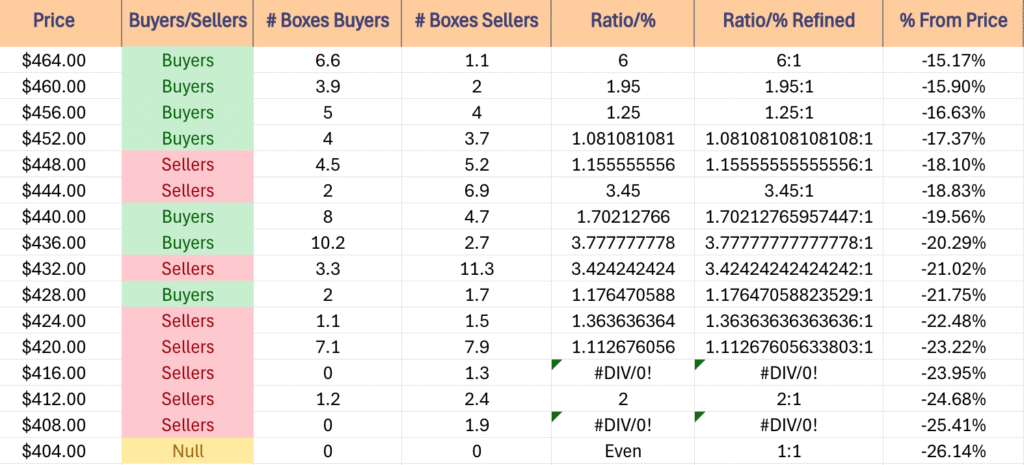
$468 – Sellers – 2.34:1, -14.44% From Current Price Level
$464 – Buyers – 6:1, -15.17% From Current Price Level
$460 – Buyers – 1.95:1, -15.9% From Current Price Level
$456 – Buyers – 1.25:1, -16.63% From Current Price Level
$452 – Buyers – 1.08:1, -17.37% From Current Price Level
$448 – Sellers – 1.16:1, -18.1% From Current Price Level
$444 – Sellers – 3.45:1, -18.83% From Current Price Level
$440 – Buyers – 1.7:1, -19.56% From Current Price Level
$436 – Buyers – 3.78:1, -20.29% From Current Price Level
$432 – Sellers – 3.42:1, -21.02% From Current Price Level
$428 – Buyers – 1.18:1, -21.75% From Current Price Level
$424 – Sellers – 1.36:1, -22.48% From Current Price Level
$420 – Sellers – 1.11:1, -23.22% From Current Price Level
$416 – Sellers – 1.3:0*, -23.95% From Current Price Level
$412 – Sellers – 2:1, -24.68% From Current Price Level
$408 – Sellers – 1.9:0*, -25.41% From Current Price Level
$404 – NULL – 0:0*, -26.14% From Current Price Level
Price Level:Volume Sentiment Analysis For IWM, The iShares Russell 2000 ETF
IWM, the iShares Russell 2000 ETF is having the strongest day of the four major index ETFs & is struggling to remain above its long-term trendline after months of performing below it.
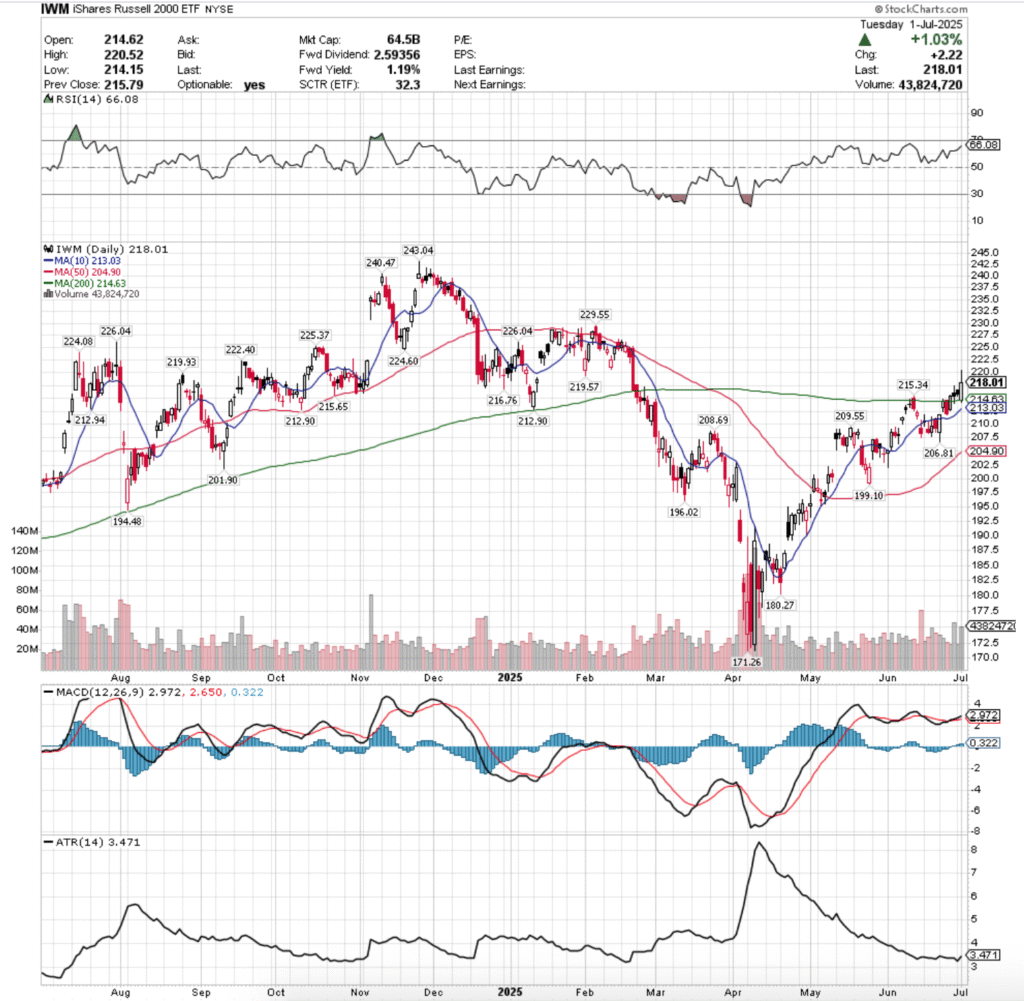
Its volume has not been as strong as the other three majors recently, signaling that there is still uncertainty & market participants are not flocking into small-cap names.
There is also an interesting amount of Seller sentiment both in its support & resistance levels which is worth examining on the table below.
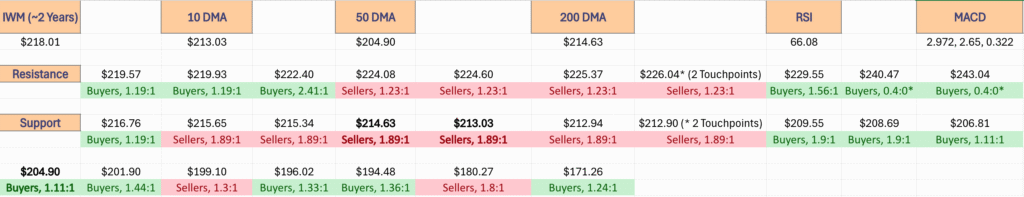
$244 – NULL – 0:0*, +11.92% From Current Price Level
$240 – Buyers – 0.4:0*, +10.09% From Current Price Level
$236 – Buyers – 1.9:0*, +8.25% From Current Price Level
$232 – Buyers – 1.18:1, +6.42% From Current Price Level
$228 – Buyers – 1.56:1, +4.58% From Current Price Level
$224 – Sellers – 1.23:1, +2.75% From Current Price Level
$220 – Buyers – 2.41:1, +0.91% From Current Price Level
$216 – Buyers – 1.19:1, -0.92% From Current Price Level – Current Price Level*
$212 – Sellers – 1.89:1, -2.76% From Current Price Level – 10 & 200 Day Moving Average**
$208 – Buyers – 1.9:1, -4.59% From Current Price Level
$204 – Buyers – 1.11:1, -6.43% From Current Price Level – 50 Day Moving Average*
$200 – Buyers – 1.44:1, -8.26% From Current Price Level
$198 – Sellers – 1.3:1, -9.18% From Current Price Level
$196 – Buyers – 1.33:1, -10.1% From Current Price Level
$194 – Buyers – 1.36:1, -11.01% From Current Price Level
$192 – Buyers – 1.24:1, -11.93% From Current Price Level
$190 – Sellers – 2.7:1, -12.85% From Current Price Level
$188 – Buyers – 1.19:1, -13.77% From Current Price Level
$186 – Buyers – 1.42:1, -14.68% From Current Price Level
$184 – Buyers – 1.83:1, -15.6% From Current Price Level
$182 – Buyers – 3.36:1, -16.52% From Current Price Level
$180 – Sellers – 1.8:1, -17.43% From Current Price Level
$178 – Sellers – 2.2:1, -18.35% From Current Price Level
$176 – Buyers – 1.27:1, -19.27% From Current Price Level
$174 – Buyers – 1.68:1, -20.19% From Current Price Level
$172 – Buyers – 1.18:1, -21.1% From Current Price Level
$170 – Buyers – 1.24:1, -22.02% From Current Price Level
$168 – Sellers – 1.39:1, -22.94% From Current Price Level
$166 – Sellers – 1.27:1, -23.86% From Current Price Level
$164 – Sellers – 1.78:1, -24.77% From Current Price Level
$162 – Even – 1:1, -25.69% From Current Price Level
$160 – Sellers – 1.07:1, -26.61% From Current Price Level
$158 – NULL – 0:0*, -27.53% From Current Price Level
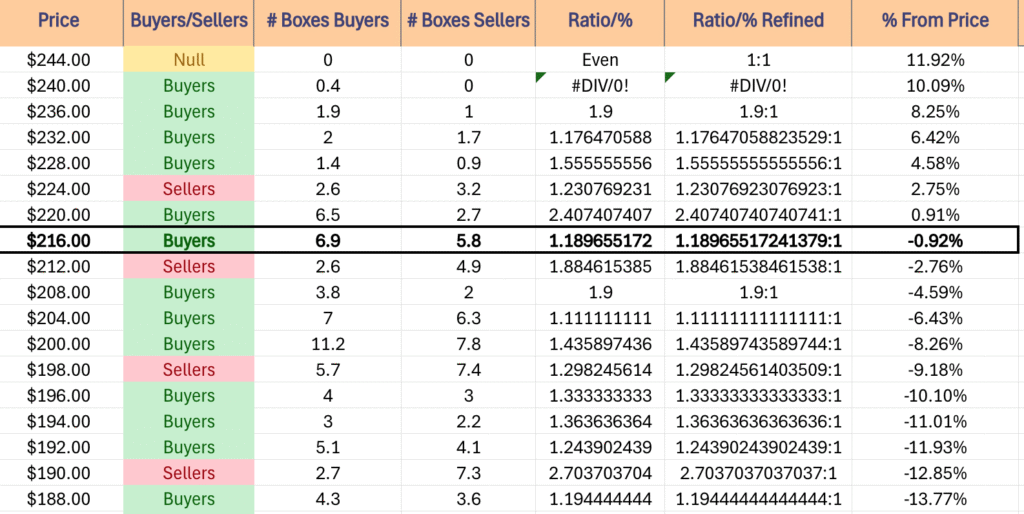
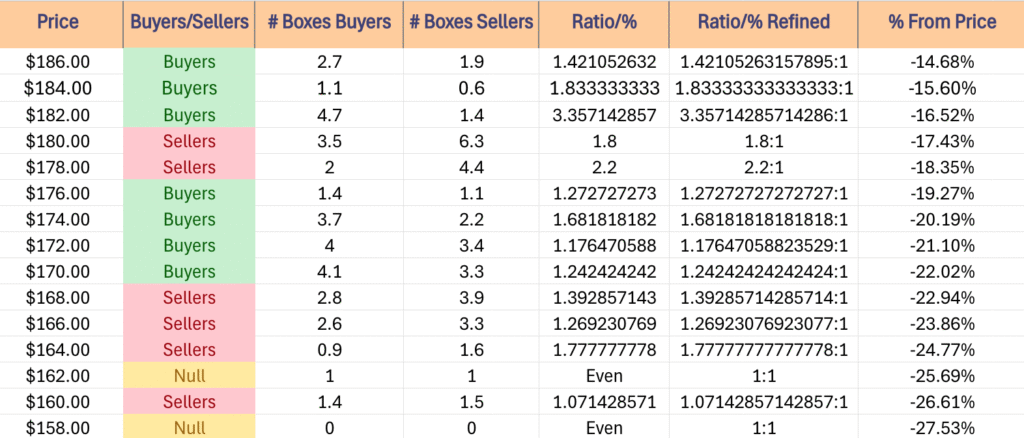
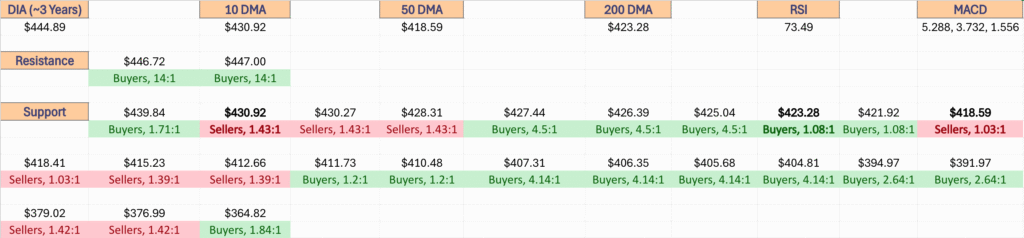
Price Level:Volume Sentiment Analysis For DIA, The SPDR Dow Jones Industrial Average ETF
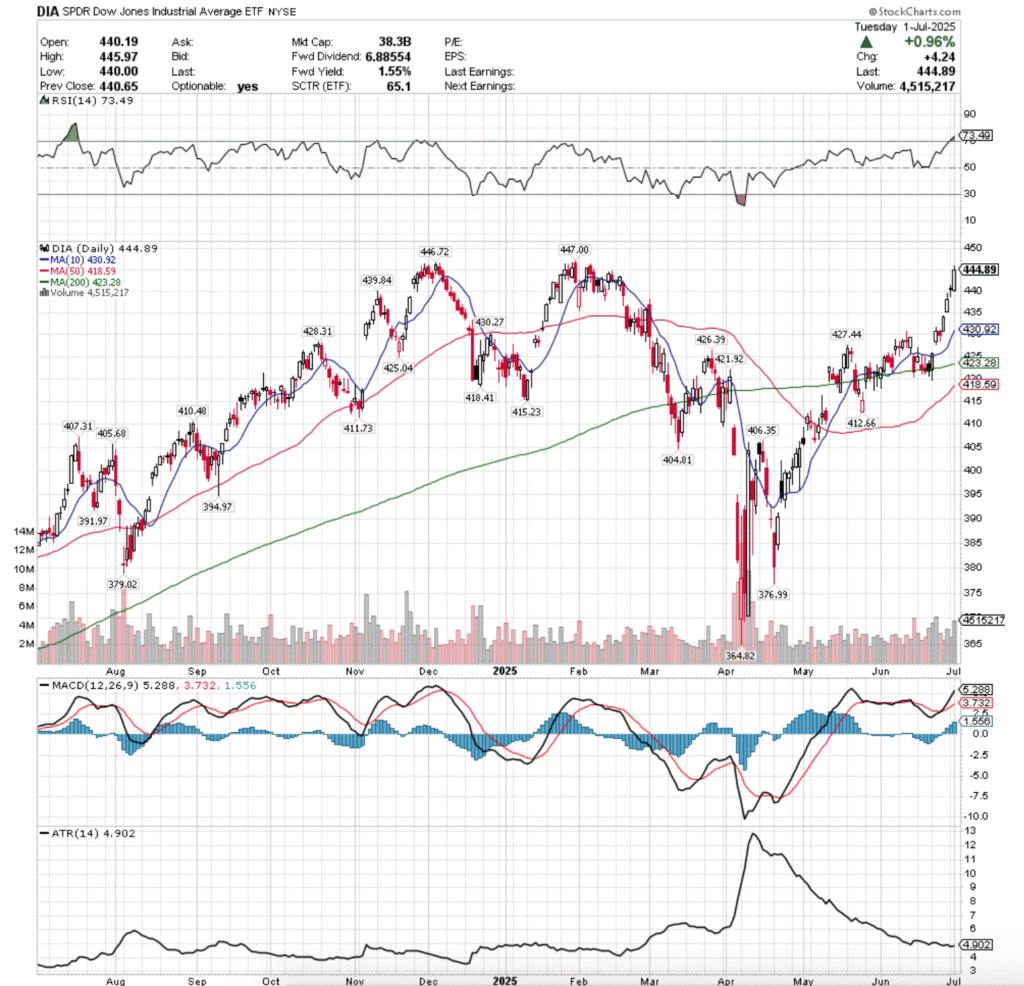
DIA, the SPDR Dow Jones Industrial Average ETF has continued to climb in recent weeks as market participants flock to & hold the blue chip stocks.
Nearing its all-time high, the support sentiment below is now something that is worth examining when profits are taken off of the table in the near-term.
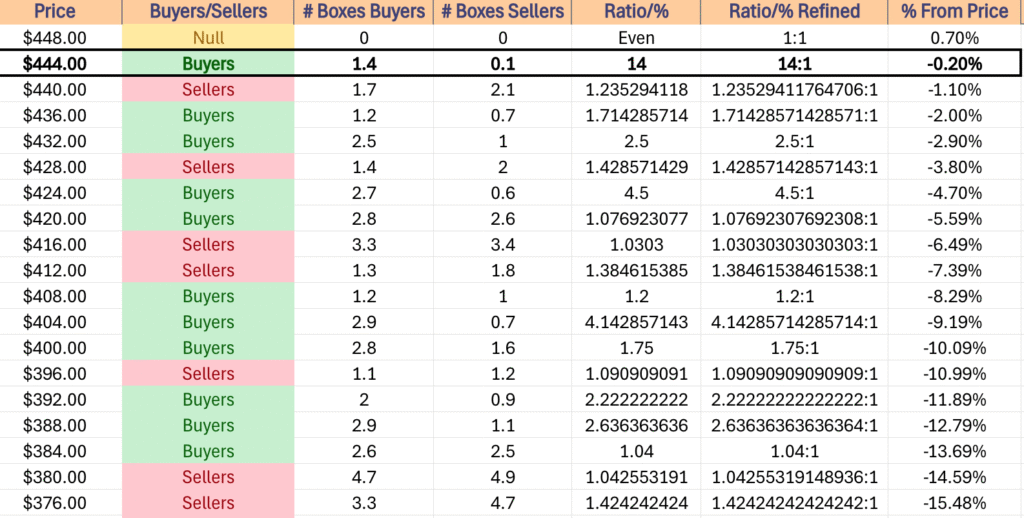

$448 – NULL – 0:0*, +0.7% From Current Price Level
$444 – Buyers – 14:1, -0.2% From Current Price Level
$440 – Sellers – 1.24:1, -1.1% From Current Price Level – Current Price Level*
$436 – Buyers – 1.71:1, -2% From Current Price Level
$432 – Buyers – 2.5:1, -2.9% From Current Price Level
$428 – Sellers – 1.43:1, -3.8% From Current Price Level
$424 – Buyers – 4.5:1, -4.7% From Current Price Level – 10 Day Moving Average**
$420 – Buyers – 1.08:1, -5.59% From Current Price Level – 200 Day Moving Average*
$416 – Sellers – 1.03:1, -6.49% From Current Price Level – 50 Day Moving Average*
$412 – Sellers – 1.39:1, -7.39% From Current Price Level
$408 – Buyers – 1.2:1, -8.29% From Current Price Level
$404 – Buyers – 4.14:1, -9.19% From Current Price Level
$400 – Buyers – 1.75:1, -10.09% From Current Price Level
$396 – Sellers – 1.09:1, -10.99% From Current Price Level
$392 – Buyers – 2.22:1, -11.89% From Current Price Level
$388 – Buyers – 2.64:1, -12.79% From Current Price Level
$384 – Buyers – 1.04:1, -13.69% From Current Price Level
$380 – Sellers – 1.04:1, -14.59% From Current Price Level
$376 – Sellers – 1.42:1, -15.48% From Current Price Level
$372 – Sellers – 1.04:1, -16.38% From Current Price Level
$368 – Buyers – 1.67:1, -17.28% From Current Price Level
$364 – Buyers – 1.84:1, -18.18% From Current Price Level
$360 – Buyers – 2.67:1, -19.08% From Current Price Level
$356 – Buyers – 0.2:0*, -19.98% From Current Price Level
$352 – Buyers – 1.71:1, -20.88% From Current Price Level
$348 – Sellers – 1.67:1, -21.78% From Current Price Level
$344 – Buyers – 0.8:0*, -22.68% From Current Price Level
$340 – Buyers – 1.52:1, -23.58% From Current Price Level
$336 – Buyers – 1.5:1, -24.48% From Current Price Level
$332 – Buyers – 1.94:1, -25.37% From Current Price Level
$328 – Buyers – 2.13:1, -26.27% From Current Price Level
$324 – Buyers – 1.07:1, -27.17% From Current Price Level
$320 – Buyers – 1.33:1, -28.07% From Current Price Level
$316 – Even – 1:1, -28.97% From Current Price Level
$312 – Buyers – 1.1:1, -29.87% From Current Price Level
$308 – Buyers – 1.02:1, -30.77% From Current Price Level
$304 – Sellers – 3.27:1, -31.67% From Current Price Level
$300 – Buyers – 1.74:1, -32.57% From Current Price Level
$296 – Sellers – 1.57:1, -33.47% From Current Price Level
$292 – Sellers – 2.8:1, -34.37% From Current Price Level
$288 – Sellers – 1.26:1, -35.26% From Current Price Level
$284 – Even – 1:1, -36.16% From Current Price Level
$280 – Sellers – 2:1, -37.06% From Current Price Level
$276 – Sellers – 6.67:1, -37.96% From Current Price Level
$272 – NULL – 0:0*, -38.86% From Current Price Level
*** I DO NOT OWN SHARES OR OPTIONS CONTRACT POSITIONS IN SPY, QQQ, IWM OR DIA AT THE TIME OF PUBLISHING THIS ARTICLE ***