The VIX closed at 21.6, indicating an implied one day move of +/-1.36% & an implied one month move of +/-6.24% for the S&P 500.
Highest Technical Rated S&P 500 Components Per 6/17/2025’s Close:
1 – PLTR
2 – JBL
3 – GEV
4 – NRG
5 – STX
6 – ORCL
7 – MU
8 – HWM
9 – AXON
10 – DG
Lowest Technical Rated S&P 500 Components Per 6/17/2025’s Close:
1 – ENPH
2 – UNH
3 – LULU
4 – MRNA
5 – PCG
6 – DECK
7 – REGN
8 – EIX
9 – BLDR
10 – COO
Highest Volume Rated S&P 500 Components Per 6/17/2025’s Close:
1 – ENPH
2 – JBL
3 – FSLR
4 – TMUS
5 – LEN
6 – MNST
7 – D
8 – AMD
9 – ADBE
10 – MHK
Lowest Volume Rated S&P 500 Components Per 6/17/2025’s Close:
1 – SMCI
2 – WBA
3 – EXC
4 – DECK
5 – ATO
6 – DG
7 – WYNN
8 – DLTR
9 – MKTX
10 – NFLX
Highest Technical Rated ETFs Per 6/17/2025’s Close:
1 – URAA
2 – JNUG
3 – KORU
4 – NUGT
5 – URA
6 – ORCX
7 – MUU
8 – MULL
9 – DFEN
10 – RBLU
Lowest Technical Rated ETFs Per 6/17/2025’s Close:
1 – SMST
2 – MSOX
3 – ETHD
4 – TSLZ
5 – SOXS
6 – TSLQ
7 – TSDD
8 – HZEN
9 – NVDQ
10 – NVD
Highest Volume Rated ETFs Per 6/17/2025’s Close:
1 – IQSM
2 – QTJA
3 – MFSB
4 – IRVH
5 – IQSU
6 – SECR
7 – QQQP
8 – SPYQ
9 – OND
10 – BGDV
Lowest Volume Rated ETFs Per 6/17/2025’s Close:
1 – ASMF
2 – CPNS
3 – XHYT
4 – NUGO
5 – OVM
6 – BBEM
7 – RGEF
8 – IMAY
9 – KLMN
10 – XBB
Highest Technical Rated General Stocks Per 6/17/2025’s Close:
1 – RGC
2 – SRM
3 – DFDV
4 – MFI
5 – KLTO
6 – BSGM
7 – QNTM
8 – OP
9 – AEVA
10 – NAKA
Lowest Technical Rated General Stocks Per 6/17/2025’s Close:
1 – MULN
2 – HSDT
3 – CYCC
4 – DGLY
5 – SDST
6 – FMTO
7 – ZCAR
8 – APVO
9 – MLGO
10 – CLABF
Highest Volume Rated General Stocks Per 6/17/2025’s Close:
1 – ACXP
2 – CERO
3 – FGL
4 – OUT
5 – PSCA
6 – SLRX
7 – MINM
8 – AZTR
9 – IMRX
10 – RELI
Lowest Volume Rated General Stocks Per 6/17/2025’s Close:
1 – PURE
2 – DRTTF
3 – DYFSF
4 – ADMT
5 – CRVW
6 – AHOTF
7 – AMYZF
8 – GIGGF
9 – EAGRF
10 – PAVS
*** THE LIST ABOVE IS STRICTLY FOR INFORMATIONAL PURPOSES – I MAY OR MAY NOT HAVE OR INITIATE A LONG, SHORT, OR LONG/SHORT POSITION IN ANY NAME ABOVE AT ANY TIME ***
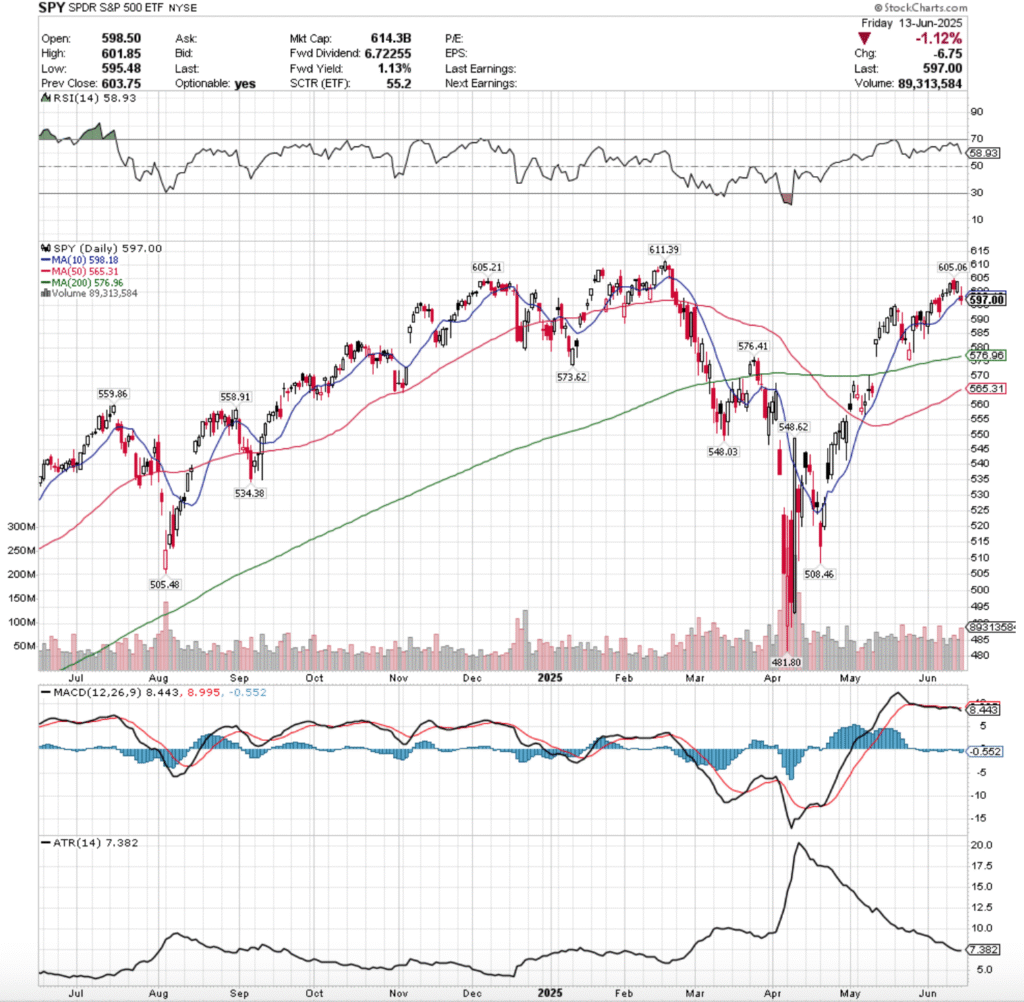
SPY, the SPDR S&P 500 ETF lost -0.36% this week, while the VIX closed at 20.82, indicating an implied one day move of +/-1.31 & a one month implied move of +/-6.02%.
SPY ETF – SPDR S&P 500 ETF’s Technical Performance Over The Past Year
Their RSI is trending down towards the neutral 50 mark & is currently at 58.93 & their MACD is bearish, but still relatively flat; however their histogram is signaling that bearishness is likely to continue & expand next week.
Volumes were +19.92% higher than the prior year’s average (69,314,000 vs. 57,801,235), with Friday’s bearish session seeing the highest level of the week, as market participants were eager to take risk off of the table before the weekend in the wake of Israel & Iran’s conflict escalating.
Last week kicked off on a note of uncertainty for SPY, as the session opened in line with Friday’s close & produced the lowest volume of the week to close as a doji candle, indicating that there was not much confidence & market participants were more in a “wait & see” type of mood.
Tuesday opened higher, retraced much of Monday’s candle to the downside, before pushing higher to close at $603.08/share on slightly better volume.
Wednesday confirmed the feelings of unease, as a gap up open managed to break above the $605/share mark temporarily, before plunging down & exposing the vulnerability in broader markets on the week’s second highest volume as market participants took chips off of the table following the gains of Tuesday.
Thursday opened lower & made a run at Wednesday’s opening price but failed to reach it as there was not enough positive sentiment in the market, and that inability to hit Wedneday’s open or high signaled that there is clearly an impediment at the $605/share level.
Friday was the epitome of a ris-off day, as a gap down open led to a brief stint above $600/share again, but profits were quickly taken from the table & SPY was forced down to $595.48 before closing at $597/share ont he highest volume of the week.
Looking to the coming week there are a few things to take into consideration.
Firstly, the $605/share level looks to be forming the shoulders of a potential bearish head & shoulders pattern on the one year chart with the $611.39/share level, which will be an area of focus in the coming week.
There is also another head & shoulders pattern brewing on a more short-term level bearishly that began with the gap up on May 12, 2025 which will be something to watch, as it may well become an island top when the gap created that day gets filled.
The bullish case for SPY is now incredibly simple, the $605-605.99/share zone needs to be broken through & it needs solid advancing volume if it is to be sustainable.
If that can’t happen, we don’t see a run at the all-time high of $611.35/share, much less it broken through.
There is likelihood of a squeeze higher situation early in the week where a mix of short-covering & “last hurrah” profit seekers pump prices up before Wednesday’s FOMC decision, but if $605 holds up as a resistance point/doesn’t get retested it’s a signal of bearishness.
The consolidation case remains the same as it has for the past month in our notes, oscillations around the 10 day moving average, but keep an eye on the 50 DMA approaching the 200 DMA bullishly, as a golden cross may boost confidence briefly & lead to some advances.
The consolidation case looks to be the best case scenario at the moment, as there is limited data & earnings coming out this week, minus the FOMC decision & earnings/reports on the state of homebuilders & the housing market, as well as some US absed manufacturing data on a shortened holiday week (Thursday the market is closed).
To the downside there begins to be some pockets of concern given how SPY has recently performed.
One of the most important things to watch heading into this week is that when things do cool off, how far support levels are away from SPY’s closing price.
There is a very easy to visualize ~3% decline on the horizon when you look at SPY’s support levels heading into the new week, where the 200 day moving average comes into play.
All eyes should be on there if we see any declines this week, as the long-term trend line is likely to be retested.
The long-term trend line is ~-3.36% lower than Friday’s close & will likely be retested in the event of any declines given how few support levels SPY has at this point.
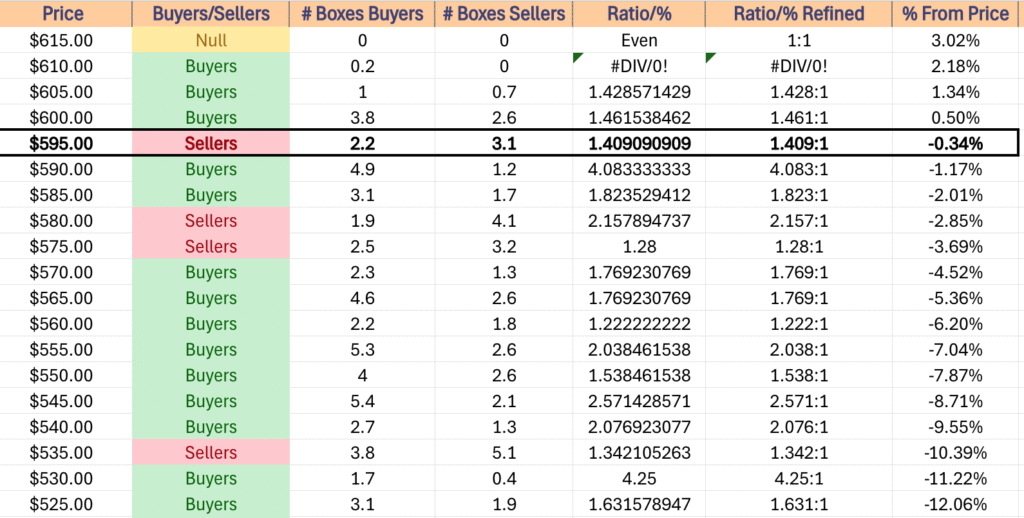
That’s where to fixate attention to at the moment, particularly when you reference the table below for their historic price level sentiment.
SPY has support at the $576.96 (200 Day Moving Average, Volume Sentiment: Sellers, 1.28:1), $576.41 (Volume Sentiment: Sellers, 1.28:1), $573.62 (Volume Sentiment: Buyers, 1.77:1) & $565.31/share (Volume Sentiment: Buyers, 1.77:1) price levels, with resistance at the $598.18 (10 Day Moving Average, Volume Sentiment: Sellers, 1.41:1), $605.06 (Volume Sentiment: Buyers, 1.43:1), $605.21 (Volume Sentiment: Buyers, 1.43:1) & $611.39/share (All-Time High, Volume Sentiment: Buyers, 0.2:0*) price levels.
SPY ETF’s Price Level:Volume Sentiment Over The Past ~3 Years
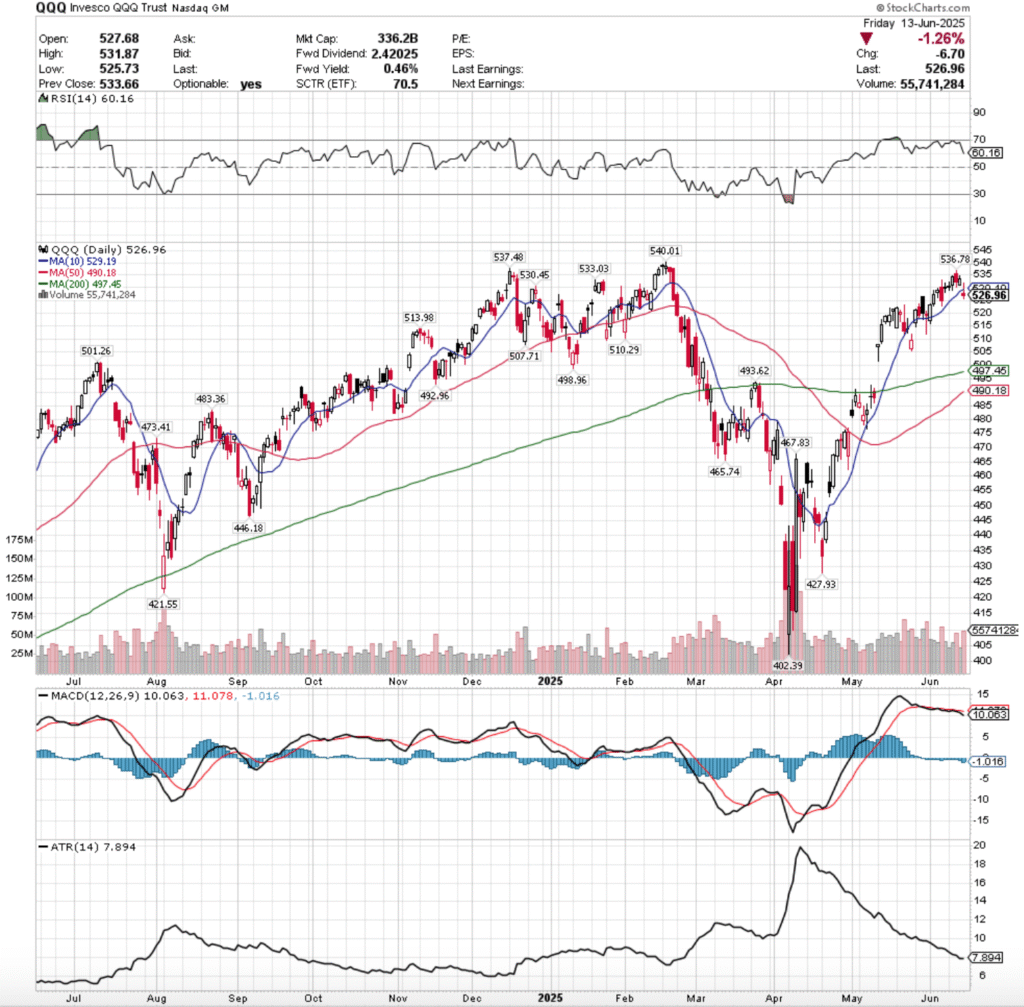
QQQ, the Invesco QQQ Trust ETF dropped -0.56% last week, as the tech heavy index was saved in part by Oracle’s earnings call.
QQQ ETF – Invesco QQQ Trust ETF’s Technical Performance Over The Past Year
Their RSI is trending down back towards the neutral 50-mark & is currently at 60.16, while their MACD is still bearish, with their histogram implying that there is more declines & sour sentiment on the horizon.
Volumes were +13.36% higher than the previous year’s average (43,592,000 vs. 38,452,988), led primarily by Wednesday & Friday’s declining sessions, which were the two highest volume days of the week.
Monday started off similar to SPY, another low volume doji session as market participants digested the week prior’s data & looked ahead to plan the approach to the following week that is short & features an FOMC decision.
Tuesday opened on a gap higher, tested back below the $520/share mark, but was able to grind higher on slightly better volume than the previous day.
Wednesday opened on a gap up to above $535, but was unable to gain stable footing & wound up declining throughout the session, reverting back towards the 10 day moving average & indicating that the sh0rt term trend had not been broken out from.
Thursday opened on a gap down, but the weak volume session managed to squeeze QQQ higher briefly, but the lack of participation was noted.
It was felt on Friday when QQQ opened on a gap down, tried to retrace higher & break back to where it had spent the week, but was unable to as profits were taken & prices were forced lower, causing a -1.26% decline & forcing the close & open to both take place below the resistance of the 10 day moving average.
Looking ahead to this week, that negative sentiment is in the air & any bullishness is making a run at all-time highs, so unless we see a real shift in rising advancing volume or a surprise bit of FOMC news there’s not much to watch beyond the $540.01/share mark.
There is a growing concern about the potential bearish head & shoulders pattern from November where the ATH is the head & $537.48 & $536.78/share are the left & right shoulder respectively, which will be something to watch.
The consolidation case here is the same as usual, oscillations around the 10 day moving average, waiting for an upside or downside catalyst to strike, while also awaiting a potential small short-term pump from the 50 & 200 DMA’s golden cross that is impending.
The downside case has the $507.71/share price level in target, as the three higher support levels are all Seller dominated & this resides in the window created in early May that needs to be filled.
Should this get retested, the 200 day moving average’s support will come into question & likely see a re-test, as the long-term trendline is beginning to look less stable.
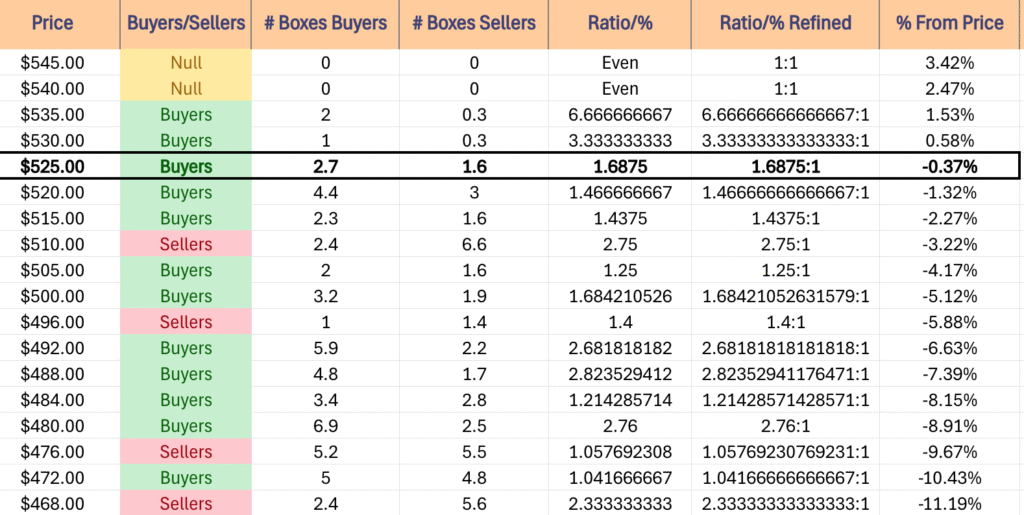
QQQ has support at the $513.98 (Volume Sentiment: Sellers, 2.75:1), $510.29 (Volume Sentiment: Sellers, 2.75:1), $510.29 (Volume Sentiment: Sellers, 2.75:1) & $507.71/share (Volume Sentiment: Buyers, 1.25:1) price levels, with resistance at the $529.19 (10 Day Moving Average, Volume Sentiment: Buyers, 1.69:1), $530.45 (Volume Sentiment: Buyers, 3.33:1), $533.03 (Volume Sentiment: Buyers, 3.33:1) & $536.78/share (Volume Sentiment: Buyers, 6.67:1) price levels.
QQQ ETF’s Price Level:Volume Sentiment Over The Past ~1 Year
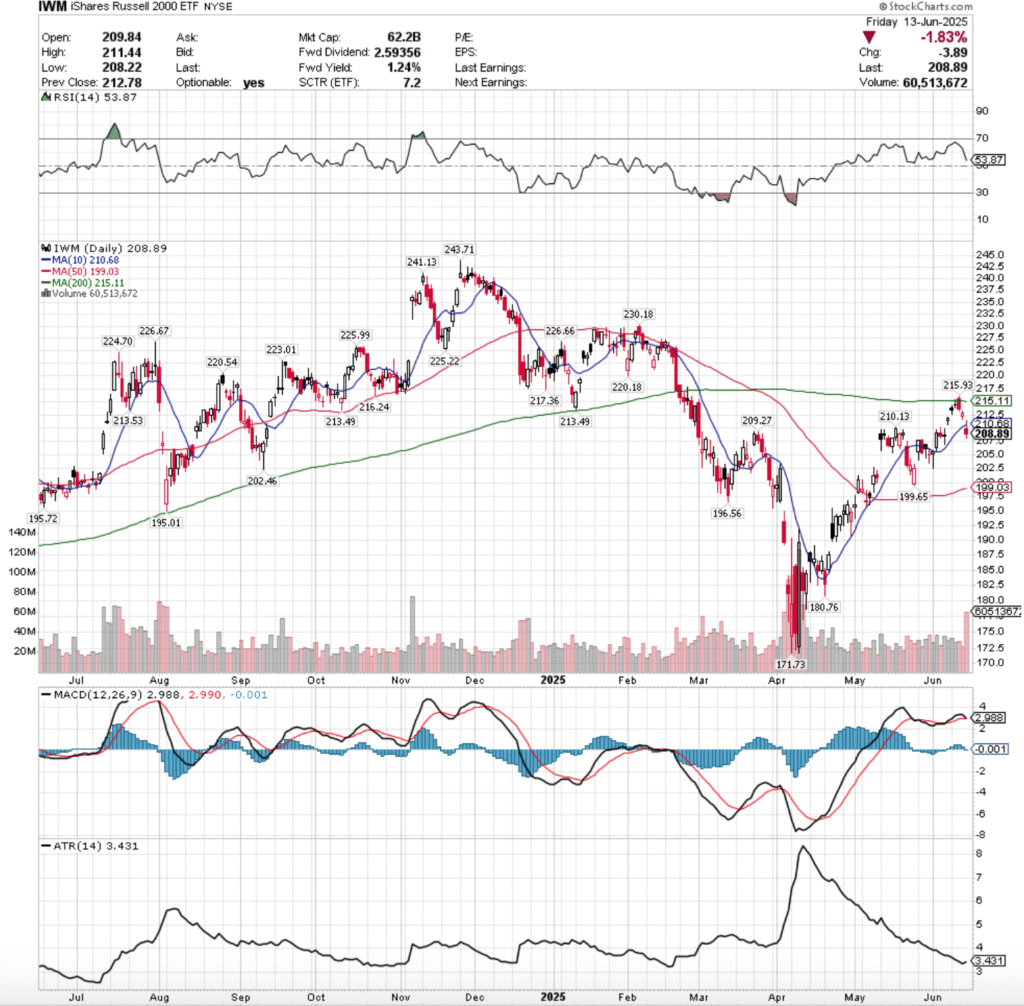
IWM, the iShares Russell 2000 ETF declined -1.42% last week, as the small cap index fell back out of favor among market participants.
IWM ETF – iShares Russell 2000 ETF’s Technical Performance Over The Past Year
Their RSI is trending back towards the neutral 50-level, currently at 53.87, while their MACD is set to cross over bearishly on Monday’s open.
Volumes were +19.04% higher than the previous year’s average (36,244,000 vs. 30,446,096), which is cause for concern given that the declining volume on Friday eclipsed the rest of the week, hitting levels not seen since early April 2025.
Monday opened the week up on a gap up on the week’s second highest volume, but there was a major warning sign flashed as the volume indicates short-term profit taking & the day closed as a hanging man candle that closed lower than it opened.
Tuesday again gapped higher on the open, this time on less volume indicating skepticism in the strength behind the recent advances, and the gravestone doji candle signaled that there was about to be a risk-off move.
Wednesday confirmed this, as the open was on a gap up to above the resistance of the 200 day moving average, but quickly chips were taken off of the table & the long-term trendline prevailed.
Thursday opened on a gap lower & experienced a short-term pump intraday that forced the close to be higher than the open, but the low volume & nature of the previous few sessions did not make for a convincing bullish case.
Friday this continued, where a gap down open to below the support of the 10 day moving average occurred, IWM made a run to break above the short-term moving average & failed as intraday profits were collected, and the result was a -1.83% day on high declining volume, indicating that there’s more pain to come.
Heading into a new week, the bullish case requires a successful retest of the $210.13/share resistance level, which would then with enough advancing volume behind it lead to a retest of the $214.49/share level, which has two resistance levels, which happens to reside in a Seller dominated zone.
Should that test succeed, we see a long-term trendline retest on the horizon, but that’s getting ahead of ourselves, particiularly if we get there via gap ups
The consolidation case is an oscillation around the 10 DMA, while we await a catalyst to move SPY, QQQ or DIA & carry IWM with it.
To the downside, the primary focal point now is the 50 day moving avearge’s support, which is moving upwards which may help IWM prevent declines, but is certainly the gatekeeper to the downside.
If the 50 DMA breaks down, the 2025 year low price is the last test that matters.
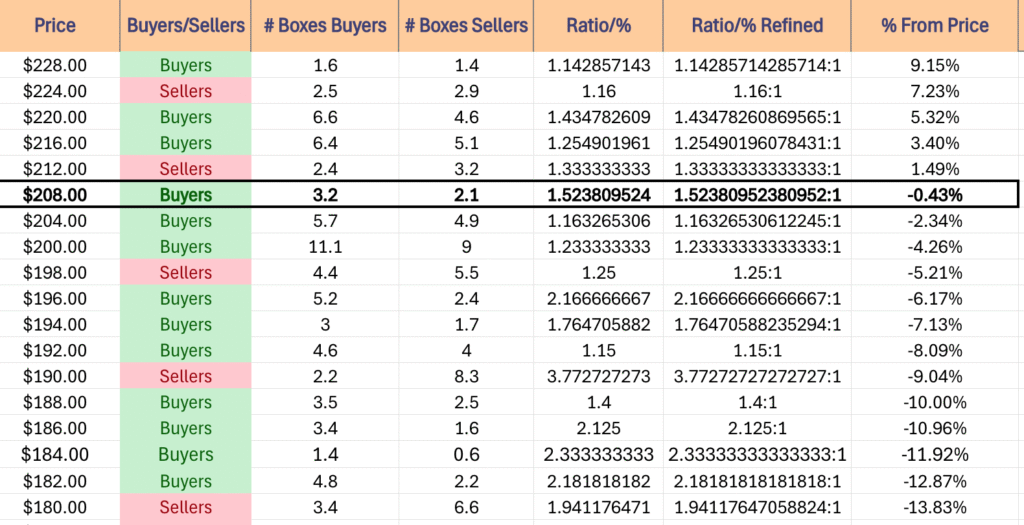
IWM has support at the $202.46 (Volume Sentiment: Buyers, 1.23:1), $199.65 (Volume Sentiment: Sellers, 1.25:1), $199.03 (50 Day Moving Average, Volume Sentiment: Sellers, 1.25:1) & $196.56/share (Volume Sentiment: Buyers, 2.17:1) price levels, with resistance at the $209.27 (Volume Sentiment: Buyers, 1.53:1), $210.13 (Volume Sentiment: Buyers, 1.53:1), $210.68 (10 Day Moving Average, Volume Sentiment: Buyers, 1.53:1) & $214.49/share (2 Touch-Points, Volume Sentiment: Sellers, 1.33:1) price levels.
IWM ETF’s Price Level:Volume Sentiment Over The Past ~2-3 Years
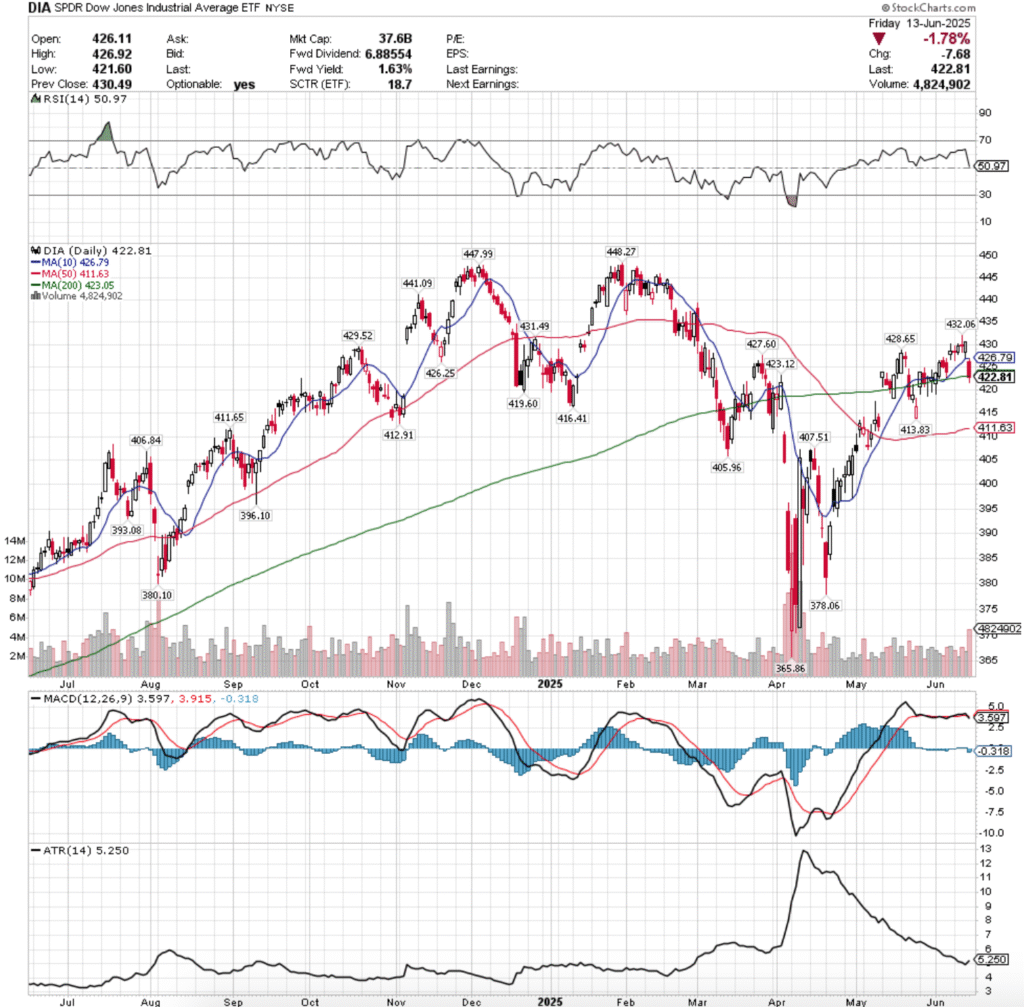
DIA ETF – SPDR Dow Jones Industrial Average ETF’s Technical Performance Over The Past Year
Their RSI is trending downwards & near neutral at 50.97, while their MACD crossed over the signal line bearishly on Friday.
Volumes were -4.79% lower than the previous year’s average (3,028,000 vs. 3,180,398), which like IWM is cause for concern based on Friday’s declining session’s volume eclipsing most of 2025’s volumes, only outdone by early April’s.
The week was marked by “wait & see”/”hold on” as Monday opened the week up with a high wave doji and mediocre volume indicating a sense of complacency & uncertainty among market participants.
Tuesday advanced on weak volume, before another high wave doji on Wednesday for a decline on the second highest volume of the week that marked the high water mark.
Thursday opened on a gap down that tested the support of the 10 day moving average, but was able to advance in the end to close above $430/share.
Friday showed the cracks in DIA where the gap down open below the 10 day moving avearge’s resistance only carried lower, testing the support of the 200 day moving average & breaking down through the long-term trendline to close below it on the day.
Currently the 200 DMA is DIA’s likely main place to stay this week, osciallating around waiting for a catalyst to the upside or downside.
They’re currently not set up for upside or downside breakouts as most of the blue chip index owners have been sitting on their hands waiting for an upside/downside catalyst, which will continue into this week.
To the downside if there’sa breakdown keep an eye on the 50 day moving average’s support.
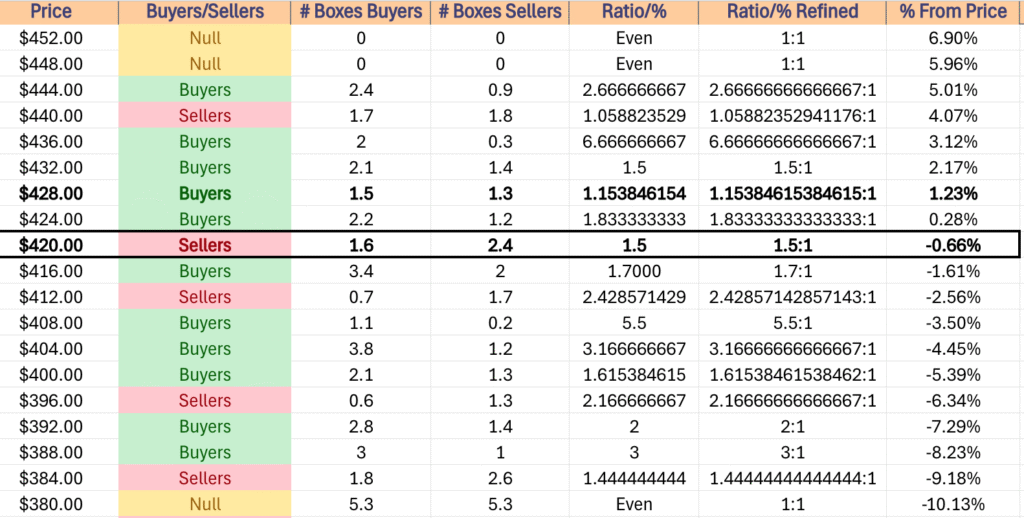
DIA has support at the $419.60 (Volume Sentiment: Buyers, 1.7:1), $416.41 (Volume Sentiment: Buyers, 1.7:1), $413.83 (Volume Sentiment: Sellers, 2.43:1) & $412.91/share (Volume Sentiment: Sellers, 2.43:1) price levels, with resistance at the $423.05 (200 Day Moving Average, Volume Sentiment: Sellers, 1.5:1), $423.12 (Volume Sentiment: Sellers, 1.5:1), $426.25 (Volume Sentiment: Buyers, 1.83:1) & $426.79/share (10 Day Moving Average, Volume Sentiment: Buyers, 1.83:1) price levels.
DIA ETF’s Price Level:VOlume Sentiment Over The Past ~4 Years
The Week Ahead
Monday the week kicks off with Empire State Manufacturing Survey data at 8:30 am.
Lennar is the only major earnings report on Monday, which will take place after the session’s close.
U.S. Retail Sales, Retail Sales minus Autos, Import Price Index & Import Price Index minus Fuel data are scheduled for release at 8:30 am on Tuesday, before Industrial Production & Capacity Utilization data at 9:15 am, and Business Inventories & Home Builder Confidence Index data at 10 am.
Tuesday begins with Jabil & Wiley reporting earnings before the session’s open, before La-Z-Boy’s report comes after the closing bell.
Wednesday will be an important day to watch, with Housing Starts, Building Permits & Initial Jobless Claims data due out at 8:30 am, followed by the FOMC Interest Rate Decision at 2pm & Fed Chair Powell’s Press Conference at 2:30 pm.
GMS & Korn/Ferry report earnings before Wednesday’s opening bell, with Smith & Wesson Brands reporting after the session’s close.
There is no economic data nor earnings reports scheduled for release on Thursday.
Friday the week winds down with Philadelphia Fed Manufacturing Survey Data at 8:30 am.
Darden Restaurants, Accenture, CarMax & Kroger all report earnings before Friday morning’s opening bell.
See you back here next week!
*** I DO NOT OWN SHARES OR OPTIONS CONTRACT POSITIONS IN SPY, QQQ, IWM OR DIA AT THE TIME OF PUBLISHING THIS ARTICLE ***
The VIX closed at 20.82, indicating an implied one day move of +/-1.31 & a one month implied move of +/-6.02% for the S&P 500.
Highest Technical Rated S&P 500 Components Per 6/13/2025’s Close:
1 – PLTR
2 – ORCL
3 – NRG
4 – GEV
5 – STX
6 – AXON
7 – HWM
8 – MU
9 – DG
10 – VST
Lowest Technical Rated S&P 500 Components Per 6/13/2025’s Close:
1 – UNH
2 – DECK
3 – LULU
4 – PCG
5 – EIX
6 – ENPH
7 – MRNA
8 – REGN
9 – COO
10 – HPQ
Highest Volume Rated S&P 500 Components Per 6/13/2025’s Close:
1 – ORCL
2 – ADBE
3 – BRO
4 – MA
5 – V
6 – PCG
7 – CF
8 – BG
9 – RTX
10 – OXY
Lowest Volume Rated S&P 500 Components Per 6/13/2025’s Close:
1 – CEG
2 – BEN
3 – ELV
4 – AVY
5 – TKO
6 – VRSN
7 – RMD
8 – MKTX
9 – EA
10 – RSG
Highest Technical Rated ETFs Per 6/13/2025’s Close:
1 – JNUG
2 – ORCX
3 – URAA
4 – NUGT
5 – KORU
6 – DFEN
7 – GDMN
8 – URA
9 – AVGX
10 – MEXX
Lowest Technical Rated ETFs Per 6/13/2025’s Close:
1 – SMST
2 – MSOX
3 – TSLZ
4 – ETHD
5 – TSLQ
6 – TSDD
7 – SOXS
8 – HZEN
9 – JDST
10 – NVDQ
Highest Volume Rated ETFs Per 6/13/2025’s Close:
1 – NVBU
2 – NBTR
3 – ACLO
4 – EMDV
5 – ITDH
6 – AVSE
7 – AVGV
8 – SHPP
9 – NBFC
10 – JSTC
Lowest Volume Rated ETFs Per 6/13/2025’s Close:
1 – BBEM
2 – IMAR
3 – JEMB
4 – NUGO
5 – GENM
6 – ZSEP
7 – SPMB
8 – ZAUG
9 – MCH
10 – PABU
Highest Technical Rated General Stocks Per 6/13/2025’s Close:
1 – AMPE
2 – ISUNQ
3 – RGC
4 – DFDV
5 – KLTO
6 – MFI
7 – BSGM
8 – TMPOQ
9 – BTM
10 – AEVA
Lowest Technical Rated General Stocks Per 6/13/2025’s Close:
1 – MULN
2 – HDST
3 – CYCC
4 – DGLY
5 – FMTO
6 – WLGS
7 – EJH
8 – ZCAR
9 – GDHG
10 – RSLS
Highest Volume Rated General Stocks Per 6/13/2025’s Close:
1 – OP
2 – BRN
3 – ICON
4 – CASI
5 – USEG
6 – OUT
7 – TORO
8 – BATL
9 – HUSA
10 – EONR
Lowest Volume Rated General Stocks Per 6/13/2025’s Close:
1 – DBIN
2 – BTSGU
3 – AILEQ
4 – NROM
5 – GLAI
6 – FNRN
7 – AXAHF
8 – MISVF
9 – SMREF
10 – GDRZF
*** THE LIST ABOVE IS STRICTLY FOR INFORMATIONAL PURPOSES – I MAY OR MAY NOT HAVE OR INITIATE A LONG, SHORT, OR LONG/SHORT POSITION IN ANY NAME ABOVE AT ANY TIME ***
The VIX closed at 18.02, indicating an implied one day move of +/-1.14% & an implied one month move of +/-5.21% for the S&P 500.
Highest Technical Rated S&P 500 Components Per 6/12/2025’s Close:
1 – PLTR
2 – GEV
3 – NRG
4 – AXON
5 – ORCL
6 – STX
7 – HWM
8 – MU
9 – APH
10 – AVGO
Lowest Technical Rated S&P 500 Components Per 6/12/2025’s Close:
1 – UNH
2 – ENPH
3 – LULU
4 – REGN
5 – EIX
6 – PCG
7 – DECK
8 – MRNA
9 – COO
10 – SJM
Highest Volume Rated S&P 500 Components Per 6/12/2025’s Close:
1 – ORCL
2 – K
3 – BRO
4 – IPG
5 – BA
6 – OMC
7 – SJM
8 – ROST
9 – ADBE
10 – FDS
Lowest Volume Rated S&P 500 Components Per 6/12/2025’s Close:
1 – WBA
2 – HON
3 – MPWR
4 – TKO
5 – TRMB
6 – TXN
7 – J
8 – CDNS
9 – FI
10 – EPAM
Highest Technical Rated ETFs Per 6/12/2025’s Close:
1 – JNUG
2 – KORU
3 – URAA
4 – AVGX
5 – NUGT
6 – ORCX
7 – MEXX
8 – DFEN
9 – PLTM
10 – MUU
Lowest Technical Rated ETFs Per 6/12/2025’s Close:
1 – SMST
2 – ETHD
3 – MSOX
4 – SOXS
5 – TSLZ
6 – TSLQ
7 – TSDD
8 – HZEN
9 – NVDQ
10 – NVD
Highest Volume Rated ETFs Per 6/12/2025’s Close:
1 – SHUS
2 – TBJL
3 – ESIX
4 – MUSI
5 – QCON
6 – JHCR
7 – VCLN
8 – NFRA
9 – JIG
10 – NBCC
Lowest Volume Rated ETFs Per 6/12/2025’s Close:
1 – PSCW
2 – EMCS
3 – NFEB
4 – HYSD
5 – UNOV
6 – JEMB
7 – UMAY
8 – AUGW
9 – DECZ
10 – KVLE
Highest Technical Rated General Stocks Per 6/12/2025’s Close:
1 – KLTO
2 – DFDV
3 – RGC
4 – MFI
5 – BSGM
6 – NAKA
7 – KNW
8 – TMPOQ
9 – AEVA
10 – BTM
Lowest Technical Rated General Stocks Per 6/12/2025’s Close:
1 – MULN
2 – CYCC
3 – CHNR
4 – HSDT
5 – EJH
6 – FMTO
7 – WLGS
8 – DGLY
9 – GDHG
10 – SUNE
Highest Volume Rated General Stocks Per 6/12/2025’s Close:
1 – CGTL
2 – REZZF
3 – HUSA
4 – SOAR
5 – IPA
6 – RSLS
7 – TDHT
8 – MISVF
9 – CVAC
10 – ZCMD
Lowest Volume Rated General Stocks Per 6/12/2025’s Close:
1 – GNLN
2 – DSNY
3 – DCMDF
4 – NSRCF
5 – ACDVF
6 – IPDN
7 – NYMXF
8 – DTEGF
9 – CYAN
10 – BAOS
*** THE LIST ABOVE IS STRICTLY FOR INFORMATIONAL PURPOSES – I MAY OR MAY NOT HAVE OR INITIATE A LONG, SHORT, OR LONG/SHORT POSITION IN ANY NAME ABOVE AT ANY TIME ***
The VIX closed at 17.26, indicating an implied one day move of +/-1.09% & an implied one month move of +/-4.99% for the S&P 500.
Highest Technical Rated S&P 500 Components Per 6/11/2025’s Close:
1 – PLTR
2 – GEV
3 – NRG
4 – AXON
5 – STX
6 – MU
7 – HWM
8 – DG
9 – AVGO
10 – APH
Lowest Technical Rated S&P 500 Components Per 6/11/2025’s Close:
1 – UNH
2 – EIX
3 – REGN
4 – ENPH
5 – LULU
6 – PCG
7 – DECK
8 – SJM
9 – MRNA
10 – COO
Highest Volume Rated S&P 500 Components Per 6/11/2025’s Close:
1 – BRO
2 – SJM
3 – LMT
4 – PCG
5 – CTVA
6 – HBAN
7 – STZ
8 – RF
9 – ORCL
10 – EIX
Lowest Volume Rated S&P 500 Components Per 6/11/2025’s Close:
1 – WBA
2 – TKO
3 – ES
4 – XYL
5 – EA
6 – FOXA
7 – NOW
8 – EXPE
9 – HSIC
10 – LVS
Highest Technical Rated ETFs Per 6/11/2025’s Close:
1 – KORU
2 – URAA
3 – JNUG
4 – DFEN
5 – MEXX
6 – HOOX
7 – HOOG
8 – ROBN
9 – MUU
10 – TARK
Lowest Technical Rated ETFs Per 6/11/2025’s Close:
1 – SMST
2 – ETHD
3 – MSOX
4 – TSLZ
5 – TSLQ
6 – TSDD
7 – SOXS
8 – HZEN
9 – BTCZ
10 – SBIT
Highest Volume Rated ETFs Per 6/11/2025’s Close:
1 – TBFG
2 – TBFC
3 – MUSE
4 – JULM
5 – ACLC
6 – CCOR
7 – CSHP
8 – XDAT
9 – UAUG
10 – SHPP
Lowest Volume Rated ETFs Per 6/11/2025’s Close:
1 – TFJL
2 – GSID
3 – JANZ
4 – HYSD
5 – HYDW
6 – IMAR
7 – XHYI
8 – ZAUG
9 – RSSE
10 – PBMY
Highest Technical Rated General Stocks Per 6/11/2025’s Close:
1 – RGC
2 – DFDV
3 – KLTO
4 – NAKA
5 – BSGM
6 – SBET
7 – TMPOQ
8 – BTM
9 – AEVA
10 – ASST
Lowest Technical Rated General Stocks Per 6/11/2025’s Close:
1 – MULN
2 – CYCC
3 – AILEQ
4 – RSLS
5 – EJH
6 – FMTO
7 – GDHG
8 – DGLY
9 – WLGS
10 – HSDT
Highest Volume Rated General Stocks Per 6/11/2025’s Close:
1 – KZIA
2 – DEA
3 – VTAK
4 – NUWE
5 – BMR
6 – OUT
7 – HSDT
8 – CNET
9 – INEO
10 – XTIA
Lowest Volume Rated General Stocks Per 6/11/2025’s Close:
1 – JPOTF
2 – TAOIF
3 – CANSF
4 – TRBMF
5 – KLNG
6 – BTSGU
7 – VRDR
8 – SMTSF
9 – AHOTF
10 – PAVS
*** THE LIST ABOVE IS STRICTLY FOR INFORMATIONAL PURPOSES – I MAY OR MAY NOT HAVE OR INITIATE A LONG, SHORT, OR LONG/SHORT POSITION IN ANY NAME ABOVE AT ANY TIME ***
XLU, the Utilities Select Sector SPDR Fund ETF has advanced +14.84% this past year, having gained +19.62% since it’s 52-week low in July of 2024, while sitting -2.78% below it’s 52-week high set in June of 2025 (all figures ex-distributions).
Much of their success has been due to the realization that the AI & data center boom is going to require a lot more energy than we currently produce, which is great for utility companies’ outlooks.
Some of their top holdings include NextEra Energy Inc. (NEE), The Southern Co. (SO), Constellation Energy (CEG), Duke Energy Corp. (DUK), Vistra Corp. (VST), American Electric Power (AEP), Sempra (SRE), Dominion Energy Inc. (D), Exelon Corp. (EXC) & Public Services Enterprise (PEG).
Given that the S&P 500 & NASDAQ are within striking distance of their all-time highs & the Russell 2000 has just poked its head out above the 200 day moving average (long-term trend line), it is worth taking a look at how XLU has performed historically, as in the event of a broader market pullback some market participants may use XLU as a temporary flight to safety.
Below is a brief technical analysis of XLU’s recent performance, along with an analysis of their volume sentiment at each price level they’ve traded at over the past ~4 years.
It is not financial advice, but rather an additional tool to reference while performing your own due diligence on XLU, as it shows how market participants have behaved previously at each price level.
This can be particularly useful when analyzing the strength/weakness of support/resistance levels.
Technical Analysis Of XLU, The Utilities Select Sector SPDR Fund ETF
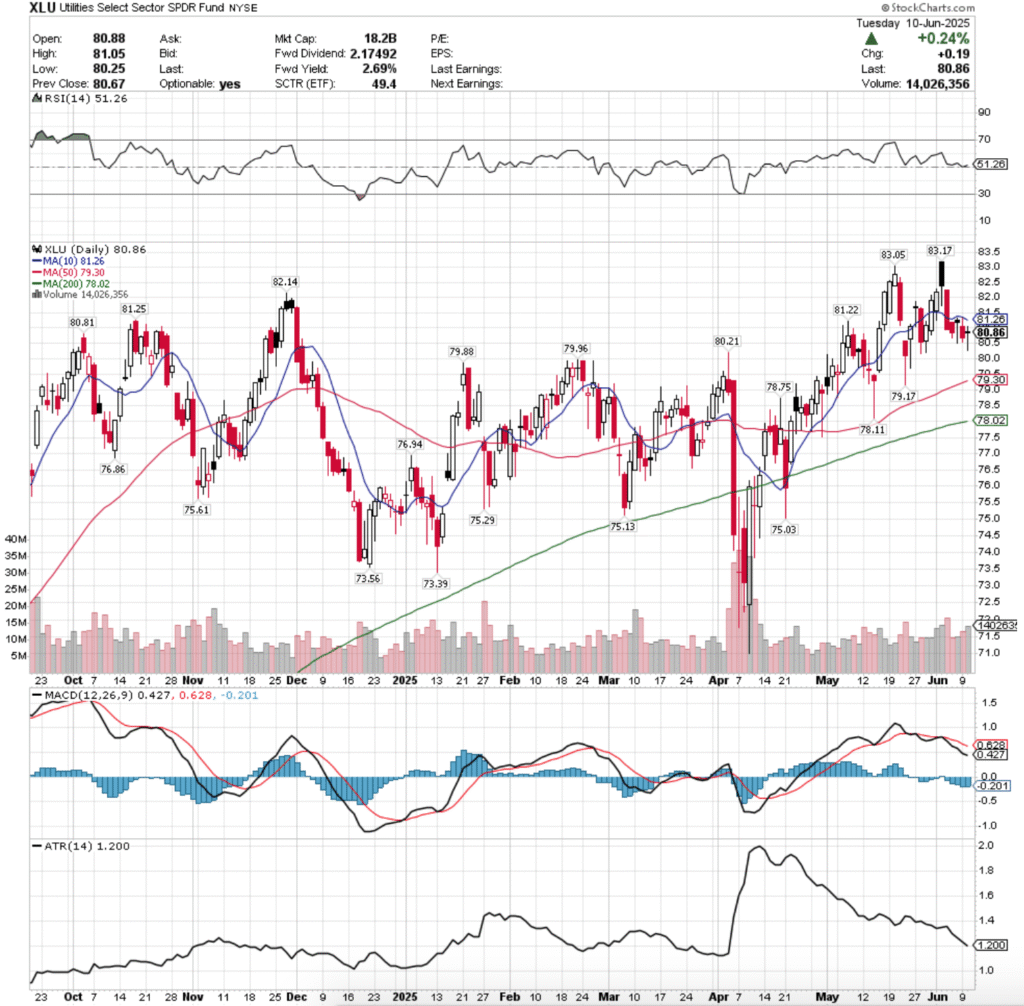
XLU ETF – Utilties Select Sector SPDR Fund ETF’s Technical Performance Over The Past ~9 Months
Their RSI is just above the neutral level at 52.37, while their MACD has been bearish since the beginning of June.
Volumes have been +22.86% higher than the past year’s average levels over the past week & a half (13,121,428.57 vs. 10,679,920), which is slight cause for concern coming off of their 52-week high, which occurred on a not-so-bullish session.
Last Monday saw XLU open on a slight decline, just above the 10 day moving average’s support, which it tested intraday, but remained sturdy & forced XLU higher to close as an advancing session with sturdy advancing volume.
Tuesday began to show signs of cracks, as XLU opened on a large gap up to above their upper Bollinger band, hitting a high of $83.17 (52-week high) before crumbling down to $81.74/share & recovering during the day to close below its opening price at $82.40.
This showed a lot of intraday profit taking, as well as folks taking chips off of the table following the run up of the previous three sessions & set the stage for more profit taking heading into the end of the week.
Wednesday opened on a gap down & everyone was jumping out of the pool, forcing XLU’s price lower to break down the support of the 10 day moving average, breaking the short-term trend on the highest volume that XLU has seen since early April 2025.
Thursday opened higher, but the theme of declines carried on & XLU crossed below the 20 day moving average, leaving a lower shadow that indicated that there was more downside than upside sentiment still lurking.
Friday also showed a lack of enthusiasm for XLU, as a gap up open quickly broke down to expose a lower shadow that went down to new depths not seen since late May, indicating that there was beginning to be a sense of fear in the market.
Volumes were about even with the previous day’s outflow volume, and the resistance of the 10 day moving average remained resilient to the upside.
The day’s candle was a hanging man despite not being in a true uptrend & it closed below its opening price, indicating that there is more danger on the horizon for XLU.
Monday opened up on a gap down, tried to rally & test higher but was rejected by the resistance of the 10 day moving average, and it all went downhill from there to close the day out as a declining session on volumes that were higher than the previous two days’.
Tuesday opened on a gap up, but again was unable to gather any steam to the upside & reversed well short of the 10 DMA, before sliding down to $80.25 before closing at $80.86 as a doji candle, indicating that there was a bit of uncertainty in the air.
While the day managed to advance, it also formed a bearish harami cross, which when paired with the deep lower shadow looks like there is more downside appetite for XLU on the horizon.
It is also worth noting that there was a bit of intraday profit taking & cutting losses short, as the sessions volume suggests, but the overall sentiment is still not enthusiastic in the near-term.
To the upside, the 10 day moving average will be the primary area of focus, as if it is broke through then XLU has one remaining test before retesting their 52-week high.
The 10 DMA is also an area of interest in the consolidation case, where prices would oscillate around the range that they’ve been in the past few sessions & around the 10 DMA while awaiting an upside or downside catalyst.
To the downside there is a solid amount of support in the $79-79.99/share zone, but should that break down & the $78/share level be encroached we will see a test of the long-term moving average.
This is important as it marks long-term sentiment & outlook, while also having a great deal of Seller dominated zones directly beneath it (four of the next five down, with the one non Seller zone being historically gridlocked between Buyers & Sellers).
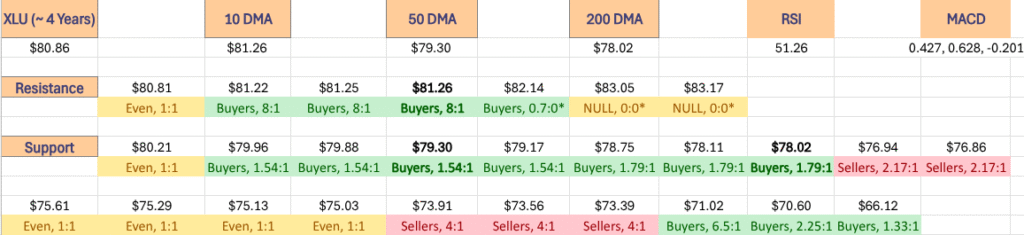
The table in the section below is worth reviewing to assess the strength of each price level XLU may trade at in the coming weeks-to-months & can be used as a tool for evaluating the strength/weakness of support/resistance levels when they get re-tested, based on XLU’s performance over the past ~4 years.
Again, recall that this is not financial advice, but is meant to serve as an additional tool to use in doing your own due diligence on XLU.
Price Level:Volume Sentiment Analysis For XLU, The Utilities Select Sector SPDR Fund ETF
The top table below shows the support & resistance levels of XLU from the past year’s chart, as well as their price level:volume sentiment at each from data covering the past ~4 years, using Tuesday 6/10/2025’s closing data for their price & moving averages/other technicals.
The 10, 50 & 200 day moving averages are denoted with bold.
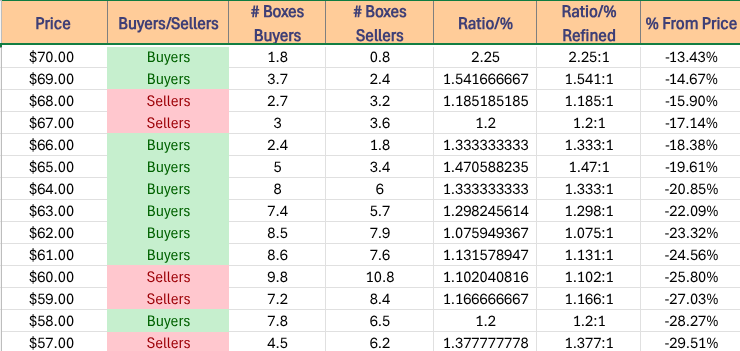
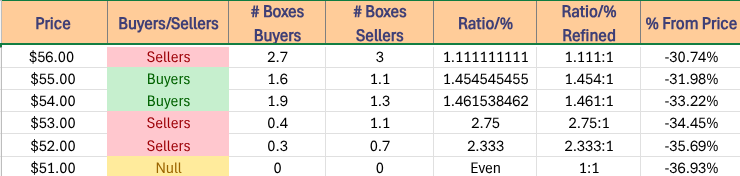
The next tables show the volume sentiment at each individual price level XLU has traded at over the past ~4 years.
Beneath them is a copy & pasteable list of the same data, where the support/resistance levels are denoted in bold.
All ratios with “0” in the denominator are denoted with a “*”.
NULL values are price levels that had limited trading volume, whether it be due to gaps, quick advances or they are at price extremes; in the event that they are retested & there is more data they would have a distinct “Buyers”, “Sellers” or “Even” title.
This is not intended as financial advice, but rather another tool to consider when performing your own research & due diligence on XLU.
The following section lays out XLU’s one year support/resistance levels, as well as their Buyer:Seller (Seller:Buyer) ratios at each price level that they’ve traded at over the past ~4 years, which can be used as a barometer for estimating the expected strength/weakness of each of the support/resistance levels.
XLU ETF’s Price Level:Volume Sentiment Over The Past ~4 Years At Their Past Year Support & Resistance Levels
XLU ETF’s Price Level:Volume Sentiment Over The Past ~4 Years
Price Level:Volume Sentiment For XLU ETF Over The Past ~4 Years
Price Level:Volume Sentiment For XLU ETF Over The Past ~4 Years
$84 – NULL – 0:0*, +3.88% From Current Price Level
$83 – NULL – 0:0*, +2.65% From Current Price Level
$82 – Buyers – 0.7:0*, +1.41% From Current Price Level
$81 – Buyers – 8:1, +0.17% From Current Price Level – 10 Day Moving Average*
$80 – Even – 1:1, -1.06% From Current Price Level – Current Price Level*
$79 – Buyers – 1.54:1, -2.3% From Current Price Level – 50 Day Moving Average*
$78 – Buyers – 1.79:1, -3.54% From Current Price Level – 200 Day Moving Average*
$77 – Sellers – 1.5:1, -4.77% From Current Price Level
$76 – Sellers – 2.17:1, -6.01% From Current Price Level
$75 – Even – 1:1, -7.25% From Current Price Level
$74 – Sellers – 1.8:1, -8.48% From Current Price Level
$73 – Sellers – 4:1, -9.72% From Current Price Level
$72 – Buyers – 1:0*, -10.96% From Current Price Level
$71 – Buyers – 6.5:1, -12.19% From Current Price Level
$70 – Buyers – 2.25:1, -13.43% From Current Price Level
$69 – Buyers – 1.54:1, -14.67% From Current Price Level
$68 – Sellers – 1.19:1, -15.9% From Current Price Level
$67 – Sellers – 1.2:1, -17.14% From Current Price Level
$66 – Buyers – 1.33:1, -18.38% From Current Price Level
$65 – Buyers – 1.47:1, -19.61% From Current Price Level
$64 – Buyers – 1.33:1, -20.85% From Current Price Level
$63 – Buyers – 1.3:1, -22.09% From Current Price Level
$62 – Buyers – 1.08:1, -23.32% From Current Price Level
$61 – Buyers – 1.13:1, -24.56% From Current Price Level
$60 – Sellers – 1.1:1, -25.8% From Current Price Level
$59 – Sellers – 1.17:1, -27.03% From Current Price Level
$58 – Buyers – 1.2:1, -28.27% From Current Price Level
$57 – Sellers – 1.38:1, -29.51% From Current Price Level
$56 – Sellers – 1.11:1, -30.74% From Current Price Level
$55 – Buyers – 1.45:1, -31.98% From Current Price Level
$54 – Buyers – 1.46:1, -33.22% From Current Price Level
$53 – Sellers – 2.75:1, -34.45% From Current Price Level
$52 – Selelrs – 2.33:1, -35.69% From Current Price Level
$51 – NULL – 0:0*, -36.93% From Current Price Level
*** I DO NOT OWN SHARES OR OPTIONS CONTRACT POSITIONS IN XLU AT THE TIME OF PUBLISHING THIS ARTICLE ***
The VIX closed at 16.95, indicating an implied one day move of +/-1.07% & an implied one month move of +/-4.9% for the S&P 500.
Highest Technical Rated S&P 500 Components Per 6/10/2025’s Close:
1 – PLTR
2 – NRG
3 – STX
4 – GEV
5 – AXON
6 – HWM
7 – MU
8 – DG
9 – APH
10 – MCHP
Lowest Technical Rated S&P 500 Components Per 6/10/2025’s Close:
1 – UNH
2 – ENPH
3 – REGN
4 – EIX
5 – SJM
6 – ORLY
7 – LULU
8 – PCG
9 – MRNA
10 – DECK
Highest Volume Rated S&P 500 Components Per 6/10/2025’s Close:
1 – SJM
2 – FE
3 – BRO
4 – TEL
5 – PCG
6 – WAT
7 – INTC
8 – UHS
9 – GE
10 – LYB
Lowest Volume Rated S&P 500 Components Per 6/10/2025’s Close:
1 – SMCI
2 – LDOS
3 – CMI
4 – VLTO
5 – SHW
6 – AIZ
7 – MKTX
8 – CTSH
9 – GLW
10 – AKAM
Highest Technical Rated ETFs Per 6/10/2025’s Close:
1 – JNUG
2 – KORU
3 – DFEN
4 – MEXX
5 – MUU
6 – TARK
7 – CRPT
8 – MULL
9 – BTCL
10 – URAA
Lowest Technical Rated ETFs Per 6/10/2025’s Close:
1 – ETHD
2 – MSOX
3 – TSLZ
4 – TSLQ
5 – SOXS
6 – TSDD
7 – BTCZ
8 – SBIT
9 – NVDQ
10 – NVD
Highest Volume Rated ETFs Per 6/10/2025’s Close:
1 – CCNR
2 – CTEX
3 – THIR
4 – EEMA
5 – CRED
6 – QBER
7 – ROIS
8 – MBBB
9 – GUSA
10 – OEUR
Lowest Volume Rated ETFs Per 6/10/2025’s Close:
1 – NUGO
2 – IMAR
3 – PSMR
4 – NJNK
5 – ASMF
6 – FFIU
7 – OOSP
8 – SHDG
9 – JANZ
10 – TAFL
Highest Technical Rated General Stocks Per 6/10/2025’s Close:
1 – KLTO
2 – RGC
3 – DFDV
4 – CARM
5 – BSGM
6 – MFI
7 – TMPOQ
8 – SBET
9 – BTM
10 – AEVA
Lowest Technical Rated General Stocks Per 6/10/2025’s Close:
1 – CYCC
2 – MULN
3 – AILEQ
4 – HSDT
5 – EJH
6 – GDHG
7 – FMTO
8 – WLGS
9 – ZCAR
10 – NUWE
Highest Volume Rated General Stocks Per 6/10/2025’s Close:
1 – EVGN
2 – GELS
3 – CARM
4 – MEGL
5 – OUT
6 – WHLR
7 – WINT
8 – CNET
9 – BFYW
10 – BODI
Lowest Volume Rated General Stocks Per 6/10/2025’s Close:
1 – NCNA
2 – DBIN
3 – QYOUF
4 – NTBLQ
5 – NBYCF
6 – AILEQ
7 – VASO
8 – VXTRF
9 – CMRZF
10 – LIFFF
*** THE LIST ABOVE IS STRICTLY FOR INFORMATIONAL PURPOSES – I MAY OR MAY NOT HAVE OR INITIATE A LONG, SHORT, OR LONG/SHORT POSITION IN ANY NAME ABOVE AT ANY TIME ***
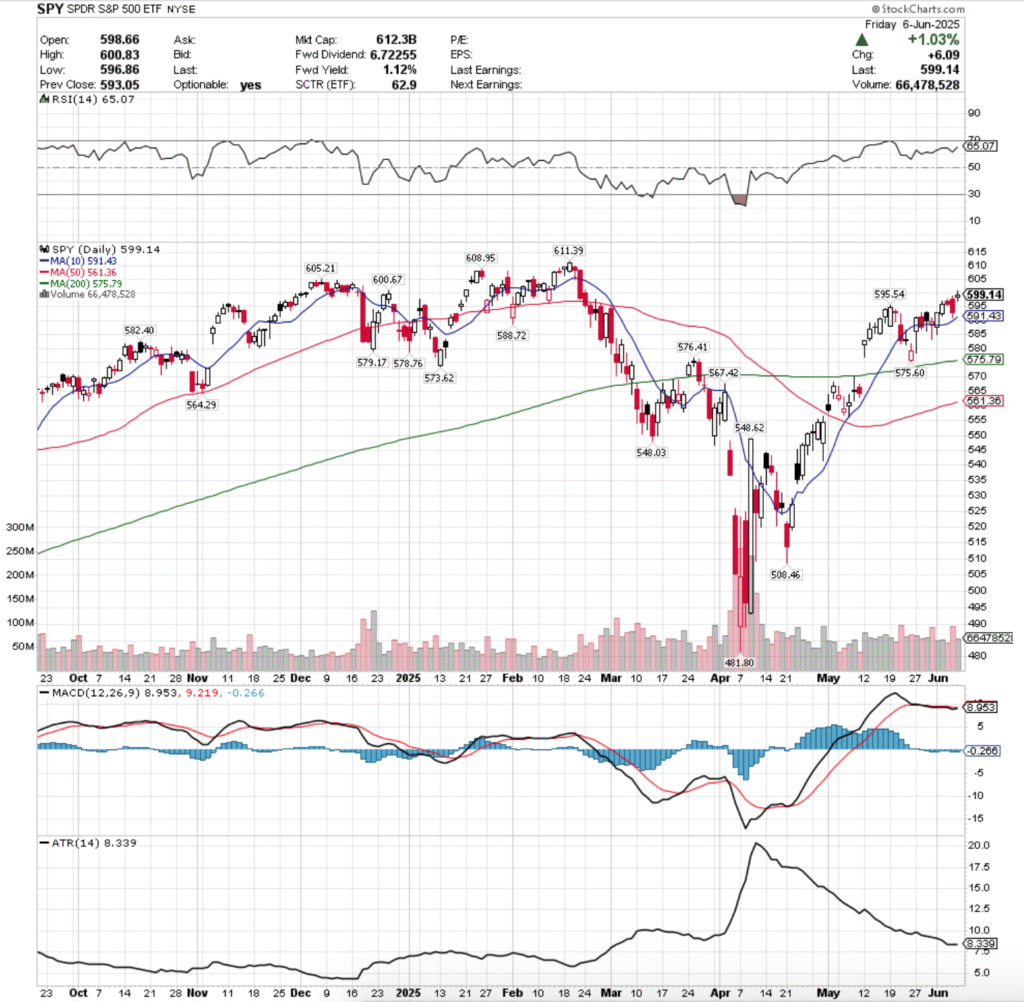
SPY, the SPDR S&P 500 ETF gained +1.65% last week, while the VIX closed the week at 16.77, indicating an implied move of +/-1.06% & an implied one month move of +/-4.85%.
SPY ETF – SPDR S&P 500 ETF’s Technical Performance Over The Past Year
Their RSI is trending higher towards overbought levels, sitting currently at 65.07, while their MACD is bearish, but is relatively flat in the wake of last week’s performance.
Volumes were +19.32% higher than the prior year’s average levels (68,316,000 vs. 57,254,701), which adds an interesting twist to the week, given that the highest volume session was a declining day.
Last week opened up on Monday in-line with the 10 day moving average, temporarily broke down through its support, before rallying into the close to close near the day’s high for a gain of +0.56%.
Tuesday that trend continued, as the session opened near Monday’s close & there was a risk-on appetite & SPY managed to close out +0.57%.
Wednesday is where trouble began to brew for SPY & market participants began to show a bit of anxiety & uncertainty, as the week’s lowest volume session resulted in a spinning top candle & closed -0.03% lower on the day after a gap up open.
The indecision marked by the spinning top is important, as SPY was <1% from that key resistance level of $600.67/share that we pointed out last week as an area of interest.
Thursday continued this, as SPY opened higher, before declining -0.48% on the strongest volume of the week & forming a bearish engulfing pattern with Wednesday’s candle.
While the support of the 10 day moving average managed to hold up, the day’s lower shadow indicates that there was a bit of unease among market participants & cracks were beginning to form.
Friday opened on a gap higher, but closed as a spinning top, indicating that there was quite a bit of indecision & uncertainty heading into the weekend, even though the session advanced +1.03%.
Friday’s high was able to temporarily break just above the previously noted $600.68/share resistance level, but was unable to gain any type of footing there & declined to close below it.
Heading into the new week, that will be a key area for any upside potential, as it is the gatekeeper for SPY’s all-time highs.
This level will likely be at least retested in the coming week, and as mentioned in prior months there will need to be a significant increase in consistent advancing volume to break above this resistance level.
Data for historic volume sentiment at these levels are skewed towards Buyers because of the nature of all-time highs, so it will require a more hands on approach to viewing trends in volume in the next week for any upside price movements.
There is a great deal of focus on today’s trade meeting between the US & China in London, as well as inflation data that comes in the form of CPI & PPI later this week.
There are also going to be clues about the state of the consumer when J.M. Smucker & Chewy report earnings, and Oracle’s report may also have potential to move the market in the short-term.
However, given that the Fed speakers have mostly all hinted at rates staying higher for longer/being in no rush to cut rates based on current data, it is difficult to see much of an upside catalyst in the near-term.
The consolidation case for SPY continues to be oscillations around the 10 day moving average until there is an upside or downside catalyst to force a breakout.
In the event that this is the way things play out, there is reason to watch the 50 day moving average’s approach to the 200 DMA, as a golden cross here may provide a temporary bump to SPY’s price as the medium-term trendline crosses over the long-term trend line bullishly.
In the event that his happens, pay attention to day-over-day volume trends to gain insight into how market participants are positioning themselves & what the future sentiment is likely to be.
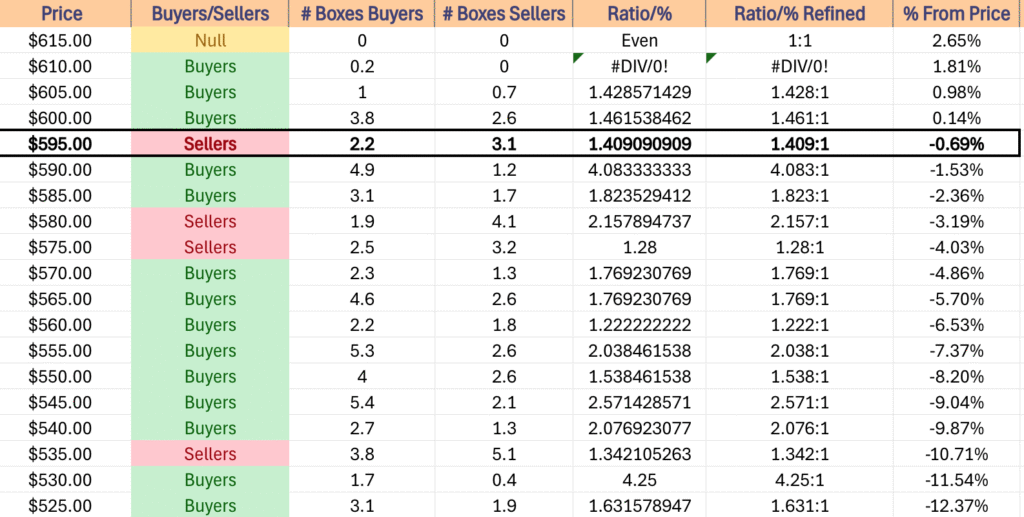
To the downside there is an interesting set up, as over the past ~3 years the price zone that SPY is in has historically been dominated by the Sellers.
In the event that this trend continued they find support at the 10 day moving average, which is in a Buyer zone, as is their next support level as well.
Should these get tested though, the significance of the short-term trendline breaking down may force more selling in SPY (particularly if that 50 DMA golden cross doesn’t occur in the meantime) which then puts SPY’s next (4th) support level in a Seller zone.
In the event of decline, look at the 200 DMA’s support level, which sits -3.9% from the closing price of Friday’s session.
If the long-term trend is tested again & doesn’t hold up, we are likely going to see continued declines in the near-to-mid term.
The table below provides more volume sentiment data that may be useful in assessing the strength/weakness of support/resistance levels in re-tests.
SPY has support at the $595.54 (Volume Sentiment: Sellers, 1.41:1), $591.43 (10 Day Moving Average, Volume Sentiment: Buyers, 4.08:1), $588.72 (Volume Sentiment: Buyers, 1.82:1) & $582.40/share (Volume Sentiment: Sellers, 2.16:1) price levels, with resistance at the $600.67 (Volume Sentiment: Buyers, 1.46:1), $605.21 (Volume Sentiment: Buyers, 1.43:1), $608.95 (Volume Sentiment: Buyers, 1.43:1) & $611.39/share (All-Time High, Volume Sentiment: Buyers, 1.43:1) price levels.
SPY ETF’s Price Level:Volume Sentiment Over The Past ~3 Years
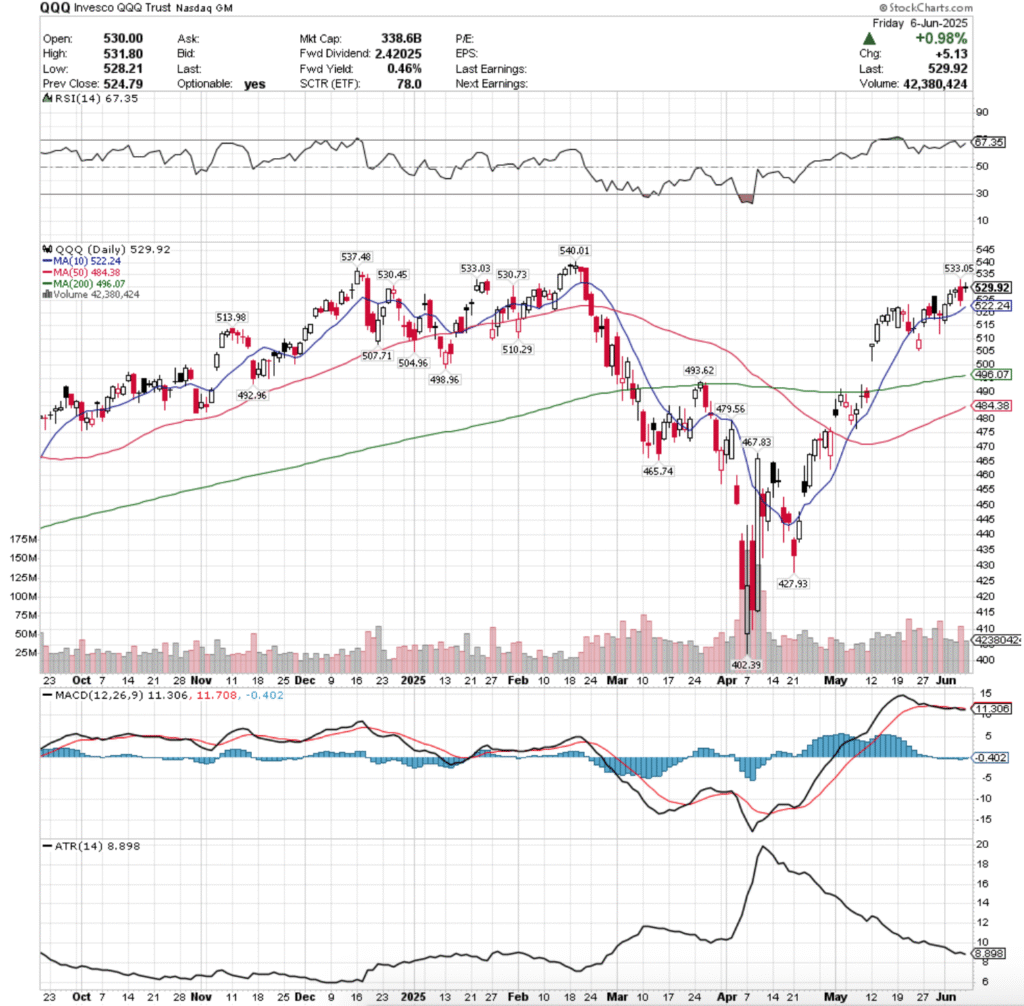
QQQ, the Invesco QQQ Trust ETF added +2.08% last week, as the tech-heavy index was able to muster some gains while closing in on its all-time high.
QQQ ETF – Invesco QQQ Trust ETF’s Technical Performance Over The Past Year
Their RSI is advancing towards the overbought level of 70, sitting currently at 67.35, while their MACD is bearish, but moving relatively flat after last week’s performance.
Volumes were +22.86% higher than the prior year’s average levels (46,790,000 vs. 38,083,028), which like SPY’s above has a little air of caution around it.
Monday QQQ opened just below the resistance of the 10 day moving average, but was able to break above it & close for an advancing session on the week’s second highest volume (highest for advancing sessions).
Tuesday opened on a gap higher & the march higher continued throughout the session, with the small lower shadow & longer upper shadow indicating that there had been a bit of profit taking during the session.
Wednesday though signaled a tale of caution on the horizon, as market participants began to be a little uneasy about how close QQQ had approached its all-time high & the session opened on a gap up, but closed as a hanging man candle (bearish).
Thursday confirmed this sentiment, when a gap higher open tested higher to reach $533.05/share, before profit taking commenced & QQQ formed a bearish engulfing pattern on a declining session with the week’s highest volume & QQQ closed down -0.75%.
The high volume can certainly be attributed to short-term & intraday profit taking, but it also is beginning to look like market participants are beginning to show signs of nervousness, as Friday’s candle showed.
Friday wound the week down in an interesting manner, as despite the session closing up +0.98%, there were many signs of weakness heading into the weekend.
Firstly, the session closed as a doji that’s real body was contained in the upper portion of Wednesday’s candle.
While the session advanced day-over-day, it closed lower than it opened, owing the adance to the jump in opening price from Thursday’s close.
This formed a bearish harami cross, indicating that there is still quite a bit of negative sentiment out there for QQQ & that there was a limited amount of risk being willing to be taken into the weekend.
This week, to the upside QQQ is still below the $530-530.99 & $533-533.99/share resistance zones as of Friday’s close, which will be the primary target to watch.
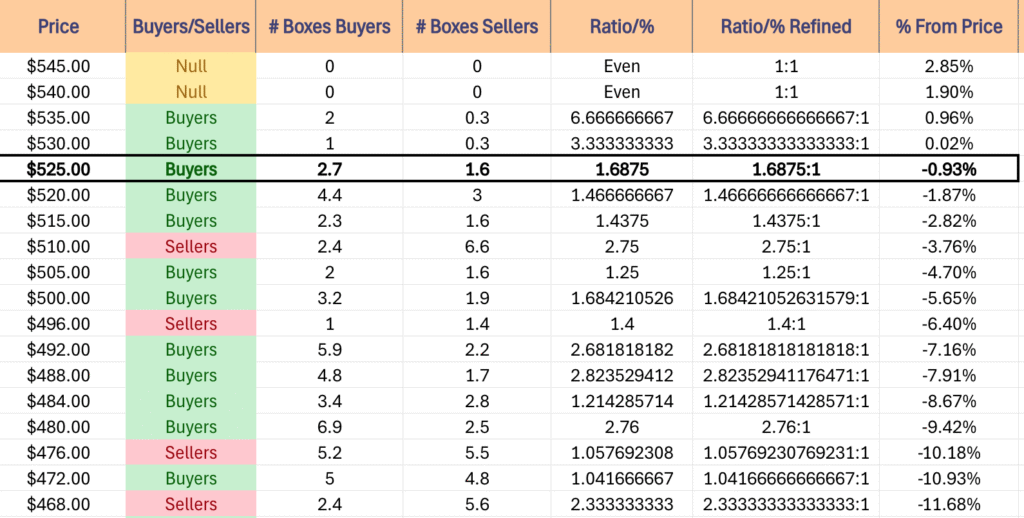
The good news, is that there is Buyer sentiment historically in these zones, but the bad news is that it is attributed to the fact that they’re so close to QQQ’s all-time high, so the ratio will ultimately be diluted over time & re-tests.
Like SPY, there will need to be sustainable, higher advancing volumes in the coming week to power through those zones higher & should they be broken above but volumes are weak the rally should be viewed with skeptical brow.
It will also be wise to watch the 50 DMA as it approaches the 200 DMA, as in the event of a golden cross there may be a bump to the upside as the mdeium-term trendline crosses bullishly through the long-term trend line.
The consolidation case is still oscillations around the 10 day moving average, with a keen eye open in the event that we see an island top from the gap in early May.
In the event that there is downside movement, look to see that window be filled, with a re-test of the 200 day moving average likely, especially given the Seller pressure below Friday’s closing price.
Should we get one, the 200 DMA is in a Seller dominated zone historically, which adds a bit of trouble for the long-term trend.
The table below can help assess the strength/weakness of QQQ’s support/resistance levels in the event of re-tests.
QQQ has support at the $522.24 (10 Day Moving Average, Volume Sentiment: Buyers, 1.47:1), $513.98 (Volume Sentiment: Sellers, 2.75:1), $510.29 (Volume Sentiment: Sellers, 2.75:1) & $507.71/share (Volume Sentiment: Buyers, 1.25:1) price levels, with resistance at the $530.45 (Volume Sentiment: Buyers, 3.33:1), $530.73 (Volume Sentiment: Buyers, 3.33:1), $533.03 (Volume Sentiment: Buyers, 3.33:1) & $533.05/share (Volume Sentiment: Buyers, 3.33:1) price levels.
QQQ ETF’s Price Level:Volume Sentiment Over The Past ~1 Year
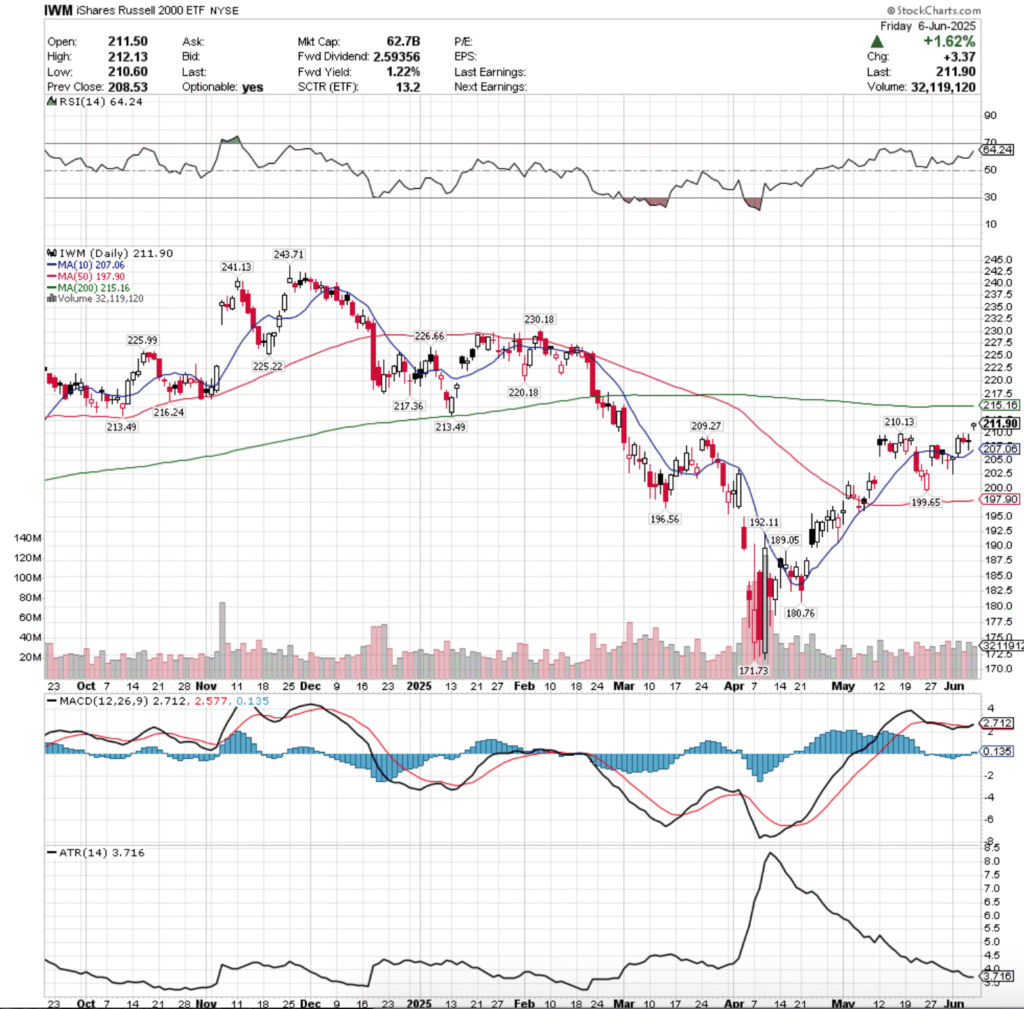
IWM, the iShares Russell 2000 ETF advanced +3.33% last week, faring the strongest of the major four index ETFs after a few slumping weeks at the back of the pack.
IWM ETF – iShares Russell 2000 ETF’s Technical Performance Over The Past Year
Their RSI is trending higher towards overbought levels, sitting currently at 64.24, while their MACD crossed over bullishly on Friday on account of the day’s gap up session.
Volumes were +7.83% higher than the prior year’s average (32,636,000 vs. 30,265,697), which while IWM advanced the most last week, is not necessarily a great picture given the gappy nature of the week.
Monday the small cap index opened below the 10 DMA, tested down to ~$202.50, before ending the day as a hammer candle & signaling that there was a bit of juice in the tank for IWM after weeks of underperforming the 3 other majors.
Tuesday opened on a gap up, tested briefly down to the support of the 10 day moving average, before powering higher on the highest volume of the week.
Wednesday saw some profits taking after the gains of the previous two days, as the day’s high was $210.01 & from there saw losses, closing down day-over-day -0.28%.
Wednesday’s volume was the lowest of the week, but given the underperformance that IWM has had relative to the other major indexes that’s not necessarily a bad sign.
Thursday saw another high volume session similar to Monday’s, but the day closed +0.04% as a doji, indicating that there was a bit of uncertainty looming over IWM.
This was confirmed Friday when IWM opened on a gap up, stayed within a relatively tight range for the day & closed out as a hanging man.
This indicated that there was not much interest in carrying risk into the weekend, and also formed a window that will need to be closed in the coming week(s).
The upside case for IWM moving forward relies around whether or not they can break above the 200 day moving average, changing their long-term trend.
This brings with itself some challenges, as the 200 DMA & the resistance level between it & the price both reside in Seller dominated price zones, which will require a bit of advancing volume to get through.
The consolidation case looks currently like oscillations around the 10 DMA, dipping into the window caused by Friday & breaching closer to the 200 DMA until we see a downside or upside catalyst.
The downside case occurs if there is some declining momentum as IWM fills Friday’s gap, which in turn would turn attention to he $199.65/share support level & the 50 day moving average.
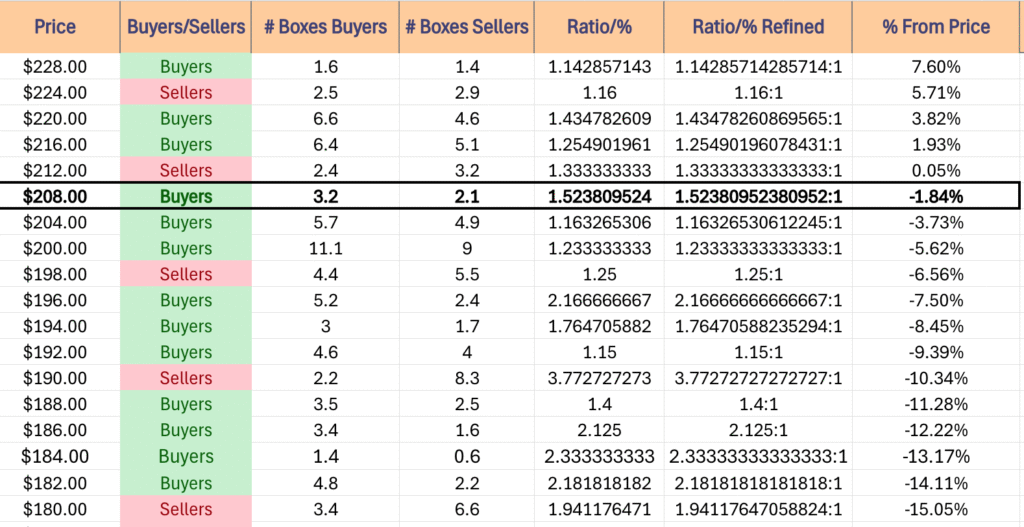
IWM has support at the $210.13 (Volume Sentiment: Buyers, 1.52:1), $209.27 (Volume Sentiment: Buyers, 1.52:1), $207.06 (10 Day Moving Average, Volume Sentiment: Buyers, 1.16:1) & $199.65/share (Volume Sentiment: Sellers, 1.25:1) price levels, with resistance at the $213.49* (2 Touch-Points, Volume Sentiment: Sellers, 1.33:1), $215.16 (200 Day Moving Average, Volume Sentiment: Sellers, 1.33:1), $216.24 (Volume Sentiment: Buyers, 1.26:1) & $217.36/share (Volume Sentiment: Buyers, 1.26:1) price levels.
IWM ETF’s Price Level:Volume Sentiment Over The Past ~2-3 Years
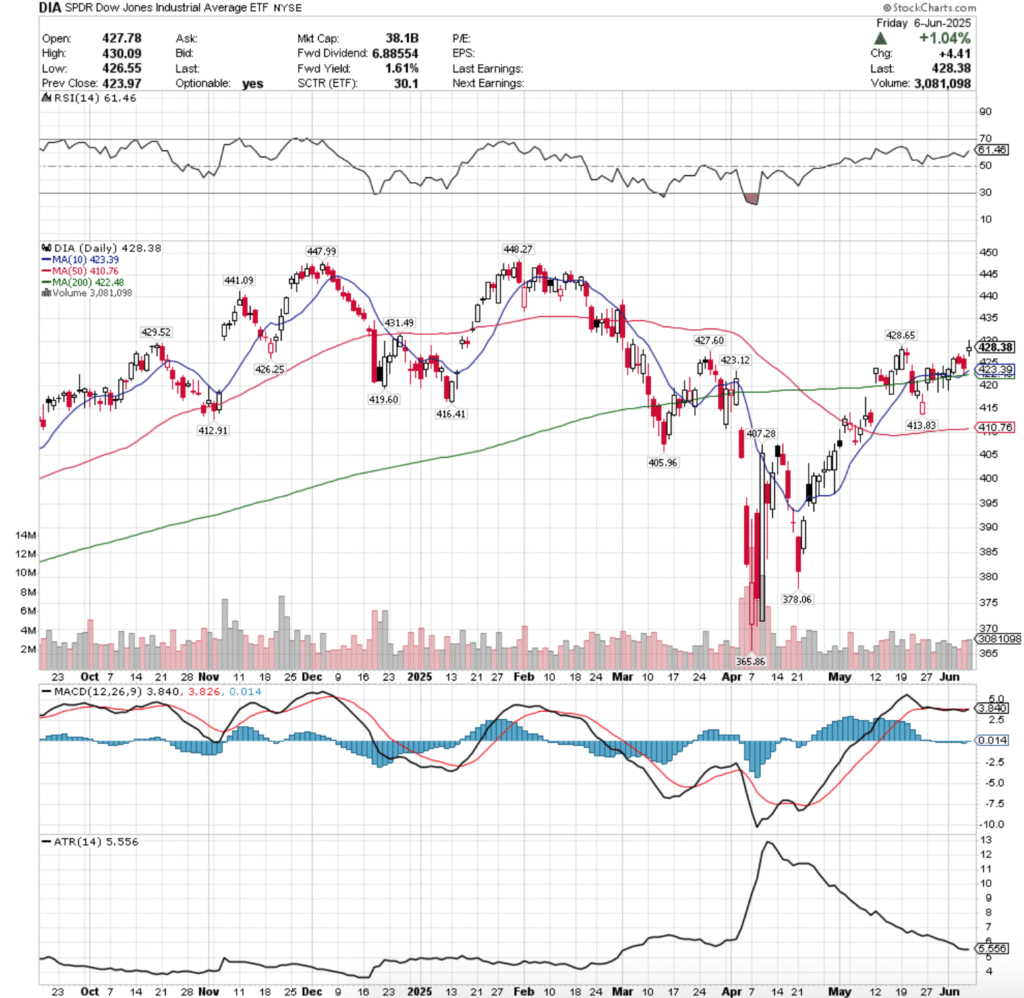
DIA ETF – SPDR Dow Jones Industrial Average ETF’s Technical Performance Over The Past Year
Their RSI is climbing higher & currently at 61.46, while their MACD is bearish but flat after the consolidation period of most of May that DIA’s been in.
Volumes were -16.28% lower than the prior year’s average (2,652,000 vs. 3,167,729), indicating that the “Buy & Hold” sentiment mentioned in the previous few weeks’ notes is still alive & well as the blue chip index investors are in a state of uncertainty.
DIA began the week just below its 10 day moving average’s resistance, tested below $420/share, before advancing to break out above all of its moving averages.
Tuesday followed suit & tested lower briefly, but support of the 10 & 200 DMA’s held up, enabling DIA to advance & close above $425/share.
Wednesday exposed that there was still some doubts about DIA’s strength, as the session opened higher, but profit taking quickly forced prices lower for a declining session.
Thursday was much the same, but market participants didn’t let DIA cross bearishly across the 10 & 200 day moving averages, but the day resulted in a decline, as the profit taking fueled the second highest volume session of the week.
Friday looked an awful lot like IWM’s chart (not surprising, as we’ve been noting now here weekly it seems), where DIA opened on a gap up, temporarily broke above the $430/share level, but ended the session as a spinning top candle on the week’s highest volume.
While that participation rate heading into a weekend might be seen by some as a sign of optimism & bullishness, looking at the declining volume of the two prior days doesn’t inspire a lot of confidence.
To the upside, the $428.65/share level will be an area of interest, along with the $429.52 & $431.49/share price levels.
These are historically Buyer dominated levels, but DIA has been more skewed towards Buyers in general as the Blue Chip index has maintained demand over the years as a safer haven than other indexes.
In the event that these levels are broken through, the $440-443.99/share zone is Seller dominated historically, which will pose an interesting problem for DIA, as it is the gatekeeper to their all-time high.
The consolidation case here looks interesting, as it involved oscillations around the 10 & 200 DMA’s simultaneously, awaiting the catalyst to the upside or the downside.
The overall market sentiment will be especially apparent based on what happens should that situation occur, as the proximity between the long & short term trend lines is quite narrow.
Any move towards the downside will be interesting to watch, as there’s solid Buyer sentiment at their next two support levels, before the following two enter Seller territory, and then the 50 day moving average comes into view.
If the 50 DMA is tested & breaks down, the $405.96/share level is the next place to begin looking for DIA, but this of course assumes a decline.
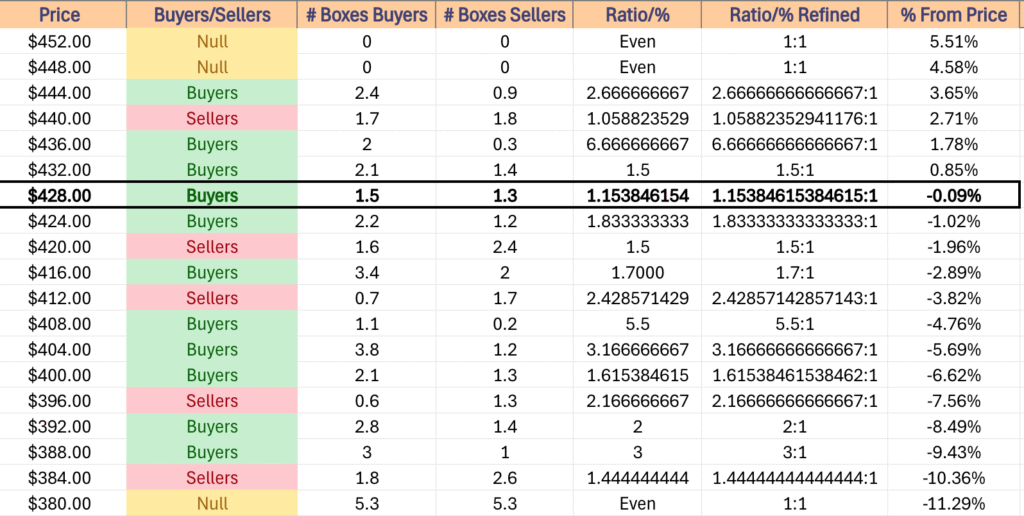
DIA has support at the $427.60 (Volume Sentiment: Buyers, 1.83:1), $426.25 (Volume Sentiment: Buyers, 1.83:1), $423.39 (10 Day Moving Average, Volume Sentiment: Sellers, 1.5:1) & $423.12/share (Volume Sentiment: Sellers, 1.5:1) price levels, with resistance at the $428.69 (Volume Sentiment: Buyers, 1.15:1), $429.52 (Volume Sentiment: Buyers, 1.15:1), $431.49 (Volume Sentiment: Buyers, 1.15:1) & $441.09/share (Volume Sentiment: Sellers, 1.06:1) price levels.
DIA ETF’s Price Level:Volume Sentiment Over The Past ~4-5 Years
The Week Ahead
Monday kicks the new week off with Wholesale Inventories data at 10 am.
Calavo Growers & Casey’s General report earnings after Monday’s close.
NFIB Optimism Index data is released on Tuesday at 6 am.
Academy Sports + Outdoors, Core & Main, J.M. Smucker & United Natural Foods report earnings before Tuesday’s opening bell, with GameStop, Dave & Buster’s, GitLab & Stitch Fix all reporting after the session’s close.
Wednesday gives us insight into inflation with Consumer Price Index, Core CPI, CPI Year-over-Year & Core CPI Year-over-Year data at 8:30 am, before Monthly U.S. Federal Budget data at 2pm.
Chewy & SailPoint report earnings before Wednesday’s opening bell, followed by Oracle & Oxford Industries after the closing bell.
Initial Jobless Claims, Producer Price Index, Core PPI, PPI Year-over-Year & Core PPI YEar-over-Year data are released Thursday at 8:30 am.
Lovesac reports earnings on Thursday before the session opens, followed by Adobe & RH after the session’s close.
Friday the week winds down with Consumer Sentiment (prelim) data at 10 am.
There are no major earnings reports due out of Friday.
See you back here next week!
*** I DO NOT OWN SHARES OR OPTIONS CONTRACT POSITIONS IN SPY, QQQ, IWM OR DIA AT THE TIME OF PUBLISHING THIS ARTICLE ***
The VIX closed at 16.77, indicating an implied one day move of +/-1.06% & an implied one month move of +/-4.85% for the S&P 500.
Highest Technical Rated S&P 500 Components Per 6/6/2025’s Close:
1 – PLTR
2 – NRG
3 – GEV
4 – AXON
5 – HWM
6 – STX
7 – DG
8 – GE
9 – VST
10 – APH
Lowest Technical Rated S&P 500 Components Per 6/6/2025’s Close:
1 – UNH
2 – ENPH
3 – REGN
4 – ARE
5 – MRNA
6 – DOW
7 – DECK
8 – CZR
9 – BLDR
10 – LYB
Highest Volume Rated S&P 500 Components Per 6/6/2025’s Close:
1 – LULU
2 – PCG
3 – MOS
4 – WEC
5 – HUM
6 – POOL
7 – COO
8 – CMS
9 – AVGO
10 – ELV
Lowest Volume Rated S&P 500 Components Per 6/6/2025’s Close:
1 – CVS
2 – VLTO
3 – NOC
4 – IDXX
5 – JBHT
6 – DGX
7 – MPWR
8 – IFF
9 – WBA
10 – HCA
Highest Technical Rated ETFs Per 6/6/2025’s Close:
1 – JNUG
2 – DFEN
3 – ROBN
4 – HOOX
5 – HOOG
6 – KORU
7 – RBLU
8 – MEXX
9 – CRPT
10 – URAA
Lowest Technical Rated ETFs Per 6/6/2025’s Close:
1 – MSOX
2 – ETHD
3 – HZEN
4 – SOXS
5 – NVDQ
6 – NVD
7 – JDST
8 – TSLZ
9 – TSLQ
10 – TSDD
Highest Volume Rated ETFs Per 6/6/2025’s Close:
1 – LSVD
2 – MCHS
3 – GPRF
4 – LFAN
5 – LFAJ
6 – LFAO
7 – LFAK
8 – FGSM
9 – FINT
10 – FLCE
Lowest Volume Rated ETFs Per 6/6/2025’s Close:
1 – EMCS
2 – JEMB
3 – UNIY
4 – NUGO
5 – HYXF
6 – DECZ
7 – PSQO
8 – HYDW
9 – IMAR
10 – XHYI
Highest Technical Rated General Stocks Per 6/6/2025’s Close:
1 – EGIOQ
2 – RGC
3 – BSGM
4 – SBET
5 – MYNAY
6 – NAKA
7 – DFDV
8 – ROMA
9 – MFI
10 – SVT
Lowest Technical Rated General Stocks Per 6/6/2025’s Close:
1 – MULN
2 – CYCC
3 – DGLY
4 – EJH
5 – GDHG
6 – FMTO
7 – HSDT
8 – ZCAR
9 – SUNE
10 – OMH
Highest Volume Rated General Stocks Per 6/6/2025’s Close:
1 – DTCK
2 – VERO
3 – DEA
4 – ELBM
5 – WBUY
6 – BRLS
7 – KNW
8 – BJDX
9 – PVBC
10 – BMNM
Lowest Volume Rated General Stocks Per 6/6/2025’s Close:
1 – OMTK
2 – TSGZF
3 – FFBW
4 – YYGH
5 – GVH
6 – CBDBY
7 – AHOTF
8 – FNRN
9 – BTSGU
10 – DSNY
*** THE LIST ABOVE IS STRICTLY FOR INFORMATIONAL PURPOSES – I MAY OR MAY NOT HAVE OR INITIATE A LONG, SHORT, OR LONG/SHORT POSITION IN ANY NAME ABOVE AT ANY TIME ***
The VIX closed at 18.48, indicating an implied one day move of +/-1.17% & an implied one month move of +/-5.34% for the S&P 500.
Highest Technical Rated S&P 500 Components Per 6/5/2025’s Close:
1 – NRG
2 – GEV
3 – PLTR
4 – AXON
5 – STX
6 – HWM
7 – AVGO
8 – DG
9 – NFLX
10 – APH
Lowest Technical Rated S&P 500 Components Per 6/5/2025’s Close:
1 – UNH
2 – ENPH
3 – REGN
4 – MRNA
5 – ARE
6 – DOW
7 – DECK
8 – LYB
9 – COO
10 – TECH
Highest Volume Rated S&P 500 Components Per 6/5/2025’s Close:
1 – TSLA
2 – DLTR
3 – COO
4 – NCLH
5 – LULU
6 – WEC
7 – TSCO
8 – LYV
9 – PCG
10 – AVGO
Lowest Volume Rated S&P 500 Components Per 6/5/2025’s Close:
1 – URI
2 – GEHC
3 – ALGN
4 – EW
5 – ROST
6 – NVR
7 – XEL
8 – HSIC
9 – DGX
10 – CHRW
Highest Technical Rated ETFs Per 6/5/2025’s Close:
1 – JNUG
2 – DFEN
3 – NUGT
4 – KORU
5 – HOOX
6 – HOOG
7 – ROBN
8 – RBLU
9 – GOEX
10 – GDXJ
Lowest Technical Rated ETFs Per 6/5/2025’s Close:
1 – MSOX
2 – ETHD
3 – HZEN
4 – JDST
5 – SOXS
6 – NVDQ
7 – NVD
8 – FIAT
9 – YANG
10 – OSOL
Highest Volume Rated ETFs Per 6/5/2025’s Close:
1 – BHYB
2 – MVPL
3 – QQQP
4 – NJNK
5 – SPYQ
6 – LDEM
7 – IPAV
8 – SNPD
9 – OGSP
10 – NPFI
Lowest Volume Rated ETFs Per 6/5/2025’s Close:
1 – NUGO
2 – PBFR
3 – PSCW
4 – SLNZ
5 – KVLE
6 – AUGP
7 – DUKZ
8 – FIXP
9 – CCSB
10 – XCLR
Highest Technical Rated General Stocks Per 6/5/2025’s Close:
1 – AMPE
2 – RGC
3 – SBET
4 – NAKA
5 – NCL
6 – BSGM
7 – MFI
8 – ASST
9 – LYRA
10 – FMST
Lowest Technical Rated General Stocks Per 6/5/2025’s Close:
1 – MULN
2 – DGLY
3 – GDHG
4 – CYCC
5 – EJH
6 – FMTO
7 – ZCAR
8 – SUNE
9 – REVB
10 – CDT
Highest Volume Rated General Stocks Per 6/5/2025’s Close:
1 – SCNI
2 – AIHS
3 – HSDT
4 – WHLR
5 – ZJK
6 – CTNT
7 – IPW
8 – ZBAI
9 – RVYL
10 – NUVR
Lowest Volume Rated General Stocks Per 6/5/2025’s Close:
1 – AVCNF
2 – MTLFF
3 – FFBW
4 – GVH
5 – CTHR
6 – BNPQF
7 – MFGCF
8 – AXDDF
9 – WETH
10 – CMLS
*** THE LIST ABOVE IS STRICTLY FOR INFORMATIONAL PURPOSES – I MAY OR MAY NOT HAVE OR INITIATE A LONG, SHORT, OR LONG/SHORT POSITION IN ANY NAME ABOVE AT ANY TIME ***