The VIX closed at 19.21, indicating an implied one day move of +/-1.21% & a one month implied move of +/-5.55% for the S&P 500.
Highest Technical Rated S&P 500 Components Per 10/4/2024’s Close:
1 – VST
2 – CEG
3 – PLTR
4 – AXON
5 – NRG
6 – UAL
7 – ORCL
8 – ERIE
9 – TRGP
10 – HWM
Lowest Technical Rated S&P 500 Components Per 10/4/2024’s Close:
1 – MRNA
2 – HUM
3 – SMCI
4 – WBA
5 – DLTR
6 – DG
7 – DXCM
8 – INTC
9 – BEN
10 – BIIB
Highest Volume Rated S&P 500 Components Per 10/4/2024’s Close:
1 – CPAY
2 – CNP
3 – REGN
4 – HUM
5 – ALB
6 – FANG
7 – MCO
8 – CVS
9 – VST
10 – UAL
Lowest Volume Rated S&P 500 Components Per 10/4/2024’s Close:
1 – SW
2 – FMC
3 – K
4 – WST
5 – DD
6 – HSIC
7 – SMCI
8 – ERIE
9 – FOX
10 – CVTA
Highest Technical Rated ETFs Per 10/4/2024’s Close:
1 – YINN
2 – BABX
3 – CWEB
4 – CHAU
5 – XPP
6 – CNXT
7 – KSTR
8 – MCH
9 – CQQQ
10 – KTEC
Lowest Technical Rated ETFs Per 10/4/2024’s Close:
1 – YANG
2 – FXP
3 – NVDQ
4 – NVD
5 – GXLM
6 – TSLZ
7 – TSDD
8 – MRNY
9 – SSG
10 – CONL
Highest Volume Rated ETFs Per 10/4/2024’s Close:
1 – XHYC
2 – XHYI
3 – XHYT
4 – TBFC
5 – XHYF
6 – HYDW
7 – MBBB
8 – FLDB
9 – GENM
10 – BHYB
Lowest Volume Rated ETFs Per 10/4/2024’s Close:
1 – USCL
2 – NUSB
3 – CBLS
4 – XDJL
5 – GVUS
6 – UNIY
7 – JUNZ
8 – EVUS
9 – USIN
10 – SXQG
Highest Technical Rated General Stocks Per 10/4/2024’s Close:
1 – CHSN
2 – STRM
3 – BASSA
4 – SIFY
5 – CAPR
6 – DUO
7 – TIGR
8 – UXIN
9 – QUEXF
10 – JG
Lowest Technical Rated General Stocks Per 10/4/2024’s Close:
1 – ADTX
2 – MULN
3 – CETX
4 – WTO
5 – SLXN
6 – VMAR
7 – WINT
8 – VTNR
9 – NDRA
10 – ICDI
Highest Volume Rated General Stocks Per 10/4/2024’s Close:
1 – FORD
2 – SNAL
3 – PEV
4 – ADTX
5 – BENF
6 – MAMA
7 – ENTO
8 – CHSN
9 – CETX
10 – NSA
Lowest Volume Rated General Stocks Per 10/4/2024’s Close:
1 – BRYFF
2 – AVCNF
3 – CTSDF
4 – CIAFF
5 – FXLV
6 – BRTX
7 – BTSGU
8 – GIKLY
9 – BSBK
10 – XCUR
*** THE LIST ABOVE IS STRICTLY FOR INFORMATIONAL PURPOSES – I MAY OR MAY NOT HAVE OR INITIATE A LONG, SHORT, OR LONG/SHORT POSITION IN ANY NAME ABOVE AT ANY TIME ***
The VIX closed at 18.9, indicating an implied one day move of +/-1.19% & an implied one month move of +/-5.46% for the S&P 500.
Highest Technical Rated S&P 500 Components Per 10/2/2024’s Close:
1 – VST
2 – CEG
3 – PLTR
4 – FICO
5 – ERIE
6 – IRM
7 – NRG
8 – ORCL
9 – AXON
10 – HWM
Lowest Technical Rated S&P 500 Components Per 10/2/2024’s Close:
1 – HUM
2 – MRNA
3 – WBA
4 – SMCI
5 – DLTR
6 – DG
7 – DXCM
8 – INTC
9 – LULU
10 – BA
Highest Volume Rated S&P 500 Components Per 10/2/2024’s Close:
1 – HUM
2 – CAG
3 – LW
4 – JNPR
5 – CVS
6 – NKE
7 – CCI
8 – ELV
9 – AME
10 – MTD
Lowest Volume Rated S&P 500 Components Per 10/2/2024’s Close:
1 – SMCI
2 – ERIE
3 – DHR
4 – DELL
5 – GWW
6 – CHRW
7 – CRWD
8 – AVGO
9 – PATC
10 – ALB
Highest Technical Rated ETFs Per 10/2/2024’s Close:
1 – SFY
2 – YINN
3 – BABX
4 – CWEB
5 – XPP
6 – CHAU
7 – CNXT
8 – MCH
9 – KSTR
10 – KTEC
Lowest Technical Rated ETFs Per 10/2/2024’s Close:
1 – YANG
2 – FXP
3 – NVDQ
4 – NVD
5 – TSLZ
6 – TSDD
7 – CONL
8 – GXLM
9 – MRNY
10 – TSLQ
Highest Volume Rated ETFs Per 10/2/2024’s Close:
1 – OCTZ
2 – SHUS
3 – SEPZ
4 – ESGB
5 – SPAQ
6 – RSPE
7 – USCL
8 – MBNE
9 – CNXT
10 – DARP
Lowest Volume Rated ETFs Per 10/2/2024’s Close:
1 – SIO
2 – OVLH
3 – GVUS
4 – NUSB
5 – SHDG
6 – LSGR
7 – JANH
8 – ARP
9 – AZTD
10 – IMSI
Highest Technical Rated General Stocks Per 10/2/2024’s Close:
1 – DUO
2 – LASE
3 – CAPR
4 – TIL
5 – KXIN
6 – QUEXF
7 – TSSI
8 – UXIN
9 – BASA
10 – WLGS
Lowest Technical Rated General Stocks Per 10/2/2024’s Close:
1 – MULN
2 – EDBL
3 – WTO
4 – APDN
5 – SLXN
6 – PEGY
7 – VTNR
8 – UPC
9 – VMAR
10 – TRNR
Highest Volume Rated General Stocks Per 10/2/2024’s Close:
1 – ICCT
2 – API
3 – SLG
4 – TOP
5 – XIN
6 – WHLR
7 – IPDN
8 – EGRX
9 – CNF
10 – PCSA
Lowest Volume Rated General Stocks Per 10/2/2024’s Close:
1 – SMFL
2 – NROM
3 – CNFR
4 – BBSRF
5 – CRSXF
6 – DRRSF
7 – HTCO
8 – CBDBY
9 – FNRN
10 – VASO
*** THE LIST ABOVE IS STRICTLY FOR INFORMATIONAL PURPOSES – I MAY OR MAY NOT HAVE OR INITIATE A LONG, SHORT, OR LONG/SHORT POSITION IN ANY NAME ABOVE AT ANY TIME ***
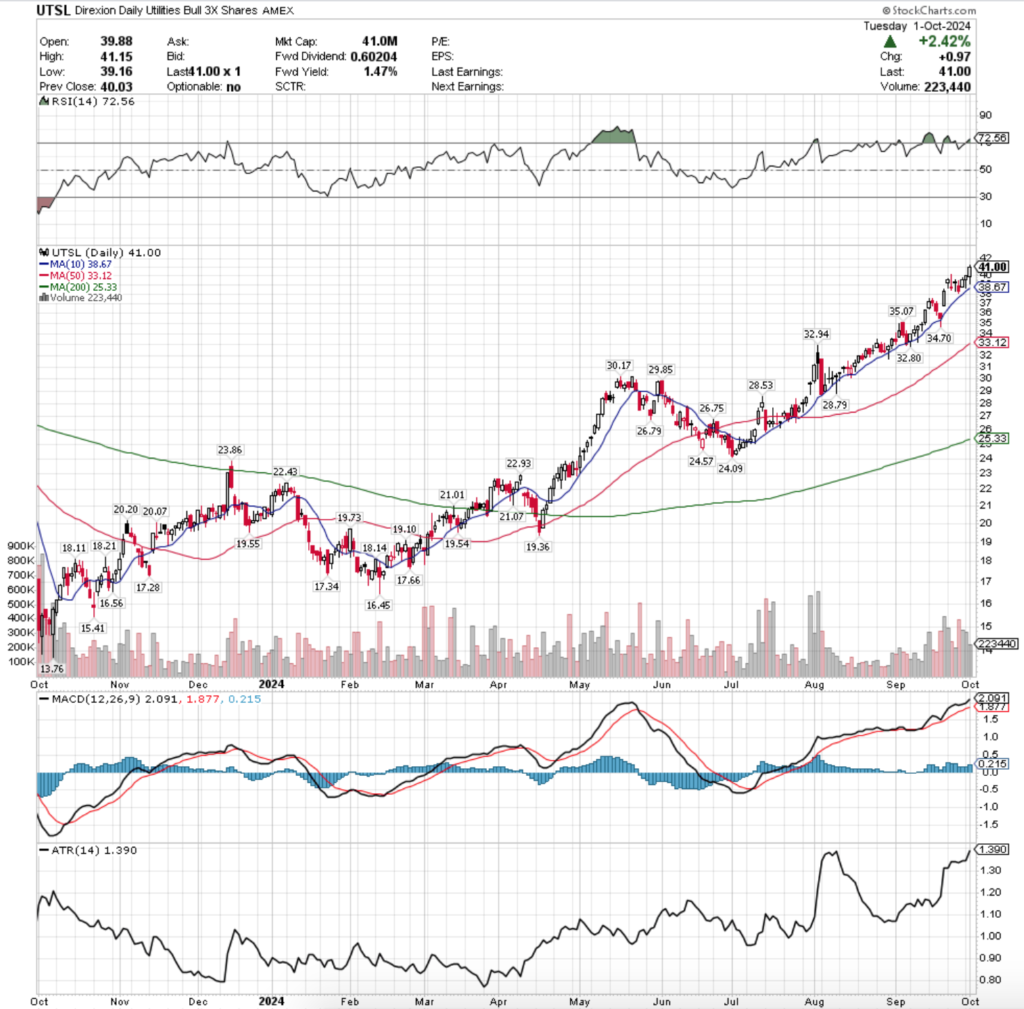
UTSL, the Direxion Daily Utilities Bull 3x Shares ETF has advanced +168.81% over the past year, gaining +190.72% since their 52-week low in October of 2023 & currently sits just -0.32% below their 52-week high which was set today (all figures ex-distributions).
Much of this impressive performance has been driven by A.I. & Data Centers energy requirements as the field is projected to expand dramatically & also in part by recent market volatility & investors seeking safer returns from utilities names with stable performance & solid dividend yields.
Some of UTSL’s top holdings include Nextera Energy (NEE), Southern (S), Duke Energy (DUK), Constellation Energy Corp. (CEG), Sempra Energy (SRE), American Electric Power (AEP), Dominion Energy (D), PG&E (PCG), Public Service Ent (PEG), Exelon Corporation (EXC).
Below is a brief technical analysis of UTSL’s past week & a half, as well as a price level:volume sentiment analysis of the price levels UTSL has traded at over the past ~2 years.
Included in this data is also their recent support & resistance levels so that readers can gain insight into how strong/weak these support/resistance levels may be in the future, based on past investor behavior.
It is not intended to serve as financial advice, but rather as an additional tool to reference while performing your own due diligence on UTSL.
Technical Analysis Of UTSL, The Direxion Daily Utilities Bull 3x Shares ETF
UTSL ETF – Direxion Daily Utilities Bull 3x Shares ETF’s Technical Performance Over The Past Year
Their RSI is trending deeper into overbought territory & currently sits at 72.56, while their MACD is still trending bullishly after today’s session set a new 52-week high for UTSL.
Volumes were +46.25% above the prior year’s average volume over the past week & a half (292,697.14 vs. 200,138.1), as investors have been pouring into UTSL after the gap up from two Friday’s ago, and some profit taking along the way up.
Starting with two Friday’s ago, following three straight days of declines that saw the 10 day moving average’s support be temporarily broken through, investors piled into UTSL forcing a gap up session on the highest volume seen since the beginning of August.
This sentiment carried into last week when Monday too opened on a gap higher with strong volume, although there was some profit taking as shown by the lower shadow of the session’s candle & some reasons for caution early in the week.
Tuesday confirmed this uncertain sentiment as the session opened on a gap lower, traded higher above Monday’s range, but ultimately all roads led to a daily decline.
Much of this is likely to be due to profit taking after such a dramatic climb in two days, but the spinning top candle indicated that there was still uncertainty among market participants.
Wednesday opened on another gap higher, but wound up testing lower than Tuesday’s session’s lows, only to close higher as a dragonfly doji, indicating that there was still appetite for UTSL to go higher despite all of the uncertainty surrounding it.
There was additional bearish sentiment to Wednesday’s candle in that it closed below where it opened, but the low volume added additional uncertainty to the session.
But first, there was more downside testing & profit taking as Thursday opened on a gap down, made a run up to try to break above Wednesday’s open, only to take the elevator back down & close the day as a declining session.
Thursday’s volume should be noted though, as it was near that of the prior Friday & eclipsed all other sessions going back into the beginning of August & set the stage for a reversal as all of the profit taking was done & sentiment was ready to test higher.
Friday this happened where a high volume session was able to push UTSL higher heading into the weekend, and slight higher appetite was indicated based on the small upper shadow of the day’s candle.
The vote of confidence continued on Monday where similar volumes helped propel UTSL higher, but despite the session closing as an advancing session there was a bit of downside testing & bulls were clearly not in control.
This brought UTSL the closest it’s been to the 10 DMA’s support since Thursday 9/19/2024, but the day continued higher.
The day’s candle resulted in a hanging man, which has bearish implications & may be signaling that there will be more profit taking on the horizon after the run up of the past few days, which is also confirmed by their RSI.
Yesterday this sentiment also continued, as despite having a larger real body than Monday’s (a hanging man candle needs a spinning top for the real body, which is a tighter range) & ending in a +2.42% advance, bears were able to force prices temporarily down closer to the 10 DMA’s support.
In the event of a test lower, UTSL does not have many local support levels, as the closest one is currently the 10 day moving average, which despite moving higher daily is still -5.68% below yesterday’s closing price.
In the event that profit taking leads to a breakdown in price for UTSL, the charts below will shed insight into how investors have viewed UTSL at each price level contained in them over the years.
Price Level:Volume Sentiment Analysis For UTSL, The Direxion Daily Utilities Bull 3x Shares ETF
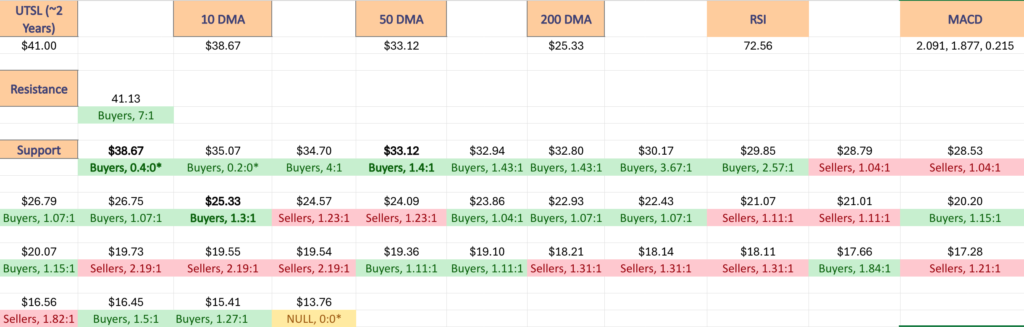
The top table below shows the support & resistance levels of UTSL from the past year’s chart, as well as their price level:volume sentiment at each, using Tuesday 10/1/24’s closing price.
The moving averages are denoted with bold.
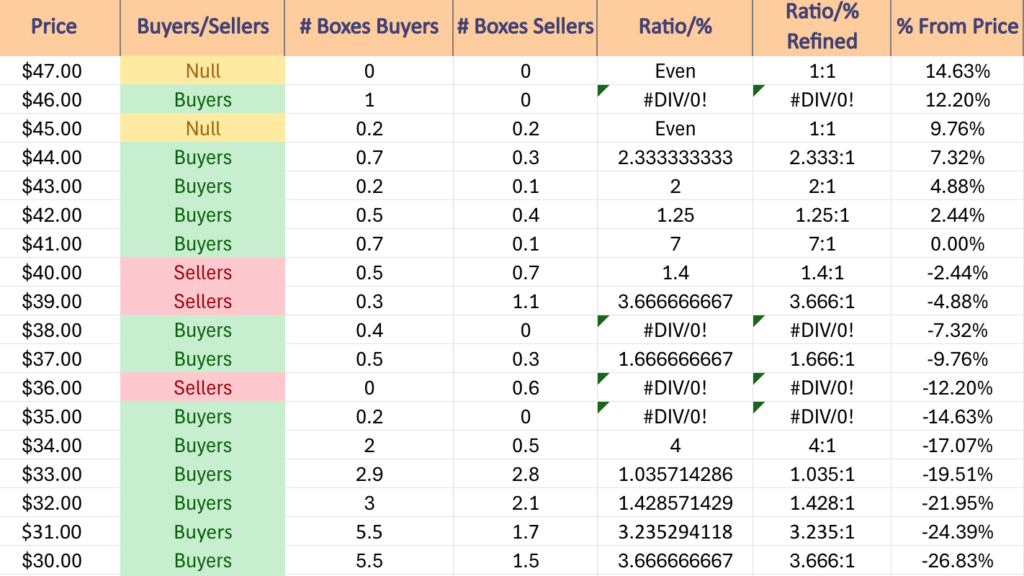
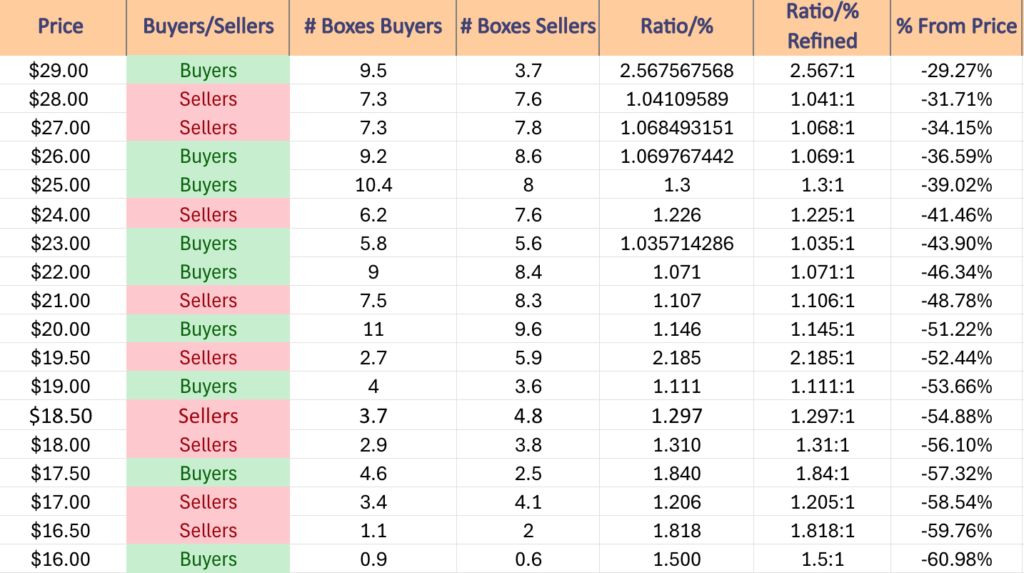
The next charts show the volume sentiment at each individual price level UTSL has traded at over the past ~2 years.
Beneath them is a copy & pasteable list of the same data, where the support/resistance levels are denoted in bold.
All ratios with “0” in the denominator are denoted with a “*”.
NULL values are price levels that had limited trading volume, whether it be due to gaps, quick advances or they are at price extremes; in the event that they are retested & there is more data they would have a distinct “Buyers”, “Sellers” or “Even” title.
This is not intended as financial advice, but rather another tool to consider when performing your own research & due diligence on UTSL ETF.
UTSL ETF’s Price Level:Volume Sentiment Over The Past ~2 Years At 1 Year Support & Resistance Levels
UTSL ETF’s Price Level:Volume Sentiment Over The Past ~2 Years
Price Level:Volume Sentiment For UTSL ETF Over The Past ~2 Years
Price Level:Volume Sentiment For UTSL ETF Over The Past ~2 Years
$47 – NULL – 0:0*, +14.63% From Current Price Level
$46 – Buyers – 1:0*, +12.2% From Current Price Level
$45 – Even, 1:1, +9.76% From Current Price Level
$44 – Buyers – 2.33:1, +7.32% From Current Price Level
$43 – Buyers – 2:1, +4.88% From Current Price Level
$42 – Buyers – 1.25:1, +2.44% From Current Price Level
$41 – Buyers – 7:1, 0.00% From Current Price Level – Current Price Level & 52-Week High**
$40 – Sellers – 1.4:1, -2.44% From Current Price Level
$39 – Sellers – 3.67:1, -4.88% From Current Price Level
$38 – Buyers – 0.4:0*, -7.32% From Current Price Level – 10 Day Moving Average*
$37 – Buyers – 1.67:1, -9.76% From Current Price Level
$36 – Sellers – 0.6:0*,-12.2% From Current Price Level
$35 – Buyers – 0.2:0*, -14.63% From Current Price Level
$34 – Buyers – 4:1, -17.07% From Current Price Level
$33 – Buyers – 1.04:1, -19.51% From Current Price Level – 50 Day Moving Average*
$32 – Buyers – 1.43:1, -21.95% From Current Price Level
$31 – Buyers – 3.24:1, -24.39% From Current Price Level
$30 – Buyers – 3.67:1, -26.83% From Current Price Level
$29 – Buyers – 2.57:1, -29.27% From Current Price Level
$28 – Sellers – 1.04:1, -31.71% From Current Price Level
$27 – Sellers – 1.07:1, -34.15% From Current Price Level
$26 – Buyers – 1.07:1, -36.59% From Current Price Level
$25 – Buyers – 1.3:1, -39.02% From Current Price Level – 200 Day Moving Average*
$24 – Sellers – 1.23:1, -41.46% From Current Price Level
$23 – Buyers – 1.04:1, -43.9% From Current Price Level
$22 – Buyers – 1.07:1, -46.34% From Current Price Level
$21 – Sellers – 1.11:1, -48.78% From Current Price Level
$20 – Buyers – 1.15:1, -51.22% From Current Price Level
$19.50 – Sellers – 2.19:1, -52.44% From Current Price Level
$19 – Buyers – 1.11:1, -53.66% From Current Price Level
$18.50 – Sellers – 1.3:1, -54.88% From Current Price Level
$18 – Sellers – 1.31:1, -56.1% From Current Price Level
$17.50 – Buyers – 1.84:1, -57.32% From Current Price Level
$17 – Sellers – 1.21:1, -58.54% From Current Price Level
$16.50 – Sellers – 1.82:1, -59.76% From Current Price Level
$16 – Buyers – 1.5:1, -60.98% From Current Price Level
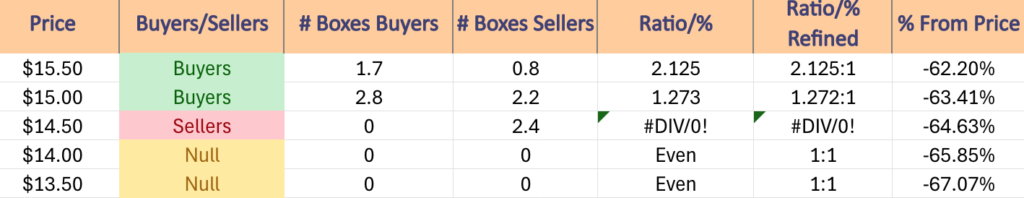
$15.50 – Buyers – 2.13:1, -62.2% From Current Price Level
$15 – Buyers – 1.27:1, -63.41% From Current Price Level
$14.50 – Sellers – 2.4:0*, -64.63% From Current Price Level
$14 – NULL – 0:0*, -65.85% From Current Price Level
$13.50 – NULL – 0:0*, -67.07% From Current Price Level
*** I DO NOT OWN SHARES OR OPTIONS CONTRACT POSITIONS IN UTSL AT THE TIME OF PUBLISHING THIS ARTICLE ***
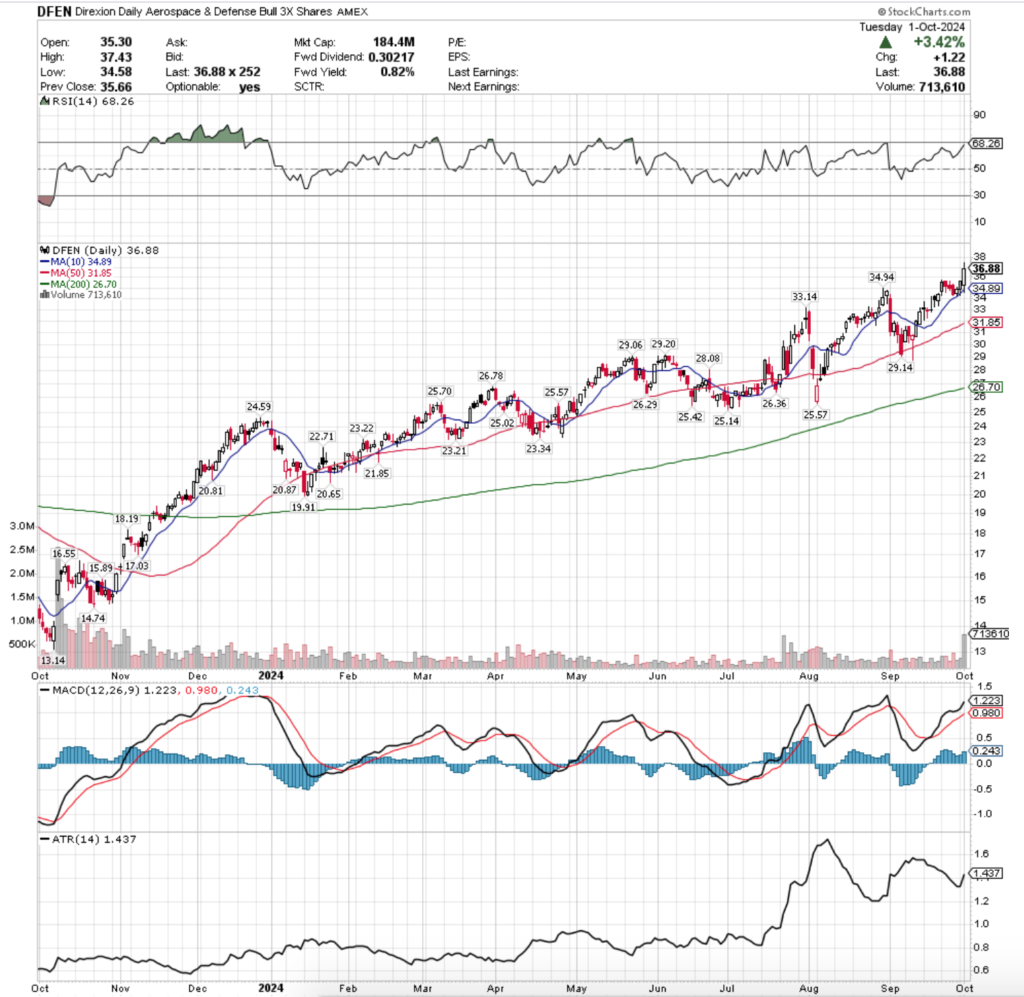
DFEN, the Direxion Daily Aerospace & Defense Bull 3x Shares ETF has advanced +154.6% over the past year, gaining +176.78% since their 52-week low in October of 2023, and closed -1.55% below their 52-week high that was set today (all figures ex-distributions).
Escalating global tensions have helped propel DFEN & its component stocks higher this year & these gains look to continue in the coming months based on what we just saw in the news between Israel & Iran.
Some of DFEN ETF’s largest holdings include GE Aerospace (GE), Raytheon Technologies Corporation (RTX), Boeing (BA), L3 Harris Technologies (LHX), Northrop Grumman (NOC), Lockheed Martin (LMT), General Dynamics (GD), Axon Enterprise Inc. (AXON), Transdigm Group (TDG) & Howmet Aerospace Inc. (HWM).
Below is a brief technical analysis of DFEN’s past week & a half, as well as a price level:volume sentiment analysis of the price levels DFEN has traded at over the past ~2 years.
Included in this data is also their recent support & resistance levels so that readers can gain insight into how strong/weak these support/resistance levels may be in the future, based on past investor behavior.
It is not intended to serve as financial advice, but rather as an additional tool to reference while performing your own due diligence on DFEN.
Technical Analysis Of DFEN, The Direxion Daily Aerospace & Defense Bull 3x Shares ETF
Their RSI is approaching overbought territory, sitting currently at 68.26, while their MACD is still signaling bullish sentiment as they notch a new 52-week high today.
Volumes were +6.39% above the prior year’s average this past week & a half (293,318.57 vs. 275,696.94), primarily due to yesterday’s high volume & wide range session that closed as a +3.42% advance for the day.
Last Monday began on a bullish note for DFEN, as the session resulted in an advance on the highest advancing volume they’d had in roughly a month.
Tuesday day DFEN open higher, but immediately began to decline as market participants were eager to collect some profits following their run up that lasted nearly two weeks.
Prices closed about midway through Monday’s candle’s real body, but tested below the opening price of Monday indicating that there was more appetite to the downside in the near-term.
Wednesday followed suit, opening near the close of Tuesday’s session & showing some signs of risk-on appetite based on their upper shadow that was close to Tuesday’s opening price level.
However, Wednesday’s candle’s lower shadow showed that the bulls were still not fully in control & that the declines may not be over.
Thursday confirmed this as the session opened near Wednesday’s open, tested a hair higher before ultimately declining the rest of the day, although not coming near the support of the 10 day moving average.
It should be noted that Thursday’s declining volume was the highest level since the first day of September, as given that the price didn’t actually test the 10 DMA then it can be seen as a likely reversal point as the bears had become exhausted.
Friday opened slightly higher, dipped briefly to test the support of the 10 DMA, but ultimately it was back to risk-on for the DFEN names heading into the weekend (although on low volume, indicating there was still a sense of hesitancy).
DFEN started the new week off on a strong foot, opening above its closing price from Friday, testing lower against the support of the 10 DMA, which despite breaking down briefly managed to hold up & DFEN rallied higher to close the day.
Israel & Iran’s situation continued escalating, leading DFEN to have yesterday’s +3.42% advancing session on volume that eclipsed most of the volume levels of the past year.
While there was some downside appetite, which notably included another temporary breakdown of the 10 DMA’s support this can be attributed to the broader market index weakness yesterday, as clearly DFEN investors were ready for risk-on.
Moving forward there are now two support levels in the $34.89-34.94/share price zone which haven’t seen much in terms of downside testing, which will be an area to keep an eye on in the event of any near-term declines.
In the even that occurs, it is important to have an understanding of how investors have behaved at DFEN previously traded at price levels in order to understand how they may behave at these levels again.
This will help navigate how market participants may behave again at the same levels in the event of support level re-tests.
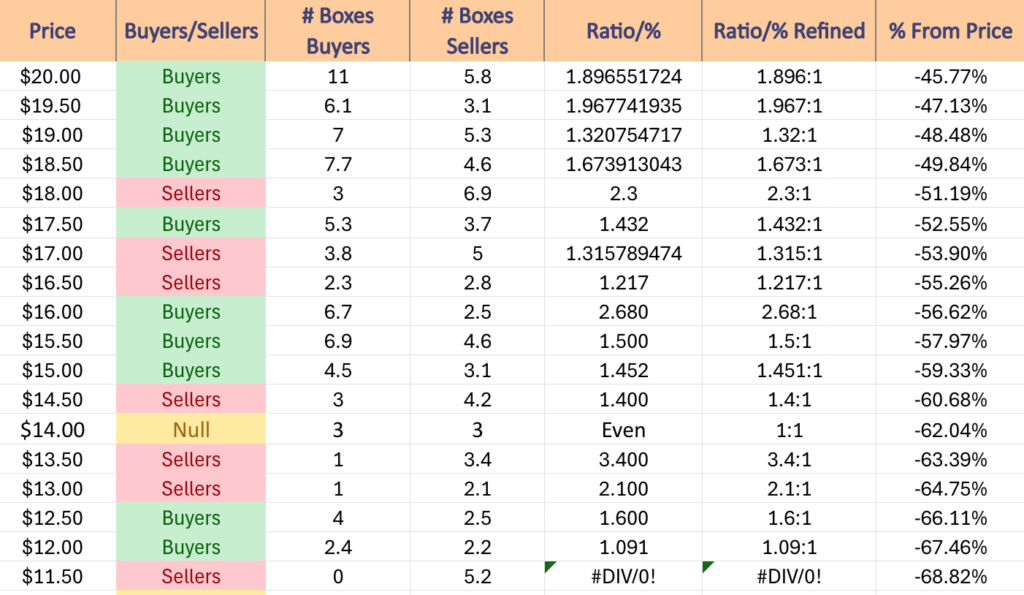
Price Level:Volume Sentiment For DFEN, The Direxion Daily Aerospace & Defense Bull 3x Shares ETF
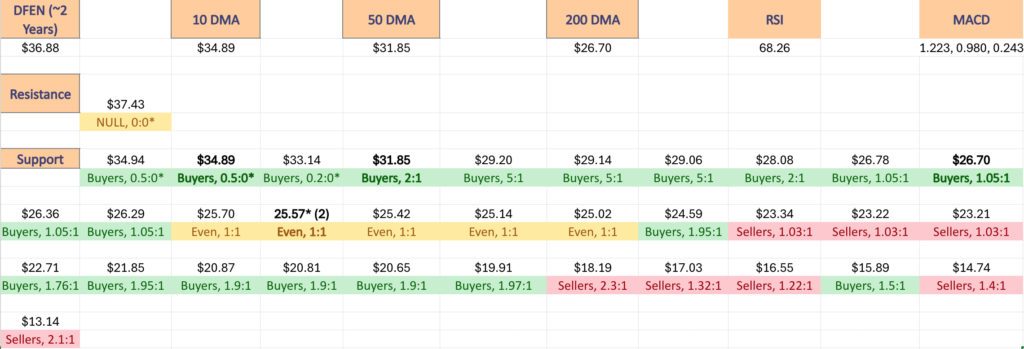
The top table below shows the support & resistance levels of DFEN from the past year’s chart, as well as their price level:volume sentiment at each, using Tuesday 10/1/24’s closing price.
The moving averages are denoted with bold.
The next charts show the volume sentiment at each individual price level DFEN has traded at over the past ~2 years.
Beneath them is a copy & pasteable list of the same data, where the support/resistance levels are denoted in bold.
All ratios with “0” in the denominator are denoted with a “*”.
NULL values are price levels that had limited trading volume, whether it be due to gaps, quick advances or they are at price extremes; in the event that they are retested & there is more data they would have a distinct “Buyers”, “Sellers” or “Even” title.
This is not intended as financial advice, but rather another tool to consider when performing your own research & due diligence on DFEN ETF.
DFEN ETF’s Price Level:Volume Sentiment Over The Past ~2 Years At One Year Support & Resistance Levels
DFEN ETF’s Price Level:Volume Sentiment Over The Past ~2 Years
Cont’d DFEN ETF’s Price Level:Volume Sentiment Over The Past ~2 Years
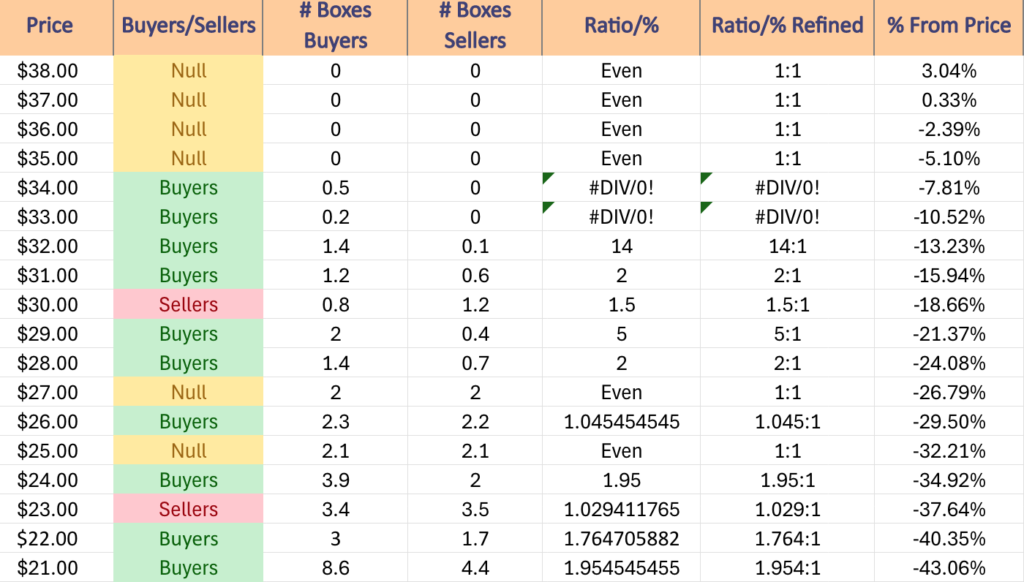
$38 – NULL – 0:0*, +3.04% From Current Price Level
$37 – NULL – 0:0*, +0.33% From Current Price Level
$36 – NULL – 0:0*, -2.39% From Current Price Level – Current Price Level*
$35 – NULL – 0:0*, -5.1% From Current Price Level
$34 – Buyers – 0.5:0*, -7.81% From Current Price Level – 10 Day Moving Average*
$33 – Buyers – 0.2:0*, -10.52% From Current Price Level
$32 – Buyers – 14:1, -13.23% From Current Price Level
$31 – Buyers – 2:1, -15.94% From Current Price Level – 50 Day Moving Average*
$30 – Sellers – 1.5:1, -18.66% From Current Price Level
$29 – Buyers – 5:1, -21.37% From Current Price Level
$28 – Buyers – 2:1, -24.08% From Current Price Level
$27 – Even – 1:1, -26.79% From Current Price Level
$26 – Buyers – 1.05:1, -29.5% From Current Price Level
$25 – Even – 1:1, -32.21% From Current Price Level – Double Touch-Point At $25.57*
$24 – Buyers – 1.95:1, -34.92% From Current Price Level
$23 – Sellers – 1.03:1, -37.64% From Current Price Level
$22 – Buyers – 1.76:1, -40.35% From Current Price Level
$21 – Buyers – 1.95:1, -43.06% From Current Price Level
$20 – Buyers – 1.9:1, -45.77% From Current Price Level
$19.50 – Buyers – 1.97:1, -47.13% From Current Price Level
$19 – Buyers – 1.32:1, -48.48% From Current Price Level
$18.50 – Buyers – 1.67:1, -49.84% From Current Price Level
$18 – Sellers – 2.3:1, -51.19% From Current Price Level
$17.50 – Buyers – 1.43:1, -52.55% From Current Price Level
$17 – Sellers – 1.32:1, -53.9% From Current Price Level
$16.50 -Sellers – 1.22:1, -55.26% From Current Price Level
$16 – Buyer s- 2.68:1, -56.62% From Current Price Level
$15.50 – Buyers – 1.5:1, -57.97% From Current Price Level
$15 – Buyers – 1.45:1, -59.33% From Current Price Level
$14.50 – Sellers – 1.4:1, -60.68% From Current Price Level
$14 – Even – 1:1, -62.04% From Current Price Level
$13.50 – Sellers – 3.4:1, -63.39% From Current Price Level
$13 – Sellers – 2.1:1, -64.75% From Current Price Level
$12.50 – Buyers – 1.6:1, -66.11% From Current Price Level
$12 – Buyers – 1.09:1, -67.46% From Current Price Level
$11.50 – Sellers – 5.2:0*, -68.82% From Current Price Level
$11 – NULL – 0:0*, -70.17% From Current Price Level
*** I DO NOT OWN SHARES OR OPTIONS CONTRACT POSITIONS IN DFEN AT THE TIME OF PUBLISHING THIS ARTICLE ***
The VIX closed at 19.26, indicating an implied one day move of +/-1.21% & an implied one month move of +/-5.29%.
Highest Technical Rated S&P 500 Components Per 10/1/2024’s Close:
1 – VST
2 – CEG
3 – PLTR
4 – NRG
5 – ERIE
6 – IRM
7 – FICO
8 – ORCL
9 – HWM
10 – MMM
Lowest Technical Rated S&P 500 Components Per 10/1/2024’s Close:
1 – WBA
2 – MRNA
3 – DLTR
4 – DXCM
5 – DG
6 – HUM
7 – INTC
8 – BEN
9 – LULU
10 – BA
Highest Volume Rated S&P 500 Components Per 10/1/2024’s Close:
1 – HUM
2 – PAYX
3 – OXY
4 – MKC
5 – LMT
6 – CTRA
7 – EVRG
8 – BIIB
9 – HAL
10 – TSCO
Lowest Volume Rated S&P 500 Components Per 10/1/2024’s Close:
1 – ETN
2 – ALB
3 – PCG
4 – ERIE
5 – DHR
6 – CRWD
7 – AVY
8 – MOH
9 – BLDR
10 – BXP
Highest Technical Rated ETFs Per 10/1/2024’s Close:
1 – BABX
2 – YINN
3 – CWEB
4 – XPP
5 – CHAU
6 – CNXT
7 – UTSL
8 – KTEC
9 – KWEB
10 – MCH
Lowest Technical Rated ETFs Per 10/1/2024’s Close:
1 – YANG
2 – TSLZ
3 – TSDD
4 – FXP
5 – NVDQ
6 – NVD
7 – CONL
8 – TSLQ
9 – MRNY
10 – JDST
Highest Volume Rated ETFs Per 10/1/2024’s Close:
1 – BKCI
2 – PSMO
3 – PBOC
4 – PPTY
5 – BKEM
6 – EFNL
7 – PSMR
8 – EOCT
9 – SHUS
10 – TTAI
Lowest Volume Rated ETFs Per 10/1/2024’s Close:
1 – XRLX
2 – CPLS
3 – BCIL
4 – SIO
5 – NRES
6 – ZTRE
7 – RENW
8 – TYLD
9 – JANQ
10 – QMID
Highest Technical Rated General Stocks Per 10/1/2024’s Close:
1 – DUO
2 – LASE
3 – TIL
4 – CAPR
5 – UXIN
6 – BASA
7 – TSSI
8 – RAIL
9 – CLOQ
10 – LUMN
Lowest Technical Rated General Stocks Per 10/1/2024’s Close:
1 – IVP
2 – MULN
3 – EDBL
4 – WTO
5 – APDN
6 – SLXN
7 – UPC
8 – NDRA
9 – YELLQ
10 – TRNR
Highest Volume Rated General Stocks Per 10/1/2024’s Close:
1 – TWO
2 – MGRX
3 – OUT
4 – UAVS
5 – ICCT
6 – INDO
7 – SGMT
8 – BRN
9 – PLLTL
10 – STTK
Lowest Volume Rated General Stocks Per 10/1/2024’s Close:
1 – MRAI
2 – SFES
3 – CRCUF
4 – FMCXF
5 – WEXPF
6 – ARESF
7 – BBSRF
8 – ACKRF
9 – SCRYY
10 – CNFN
*** THE LIST ABOVE IS STRICTLY FOR INFORMATIONAL PURPOSES – I MAY OR MAY NOT HAVE OR INITIATE A LONG, SHORT, OR LONG/SHORT POSITION IN ANY NAME ABOVE AT ANY TIME ***
The VIX closed at 16.73, indicating an implied one day move of +/-1.06% & a one month implied move of +/-4.84%
Highest Technical Rated S&P 500 Components Per 9/30/2024’s Close:
1 – VST
2 – CEG
3 – PLTR
4 – ORCL
5 – FICO
6 – ERIE
7 – IRM
8 – TSLA
9 – NRG
10 – UAL
Lowest Technical Rated S&P 500 Components Per 9/30/2024’s Close:
1 – SMCI
2 – DLTR
3 – WBA
4 – MRNA
5 – DG
6 – DXCM
7 – INTC
8 – APA
9 – BA
10 – LW
Highest Volume Rated S&P 500 Components Per 9/30/2024’s Close:
1 – BBWI
2 – UHS
3 – CCL
4 – WYNN
5 – J
6 – ARE
7 – OXY
8 – MCO
9 – RMD
10 – DUK
Lowest Volume Rated S&P 500 Components Per 9/30/2024’s Close:
1 – CRWD
2 – KEY
3 – AVGO
4 – EPAM
5 – AMD
6 – FDS
7 – DHR
8 – SBUX
9 – PYPL
10 – COF
Highest Technical Rated ETFs Per 9/30/2024’s Close:
1 – YINN
2 – BABX
3 – CWEB
4 – XPP
5 – CHAU
6 – UTSL
7 – CNXT
8 – TSLL
9 – TSLR
10 – TSLT
Lowest Technical Rated ETFs Per 9/30/2024’s Close:
1 – YANG
2 – TSLZ
3 – TSDD
4 – NVDQ
5 – NVD
6 – FXP
7 – TSLQ
8 – GXLM
9 – SSG
10 – MRNY
Highest Volume Rated ETFs Per 9/30/2024’s Close:
1 – PSCQ
2 – ARVR
3 – BBEM
4 – HEAT
5 – EVIM
6 – BNGE
7 – OCTZ
8 – AFTY
9 – IBOT
10 – JCHI
Lowest Volume Rated ETFs Per 9/30/2024’s Close:
1 – JULT
2 – FDTB
3 – ZHDG
4 – HYTR
5 – TBJL
6 – SHDG
7 – USNZ
8 – ATFV
9 – GDEC
10 – GJUL
Highest Technical Rated General Stocks Per 9/30/2024’s Close:
1 – LXEH
2 – SONN
3 – CNET
4 – DUO
5 – BBIG
6 – LASE
7 – TIL
8 – UXIN
9 – CAPR
10 – TSSI
Lowest Technical Rated General Stocks Per 9/30/2024’s Close:
1 – MULN
2 – EDBL
3 – WTO
4 – NDRA
5 – UPC
6 – VMAR
7 – TRNR
8 – BSLK
9 – TOVX
10 – SYTA
Highest Volume Rated General Stocks Per 9/30/2024’s Close:
1 – SLG
2 – OUT
3 – PAVS
4 – EMKR
5 – ZCMD
6 – ZKIN
7 – HPH
8 – XHG
9 – MAMA
10 – KXIN
Lowest Volume Rated General Stocks Per 9/30/2024’s Close:
1 – AHOTF
2 – INBP
3 – CHPGF
4 – ALPIB
5 – ACKRF
6 – STAF
7 – PLSDF
8 – TCON
9 – PSBQ
10 – SCND
*** THE LIST ABOVE IS STRICTLY FOR INFORMATIONAL PURPOSES – I MAY OR MAY NOT HAVE OR INITIATE A LONG, SHORT, OR LONG/SHORT POSITION IN ANY NAME ABOVE AT ANY TIME ***
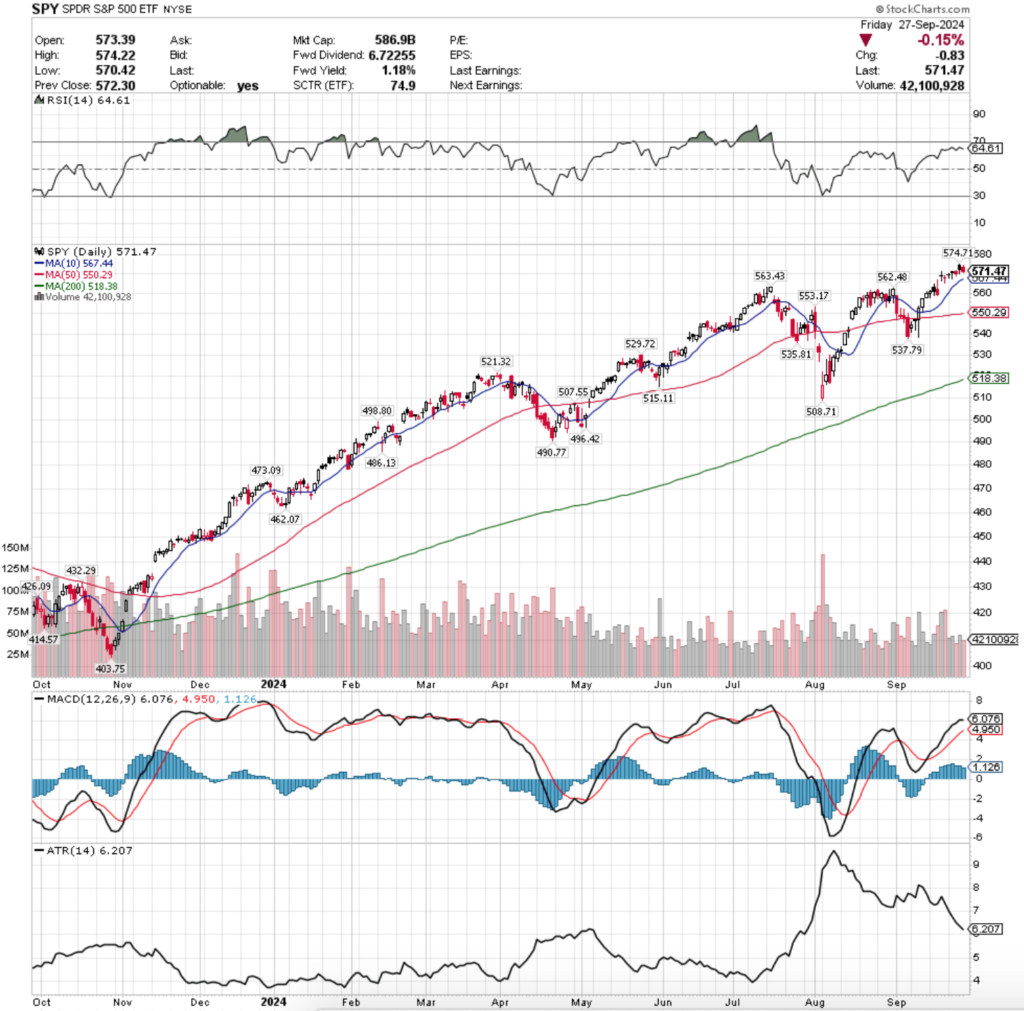
SPY, the SPDR S&P 500 ETF gained +0.57% in another week with subpar volumes, while the VIX closed at 16.96, indicating an implied one day move of +/-1.07% & an implied one month move of +/-4.9%.
SPY ETF – SPDR S&P 500 ETF’s Technical Performance Over The Past Year
Their RSI is currently at 64.61 & has begun to curl over bearishly, heading back towards the neutral level while their MACD is also curling over bearishly & looks set to cross the signal line bearishly in the coming days.
Volumes were -34.28% below the previous year’s average last week (43,960,000 vs. 66,888,340) as market participants are still largely sitting on the sidelines uneasily as prices continue to set & flirt with new all-time highs.
As we’ve highlighted on here over the past month or so, volumes when compared to the average volume of the year before April 2024 are even lower, as for the past ~5 months volumes have been extremely muted.
In our report on 3/31/2024 the average prior year’s volume for SPY was 77,829,780, making today’s average previous year’s volume -14% lower than where it was in March, which is a fairly decent size drop off & not a signal of confidence in the S&P 500.
SPY’s week started off on an uncertain note, as Monday’s session resulted in a dragonfly doji, indicating that there was some downside appetite but the day was able to open & close near the high end of its price range.
Monday’s session was the third highest volume session of the week, as investors were not overly eager to jump back into SPY right out of the gate.
Tuesday this trend continued, as volumes were the second highest of the week on another session that resulted in a dragonfly doji.
The lower shadow on Tuesday’s candle also indicated that there was a lot of downside appetite, but that the bulls were able to drive the price back up to close just above the day’s opening price.
Wednesday is when things began to flash weakness for SPY, as the session opened just below Tuesday’s close & proceeded lower throughout the day.
However, much like the prior two days there was a lack of volume as Wednesday was SPY’s least active session of the week.
Thursday things gave a glimmer of optimism after the PBOC announced new easing measures, but it came with a hint of doubt.
The session gapped higher but was unable to continue higher, tested into Wednesday’s candle’s real body before closing slightly higher than Wednesday, but at a lower price than their open.
Thursday also had the strongest volumes of the week for SPY, indicating that there was a bit of profit taking throughout the day & that the reality was slowly becoming more risk-off after five consecutive sessions of dojis that came after a gap up the prior Thursday.
Friday the risk-off sentiment was echoed, as SPY closed down -0.15%, although it should be noted that the two lowest volume sessions of the week came on the declining days.
As noted before, there has been little but indecision & mixed signals in the market since last Thursday’s session, when SPY gapped up on the open & proceeded to close below the opening price.
Market participants are beginning to look more & more skittish each passing week & there has not been such long consecutive string of doji candles in the past year, which gives off the feeling that we’re approaching at least a temporary falling of the Jenga tower.
Like last week, the 10 day moving average & its relationship to SPY’s price will be a key area of importance to track this coming week.
Any breakdown of that support level will begin to put pressure on SPY’s price, particularly at times where the volumes have been so low such as this past week.
Given how close they are to their all-time high there is little to measure against for SPY’s upside potential this week, but given the low level of major earnings reports & high number of Fed speakers continuing into the week combined with their RSI & MACD readings it looks like SPY is set to pump the brakes this week.
It should be noted that SPY’s 50 DMA’s support level is ~4% below their current price & edging higher, and currently sits just below a price zone that is dominated by Sellers at a rate of 1.25:1, which will be another area to keep an eye on in the event of declines.
Should the 50 DMA be broken through to the downside the $537.79-535.81 support levels will be in play, also occurring just after a Seller dominated price zone (1.4:1).
SPY has support at the $567.44 (10 Day Moving Average, Volume Sentiment: NULL, 0:0*), $563.43 (Volume Sentiment: Buyers, 10:1), $562.48 (Volume Sentiment: Buyers, 10:1) & $553.17/share (Volume Sentiment: Buyers, 1.92:1) price levels, with resistance at the $574.71/share (All-Time High, Volume Sentiment: NULL, 0:0*) price levels.
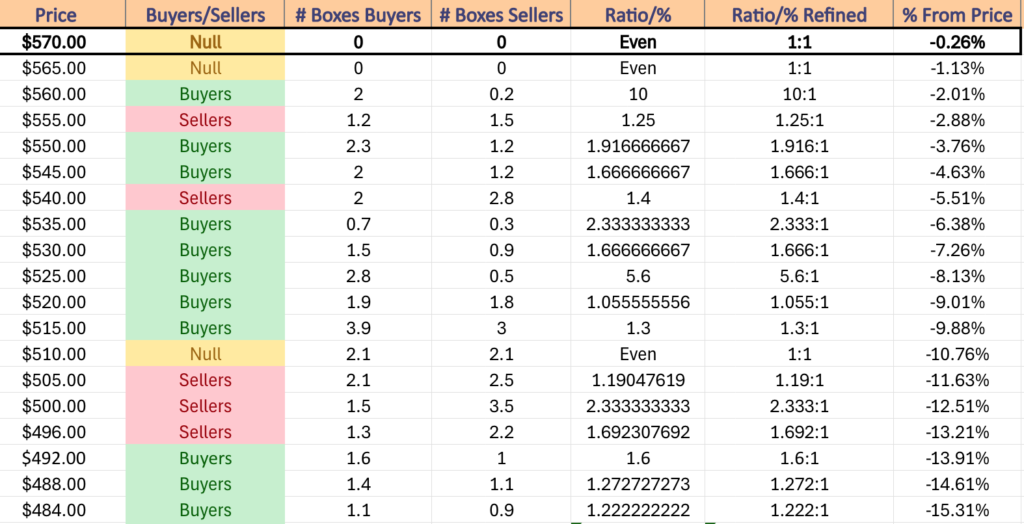
SPY ETF’s Price Level:Volume Sentiment Over The Past 1-2 Years
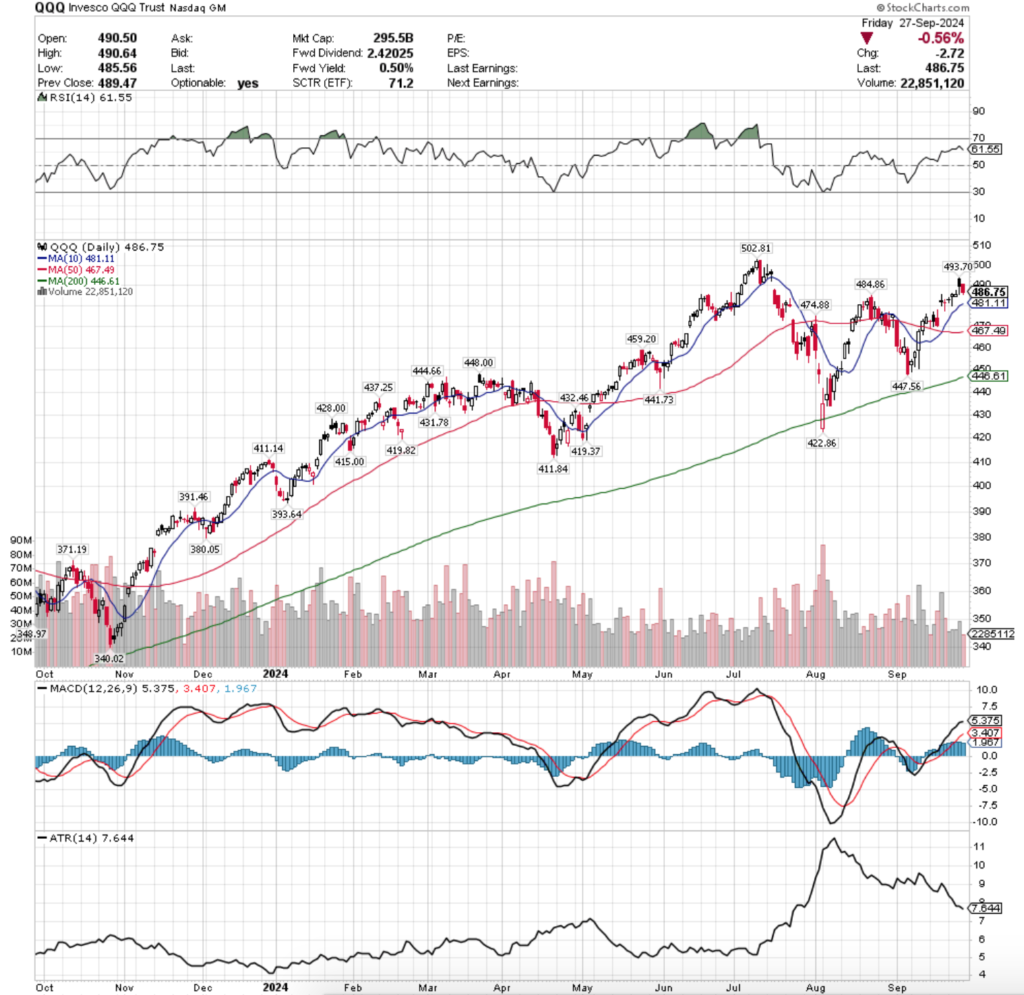
QQQ, the Invesco QQQ Trust ETF that tracks the NASDAQ 100 advanced +0.89% last week, having the strongest week of the major four index ETFs.
QQQ ETF – Invesco QQQ Trust ETF’s Technical Performance Over The Past Year
Their RSI looks similar to SPY’s in that it has begun to curl over & head downward following Friday’s declines & it currently sits at 61.55, while their MACD looks primed to cross the signal line bearishly in the coming week.
Volumes were also extremely weak for QQQ, coming in at -37.61% below the prior year’s average (26,442,000 vs. 42,380,464), as the tumbleweeds blew across the tech heavy index.
Much like SPY, QQQ’s average past year volume is -13.95% lower than it was back on March 31, 2024 (49,253,412).
QQQ’s week began in a similar fashion to SPY’s as Monday’s session resulted in a doji candle on the second weakest volume of the week, indicating that there was hesitancy on the part of market participants heading into a new week.
However, this all seemed to fade away for the next two days, but there was still downside appetite as shown by Tuesday’s candle’s lower shadow.
Tuesday opened higher day-over-day, but tested much lower down to the $480.17/share mark before rallying higher & closing the day on a slight advance.
It should be noted that Tuesday’s candle flashed an ominous signal though as the session closed in a hanging man candle, which was then confirmed by Wednesday’s session’s inability to test much higher.
Wednesday resulted in a shooting star candle, indicating that there was still trouble on the horizon for QQQ.
Thursday saw the highest volumes of the week, but like SPY the PBOC pump resulted in profit taking, lending to the week’s highest volume being for a session that opened higher, tested down to near Wednesday’s close before closing below the day’s opening price.
This set the stage for Friday’s risk-off heading into the weekend session where QQQ declined -0.56%.
It should be noted that this occurred on the lowest volumes of the week, but considering Thursday’s high volume & wide range of price action & ultimate lower close than opening price that may be a function of folks hopping out of the pool a day prior.
Thursday was not able to produce a new all-time nor a 52-week high which indicates that there is unlikely to be much along the lines of near-term upside appetite for QQQ.
QQQ looks ready to take a breather at minimum due to the inability to continue trudging higher last week & all eyes will be on the relationship between their price & the 10 day moving average’s support heading into the new week.
In the event the price breaks through it to the downside then we will likely see if continue further until it tests the 50 DMA’s support, as there is only one other support touchpoint between them ($474.88).
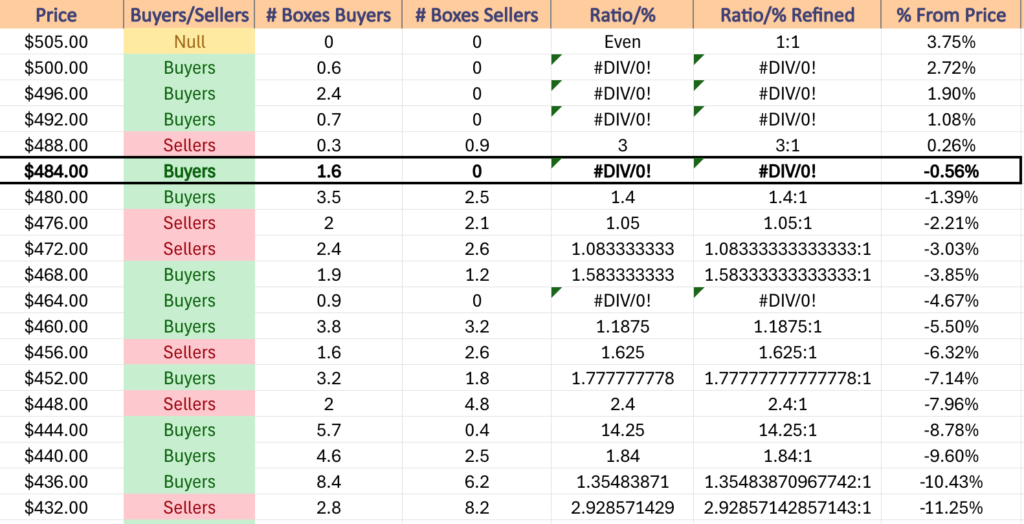
This is where things could become interesting as the $472-479.99/share price levels are Seller dominated over the past ~2 years (1.05:1 & 1.08:1) & the 50 DMA currently sits at $467.49/share & is rising.
The good news for bulls should this happen is that since July’s decline we have been making higher lows & there is a support zone between the 200 Day Moving Average at $446.61 to $448/share.
However, bears will be quick to point out that QQQ’s most recent peak was only +1.82% higher than the previous peak & the 200 DMA’s support was broken through temporarily in August, indicating that there is appetite to see that happen again.
As has been noted in previous weeks, QQQ has more support levels due to the steadier ascent they took since the Q4 2023 rally, particularly the prices from Q1 into Q2 2024.
QQQ has support at the $484.86 (Volume Sentiment: Buyers, 1.6:0*), $481.11 (10 Day Moving Average, Volume Sentiment: Buyers, 1.4:1), $474.88 (Volume Sentiment: Sellers, 1.08:1) & $467.49/share (50 Day Moving Average, Volume Sentiment: Buyers, 0.9:0*) price levels, with resistance at the $493.70 (Volume Sentiment: Buyers, 0.7:0*) & $502.81/share (All-Time High, Volume Sentiment: Buyers, 0.6:0*) price levels.
QQQ ETF’s Price Level:Volume Sentiment Over The Past 1-2 Years
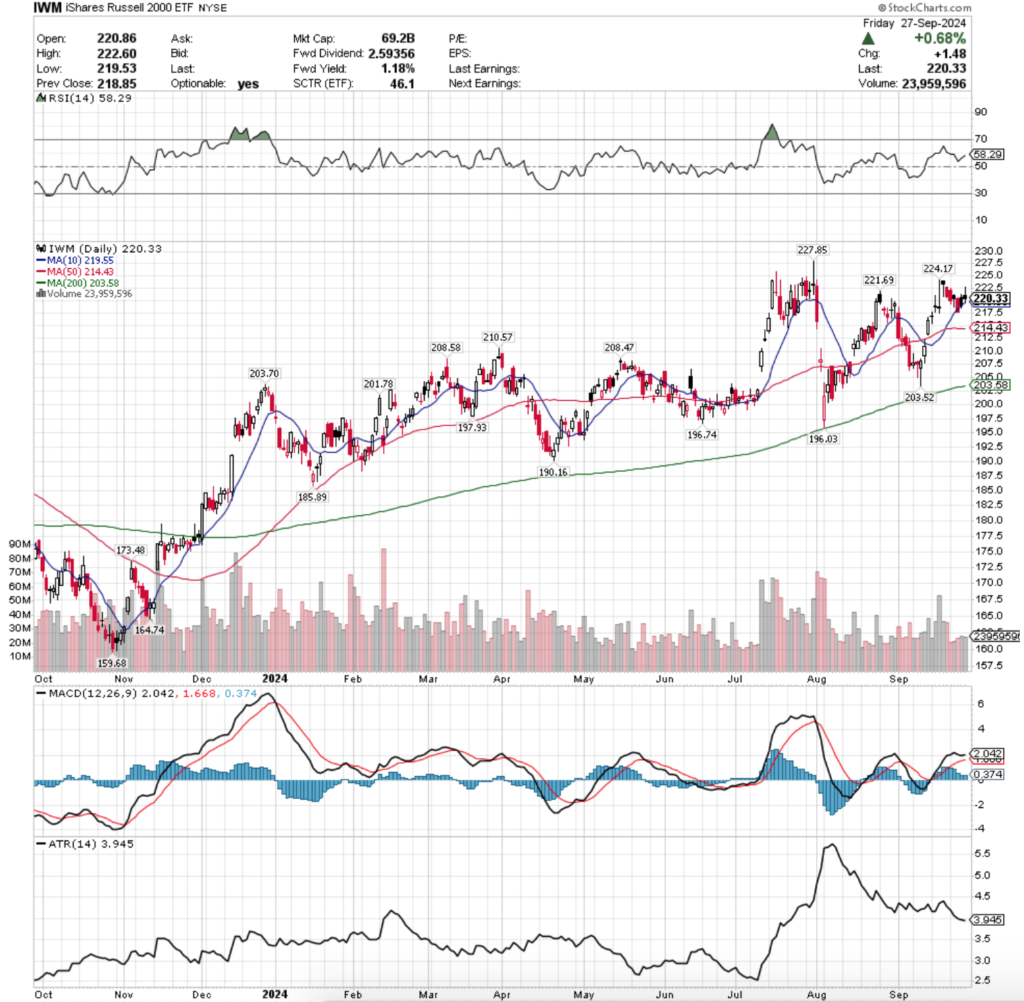
IWM ETF – iShares Russell 2000 ETF’s Technical Performance Over The Past Year
Their RSI is currently at 58.29, while their MACD has flattened & looks ready to cross the signal line bearishly in the coming days.
Volumes were -35.95% below the previous year’s average (22,654,000 vs. 35,367,549), as market participants were not seeking risk & taking profits from the recent run up in small cap names.
Unlike SPY & QQQ, IWM’s average past year’s volume is now +3.18% above where it was back on 3/31/2024 (34,276,900).
This looks like complacency for investors in IWM & its components, given it was a week of moderate declines for IWM but less people were selling than normal.
IWM’s week kicked off Monday to more profit taking following Friday’s declining session & last Thursday’s hanging man candle that closed lower than it opened despite gapping up to open (bearish).
Tuesday threw mixed signals out, as the session closed as a hammer candle which can indicate that there is a reversal coming in the wake of declines like the ones that preceded it & it formed a bullish harami with the prior session’s candle.
However, caution should be taken as the session closed lower than it opened & the lower shadow shows that there was quite a bit of downside appetite that the bulls were able to at least temporarily fight back from.
Wednesday confirmed that there is bearishness in the air for IWM, as the session opened lower & continued to test lower, breaking down through the support of the 10 day moving average & closing beneath it.
Thursday opened on a gap up, tested slightly higher than it opened, but in the end the bears were able to force IWM’s price down to close below their opening price & in-line with the 10 DMA, echoing the bearish sentiment of the prior five sessions despite closing slightly up.
Friday was able to open slightly higher than Thursday & tested higher, breaking abvoe the $222.50-mark briefly before moving lower & testing down to the 10 DMA’s support.
Support held up & forced the close to be a spinning top candle, but it should be noted that the close was lower than the open, which carries bearish sentiment.
Friday had the second highest volume of the week as market participants were eager to remove risk before the weekend commenced.
This week will have the 10 DMA in focus, as it has so far proven to be sturdy but has shown signals of weakness & with repeated testing it seems that market participants are unsure if they want prices to remain above it or not for IWM.
In the event that it breaks down, the next support level is -2.33% lower at the 50 day moving average, which is currently ~2% above the next highest support level & moving higher.
With the hanging man candle from the previous Thursday’s session marking the recent high that is where to keep an eye on in the event prices break upwards, but based on last week’s price action it looks like IWM is ready to continue lower in the coming week.
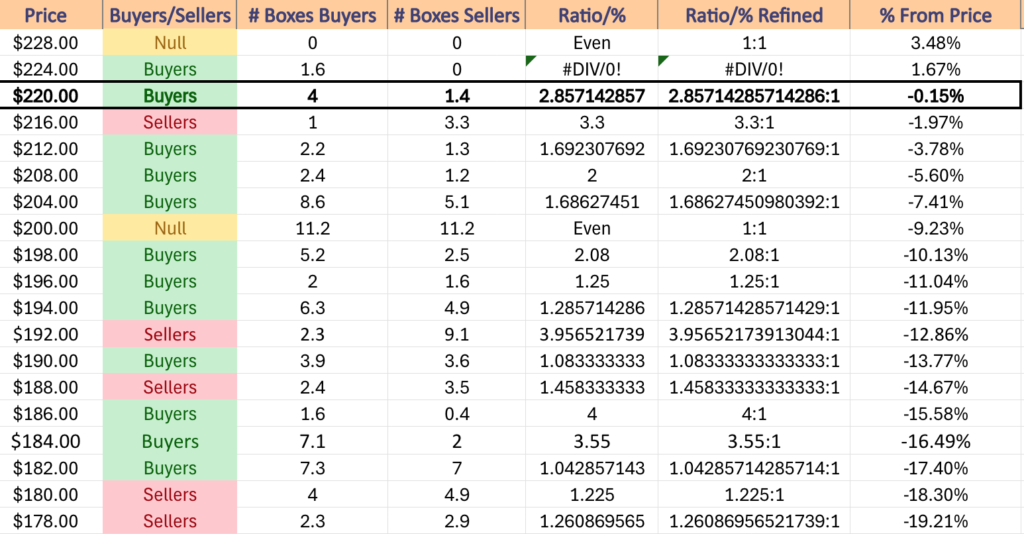
IWM has support at the $219.55 (10 Day Moving Average, Volume Sentiment: Sellers, 3.3:1), $214.43 (50 Day Moving Average, Volume Sentiment: Buyers, 1.69:1), $210.57 (Volume Sentiment: Buyers, 2:1) & $208.58/share (Volume Sentiment: Buyers, 2:1) price levels, with resistance at the $221.69 (Volume Sentiment: Buyers, 2.86:1), $224.17 (Volume Sentiment: Buyers, 1.6:0*) & $227.85/share (52-Week High, Volume Sentiment: Buyers, 1.6:0*) price levels.
IWM ETF’s Price Level:Volume Sentiment Over The Past 1-2 Years
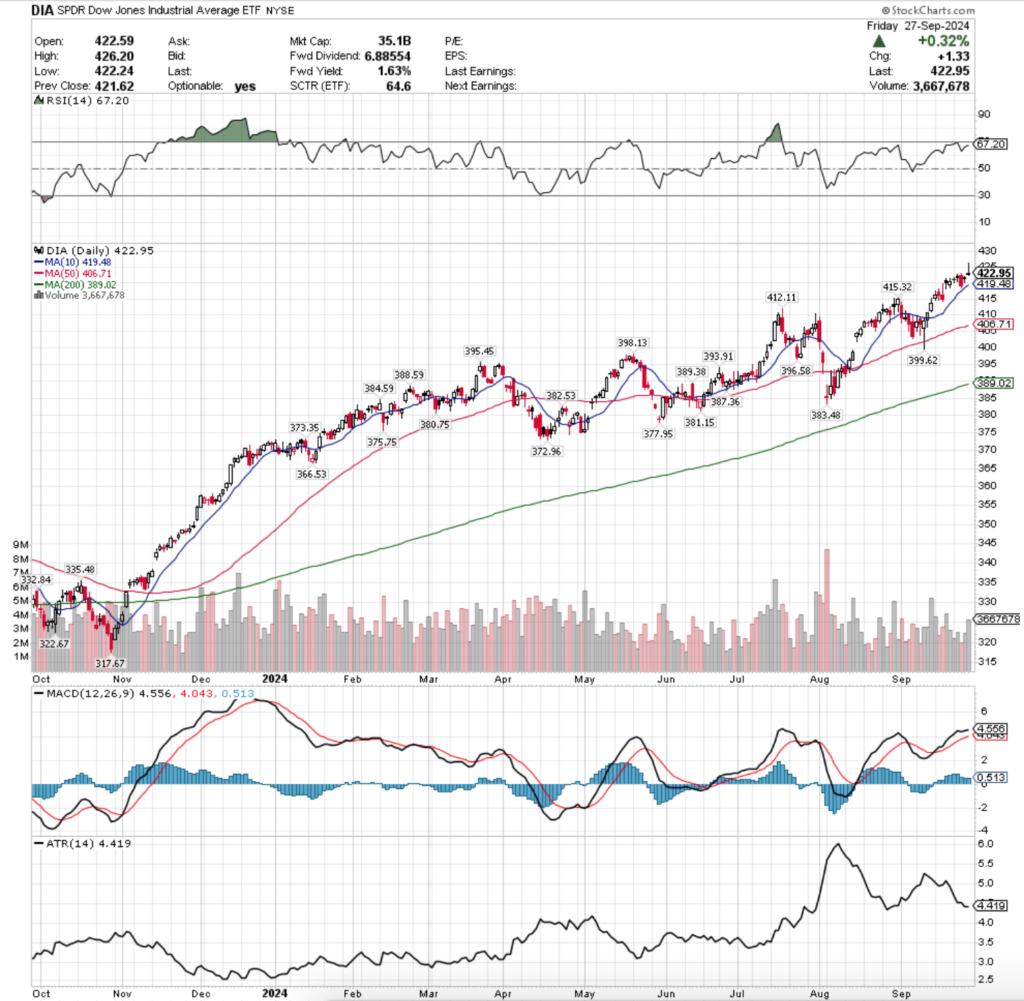
DIA ETF – SPDR Dow Jones Industrial Average ETF’s Technical Performance Over The Past Year
Their RSI is trending into overbought territory & currently sits at 67.2, while their MACD is still bullish but beginning to flatten out & their histogram has been waning the past three sessions.
This sign of weakness will likely lead to a bearish crossover of their signal line in the coming week.
As noted above, volumes were lackluster for DIA, coming in -23.91% below the previous year’s average volume (2,706,000 vs. 3,556,245), as it is looking like investors are running out of steam at their current price levels.
Like IWM, DIA’s current previous year’s average volume is actually higher than it was on 3/31/2024, coming in +4.44% above it’s late-March counterpart (3,405,069).
DIA’s week kicked off on uncertain footing, as Monday’s session ended in a doji on very light advancing volume.
Tuesday was another advancing session, but it resulted in a hanging man candle (bearish), which set the stage for the risk-off action that DIA saw on Wednesday’s bearish engulfing candle that went down to come near testing the support of their 10 day moving average.
Thursday saw volumes kick up a bit more, but opened just below the high end of Wednesday’s real body, tested lower & ultimately closed lower than it opened as a hanging man candle.
While Thursday also could be categorized as a bullish harami formation with Wednesday, the fact that it closed below its open diminishes the fact that it was an advancing session & it should be viewed as bearish sentiment.
This was confirmed on Friday, when DIA gapped up, tested above the $425/share price level, before closing as a shooting star candle for the day on the week’s highest volume.
The volume should be regarded as profit taking given the wide range of prices the day covered & that their open/close were both concentrated at the bottom of the session’s candle.
The first area to watch for this week with DIA will be the window that was formed by Friday’s session, as it is likely to fill earlier on in the week as Friday’s all-time high does not look to be on stable footing.
This will bring DIA to the support level of their 10 day moving average, which if broken through will open the door to support levels ~1% away from one another until DIA reaches the 50 DMA, which currently sits at $406.71.
Should this occur DIA’s next target will be a support zone between $399-398/share, but it will have the resistance of both the 10 & 50 DMAs applying downward pressure on price, while their 200 DMA’s support level is then only ~2.5% below ($389.02).
Of course, keep an eye on their volumes as well, as the more active market participants are in the coming price moves the stronger they will be.
In terms of what to watch for on the upside it is hard to say, given that Friday’s session set an all-time high, making it more important to have an understanding of what can happen to the downside & a plan of action for if this is to occur.
DIA has support at the $419.48 (10 Day Moving Average, Volume Sentiment: Buyers, 0.2:0*), $415.32 (Volume Sentiment: Buyers, 0.8:0*), $412.11 (Volume Sentiment: Buyers, 0.8:0*) & $406.71/share (Volume Sentiment: Buyers, 1.2:1) price levels, with resistance at the $426.20/share (All-Time High, Volume Sentiment: NULL, 0:0*) price levels.
DIA ETF’s Price Level:Volume Sentiment Over The Past ~4 Years
The Week Ahead
Monday kicks the week off with Fed Governor Bowman speaking at 8:50 am, followed by the Chicago Business Barometer (PMI) data at 9:45 pm & Fed Chair Powell speaking at 1:55 pm.
Carnival reports earnings before Monday’s opening bell.
S&P Final U.S. Manufacturing PMI data comes out at 9:45 am Tuesday, followed by ISM Manufacturing, Construction Spending & Job Openings data at 10 am, Fed Governor Cook speaking at 11:10 am & Fed Presidents Barkin, Bostic & Collins having a panel discussion about technology at 6:15 pm & Auto Sales data is also expected on Tuesday.
Tuesday morning’s earnings reports include Lamb Weston, Acuity Brands, McCormick, Paychex & United Natural Foods, with Nike, Cal-Maine Foods & Resources Connection reporting after the session’s close.
Wednesday features the ADP Employment data reports at 8:15 am, followed by Fed President Hammack speaking at 9 am, Fed Governor Bowman speaking at 11 am & Fed President Barkin speaking at 12:15 pm.
Conagra & RPM Inc. report earnings before Wednesday’s opening bell, with Levi Strauss due to report after the session’s close.
Initial Jobless Claims data is scheduled to come out Thursday morning at 8:30 am, followed by S&P Final U.S. Services PMI data at 9:45 am, ISM Services & Factory Orders data at 10 am & Fed Presidents Kashkari & Bostic having a discussion at 10:40 am.
Thursday morning begins with AngioDynamics & Constellation Brands reporting earnings, with Tilray Brands coming in after the closing bell.
Friday morning starts with U.S. Nonfarm Payroll, U.S. Unemployment Rate, U.S. Hourly Wages & Hourly Wages Year-over-Year data at 8:30 am, before Fed President Williams speaking at 9 am & Apogee Enterprises reports earnings before the session opens.
See you back here next week!
*** I DO NOT OWN SHARES OR OPTIONS CONTRACT POSITIONS IN SPY, QQQ, IWM OR DIA AT THE TIME OF PUBLISHING THIS ARTICLE ***
The VIX closed at 16.96, indicating an implied one day move of +/-1.07% & an implied one month move of +/-4.9%.
Highest Technical Rated S&P 500 Components Per 9/27/2024’s Close:
1 – VST
2 – CEG
3 – PLTR
4 – UAL
5 – ERIE
6 – ORCL
7 – FICO
8 – NRG
9 – MMM
10 – TSLA
Lowest Technical Rated S&P 500 Components Per 9/27/2024’s Close:
1 – SMCI
2 – MRNA
3 – WBA
4 – DLTR
5 – DXCM
6 – DG
7 – APA
8 – INTC
9 – HAL
10 – DVN
Highest Volume Rated S&P 500 Components Per 9/27/2024’s Close:
1 – WYNN
2 – GEHC
3 – FANG
4 – LVS
5 – UHS
6 – COST
7 – BMY
8 – WAT
9 – PNW
10 – AOS
Lowest Volume Rated S&P 500 Components Per 9/27/2024’s Close:
1 – ADSK
2 – KEY
3 – PCG
4 – JBHT
5 – ERIE
6 – K
7 – CDW
8 – ETR
9 – FOX
10 – EPAM
Highest Technical Rated ETFs Per 9/27/2024’s Close:
1 – YINN
2 – BABX
3 – CWEB
4 – XPP
5 – UTSL
6 – TSLL
7 – TSLR
8 – CHAU
9 – KTEC
10 – TSLT
Lowest Technical Rated ETFs Per 9/27/2024’s Close:
1 – YANG
2 – TSLZ
3 – TSDD
4 – NVDQ
5 – NVD
6 – FXP
7 – TSLQ
8 – MRNY
9 – SSG
10 – SOXS
Highest Volume Rated ETFs Per 9/27/2024’s Close:
1 – WRND
2 – KPRO
3 – GSEE
4 – ASHS
5 – IOCT
6 – ZSB
7 – FTC
8 – USNZ
9 – USSG
10 – PAB
Lowest Volume Rated ETFs Per 9/27/2024’s Close:
1 – NPFI
2 – GVUS
3 – XOCT
4 – SBND
5 – TAFL
6 – XHYH
7 – JANJ
8 – ARP
9 – UNIY
10 – RENW
Highest Technical Rated General Stocks Per 9/27/2024’s Close:
1 – NLSP
2 – SEEL
3 – LASE
4 – RAASY
5 – TIL
6 – TSSI
7 – BASA
8 – DUO
9 – NEON
10 – UXIN
Lowest Technical Rated General Stocks Per 9/27/2024’s Close:
1 – MULN
2 – YELLQ
3 – WTO
4 – SLXN
5 – NDRA
6 – VMAR
7 – GSIW
8 – BSLK
9 – PBM
10 – TOVX
Highest Volume Rated General Stocks Per 9/27/2024’s Close:
1 – SLG
2 – MAMA
3 – TCTM
4 – JFU
5 – CNET
6 – UXIN
7 – ONCO
8 – ESLA
9 – CDIO
10 – ICG
Lowest Volume Rated General Stocks Per 9/27/2024’s Close:
1 – SYNX
2 – ALPIB
3 – JYD
4 – IDWM
5 – BTSGU
6 – MOJO
7 – PLSDF
8 – DTEGF
9 – BAFN
10 – ATPC
*** THE LIST ABOVE IS STRICTLY FOR INFORMATIONAL PURPOSES – I MAY OR MAY NOT HAVE OR INITIATE A LONG, SHORT, OR LONG/SHORT POSITION IN ANY NAME ABOVE AT ANY TIME ***
The VIX closed at 15.41, indicating an implied one day move of +/-0.97% & an implied one month move of +/-4.45% for the S&P 500.
Highest Technical Rated S&P 500 Components Per 9/25/2024’s Close:
1 – VST
2 – CEG
3 – PLTR
4 – ERIE
5 – IRM
6 – FICO
7 – MMM
8 – ORCL
9 – TRGP
10 – HWM
Lowest Technical Rated S&P 500 Components Per 9/25/2024’s Close:
1 – WBA
2 – MRNA
3 – DLTR
4 – DXCM
5 – DG
6 – SMCI
7 – LULU
8 – INTC
9 – APA
10 – BA
Highest Volume Rated S&P 500 Components Per 9/25/2024’s Close:
1 – GPN
2 – PSX
3 – VST
4 – VTRS
5 – MU
6 – KMX
7 – AMGN
8 – REGN
9 – NOW
10 – GM
Lowest Volume Rated S&P 500 Components Per 9/25/2024’s Close:
1 – KKR
2 – PARA
3 – FTV
4 – K
5 – AVGO
6 – IP
7 – CRWD
8 – CZR
9 – PODD
10 – ABNB
Highest Technical Rated ETFs Per 9/25/2024’s Close:
1 – YINN
2 – BABX
3 – UTSL
4 – TSLL
5 – TSLR
6 – NUGT
7 – JNUG
8 – XPP
9 – TSLT
10 – FBL
Lowest Technical Rated ETFs Per 9/25/2024’s Close:
1 – NVDQ
2 – NVD
3 – TSLZ
4 – TSDD
5 – YANG
6 – MRNY
7 – TSLQ
8 – CONL
9 – SSG
10 – NVDS
Highest Volume Rated ETFs Per 9/25/2024’s Close:
1 – GVUS
2 – UNIY
3 – FTIF
4 – NRSH
5 – BNDI
6 – MGOV
7 – USCL
8 – SNAV
9 – XAPR
10 – XVOL
Lowest Volume Rated ETFs Per 9/25/2024’s Close:
1 – XHYT
2 – XHYF
3 – JUNZ
4 – SXQG
5 – GHMS
6 – SHUS
7 – XHYD
8 – FBZ
9 – PSTR
10 – FTHF
Highest Technical Rated General Stocks Per 9/25/2024’s Close:
1 – EQOSQ
2 – RAASY
3 – TIL
4 – LASE
5 – NEON
6 – TSSI
7 – ADD
8 – BASA
9 – AIAD
10 – LUMN
Lowest Technical Rated General Stocks Per 9/25/2024’s Close:
1 – MULN
2 – UPC
3 – WTO
4 – YELLQ
5 – VMAR
6 – SLXN
7 – NDRA
8 – ADTX
9 – VTNR
10 – BSLK
Highest Volume Rated General Stocks Per 9/25/2024’s Close:
1 – OCTO
2 – SLG
3 – BREA
4 – CMCT
5 – MSGM
6 – ATGL
7 – NA
8 – AIMD
9 – FRGT
10 – MKFG
Lowest Volume Rated General Stocks Per 9/25/2024’s Close:
1 – WHTCF
2 – IMBBF
3 – CNNEF
4 – FNRN
5 – BRVMF
6 – ATP
7 – SMREF
8 – NNUP
9 – SFES
10 – KGFHF
*** THE LIST ABOVE IS STRICTLY FOR INFORMATIONAL PURPOSES – I MAY OR MAY NOT HAVE OR INITIATE A LONG, SHORT, OR LONG/SHORT POSITION IN ANY NAME ABOVE AT ANY TIME ***
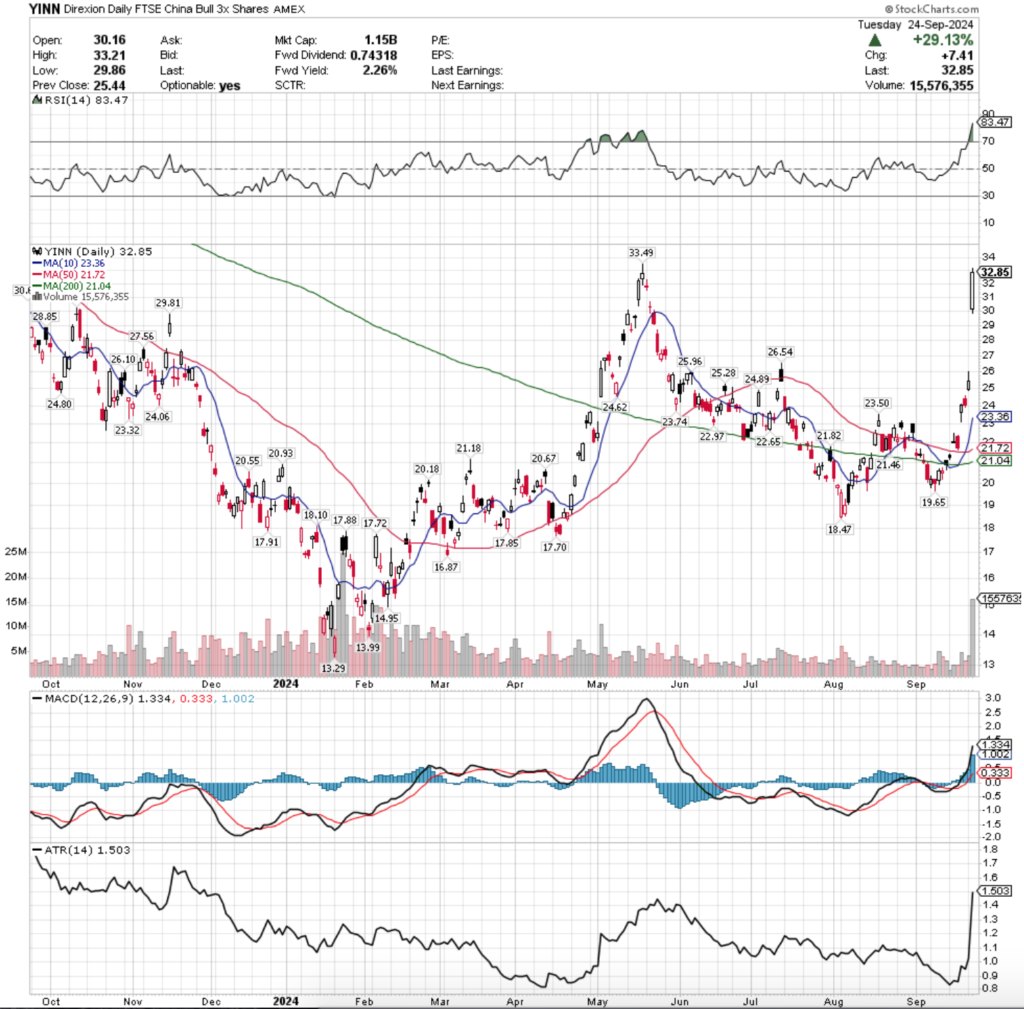
YINN, the Direxion Daily FTSE China Bull 3x Shares ETF has gained +10.57% over the past year, advancing +145.15% from their 52-week low in January of 2024 & sits just -2.49% below their 52-week high (all figures ex-distributions).
Yesterday YINN had a strong performance, gapping up & closing +29.13% after the PBOC announced new stimulus measures.
YINN tracks the FTSE China 50 Index, which are fifty of the largest companies that trade on the Hong Kong Stock Exchange.
Some of these names include Tencent Holdings Shares, Alibaba Group, Meituan, China Construction Bank Class H, Industrial Commerce Bank China Class H, Bank of China H, Netease Inc., JD.com, Xiaomi Corporations & BYD.
Investors who are bullish on Chinese companies can use YINN to get portfolio exposure to their names & for those who are bearish on Chinese companies there is also a YANG ETF, as well as put options against YINN.
Below is a brief technical analysis of YINN’s past week & a half, as well as a price level:volume sentiment analysis of the price levels YINN has traded at over the past 1-2 years.
Included in this data is also their recent support & resistance levels so that readers can gain insight into how strong/weak these support/resistance levels may be in the future, based on past investor behavior.
It is not intended to serve as financial advice, but rather as an additional tool to reference while performing your own due diligence on YINN.
Technical Analysis Of YINN, The Direxion Daily FTSE China Bull 3x Shares ETF
YINN ETF – Direxion Daily FTSE China Bull 3x Shares ETF’s Technical Performance Over The Past Year
Their RSI is currently overbought following yesterday’s +29.13% gap up session, while their MACD is bullish.
Volumes were +17.09% above the past year’s average over the past week (5,966,000 vs. 5,090,158.73), mostly driven by the high volumes of yesterday’s session, as the session’s of the days before it all have relatively muted volume.
Last Monday saw YINN gap up to above the support of their 10 & 200 day moving averages, while remaining below the 50 DMA’s resistance.
The gap ups continued on Tuesday, as YINN jumped again to pass beyond the 50 day moving average’s resistance.
Tuesday’s session did come with a hint of bearishness though, as the day’s candle resulted in a gravestone doji, which led into Wednesday’s profit taking decline.
While Wednesday formed a bearish engulfing pattern with Tuesday’s candle, it was supported by the 50 day moving average.
YINN began moving rather erratically after Wednesday, as Thursday resulted in a gap up to just below the $24/share level, tested lower to almost reach $23/share but ultimately rallied higher to close above $24/share.
The week closed out with market participants taking profits, but not until after Friday morning opened with a gap up, only to settle one penny lower than Thursday’s close at $24.03/share heading into the weekend.
While Friday’s volume was higher than Wednesday’s, both were still quite below average compared to the previous year.
This week opened on another gap up (quite the theme here), while prices ran up to the $26/share mark intraday, only to settle at $25.44/share for the day on lackluster volumes again.
Following the news out of the PBOC regarding stimulus yesterday’s session saw a massive +29.13% gap up, the sixth gap up of the past seven opens.
This jumpy behavior should be viewed with a skeptical brow raised, particularly given how low recent volumes have been with the exception of yesterday’s.
Yesterday’s session has created a large window in YINN’s price, which will be an area to keep an eye on in the coming weeks as it is likely to be filled.
While that occurs, it is important to have an understanding of how investors have behaved at YINN’s previously traded at price levels in order to understand how they may behave at these levels again.
This will help navigate how market participants may behave again at the same levels in the event of support level re-tests.
Price Level:Volume Sentiment Analysis Of YINN, The Direxion Daily FTSE China Bull 3x Shares ETF
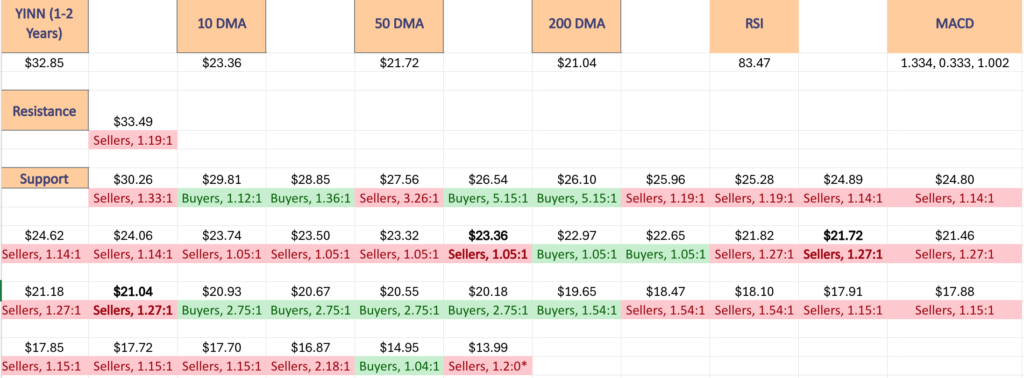
The top table below shows the support & resistance levels of YINN from the past year’s chart, as well as their price level:volume sentiment at each, using Tuesday 9/24/24’s closing price.
The moving averages are denoted with bold.
The next charts show the volume sentiment at each individual price level YINN has traded at over the past 1-2 years.
Beneath them is a copy & pasteable list of the same data, where the support/resistance levels are denoted in bold.
All ratios with “0” in the denominator are denoted with a “*”.
NULL values are price levels that had limited trading volume, whether it be due to gaps, quick advances or they are at price extremes; in the event that they are retested & there is more data they would have a distinct “Buyers”, “Sellers” or “Even” title.
This is not intended as financial advice, but rather another tool to consider when performing your own research & due diligence on YINN ETF.
YINN ETF’s Price Level:Volume Sentiment Over The Past 1-2 Years At Their One Year Support & Resistance Levels
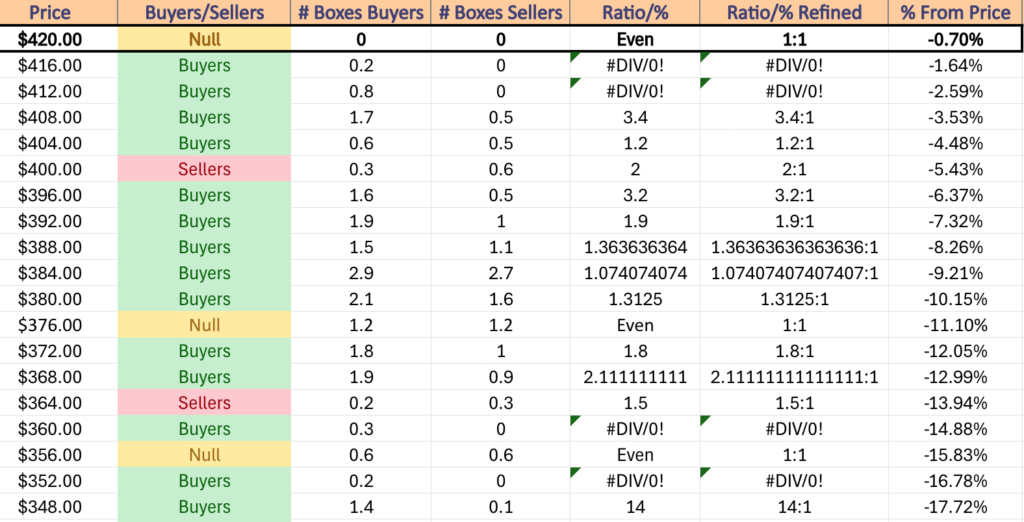
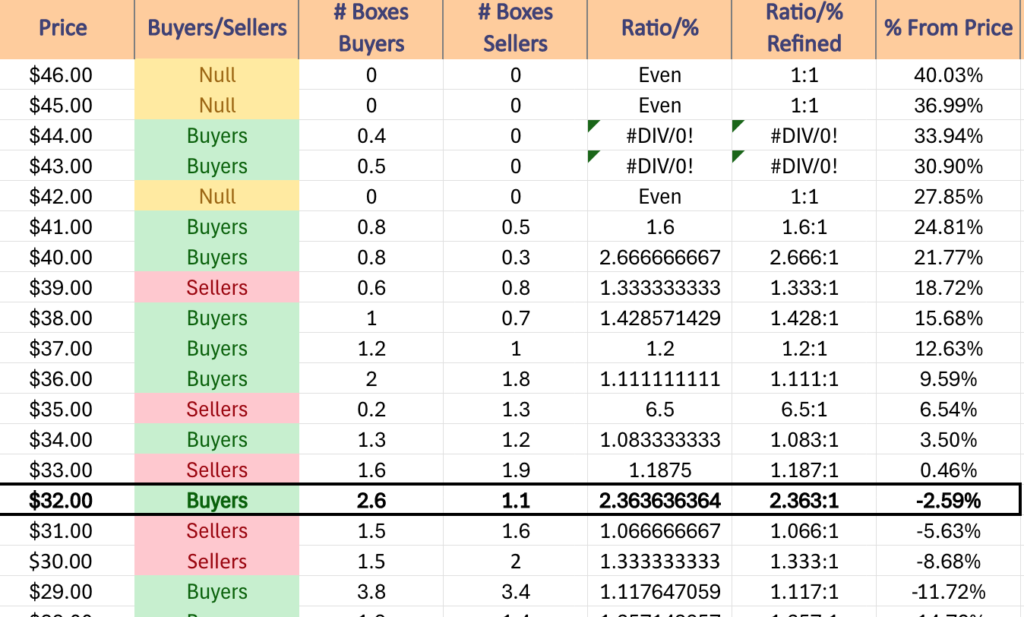
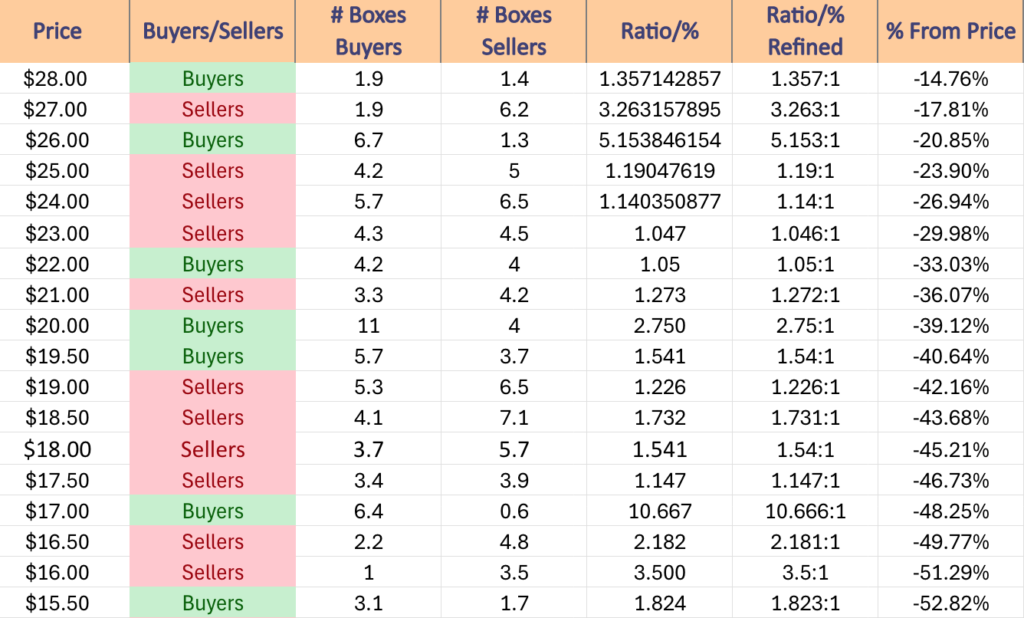
Price Level:Volume Sentiment For YINN ETF Over The Past 1-2 Years
Price Level:Volume Sentiment For YINN ETF Over The Past 1-2 Years
YINN ETF’s Price Level:Volume Sentiment Over The Past 1-2 Years
$46 – NULL – 0:0*, +40.03% From Current Price Level
$45 – NULL – 0:0*, +36.99% From Current Price Level
$44 – Buyers – 0.4:0*, +33.94% From Current Price Level
$43 – Buyers – 0.5:0*, +30.9% From Current Price Level
$42 – NULL – 0:0*, +27.85% From Current Price Level
$41 – Buyers – 1.6:1, +24.81% From Current Price Level
$40 – Buyers – 2.67:1, +21.77% From Current Price Level
$39 – Sellers – 1.33:1, +18.72% From Current Price Level
$38 – Buyers – 1.43:1, +15.68% From Current Price Level
$37 – Buyers – 1.2:1, +12.63% From Current Price Level
$36 – Buyers – 1.11:1, +9.59% From Current Price Level
$35 – Sellers – 6.5:1, +6.54% From Current Price Level
$34 – Buyers – 1.08:1, +3.5% From Current Price Level
$33 – Sellers – 1.19:1, +0.46% From Current Price Level
$32 – Buyers – 2.36:1, -2.59% From Current Price Level – Current Price Level*
$31 – Sellers – 1.07:1, -5.63% From Current Price Level
$30 – Sellers – 1.33:1, -8.68% From Current Price Level
$29 – Buyers – 1.12:1, -11.72% From Current Price Level
$28 – Buyers – 1.36:1, -14.76% From Current Price Level
$27 – Sellers – 3.26:1, -17.81% From Current Price Level
$26 – Buyers – 5.13:1, -20.85% From Current Price Level
$25 – Sellers – 1.19:1, -23.9% From Current Price Level
$24 – Sellers – 1.14:1, -26.94% From Current Price Level
$23 – Sellers – 1.05:1, -29.98% From Current Price Level – 10 Day Moving Average*
$22 – Buyers – 1.05:1, -33.03% From Current Price Level
$21 – Sellers – 1.27:1, -36.07% From Current Price Level – 50 & 200 Day Moving Averages**
$20 – Buyers – 2.75:1, -39.12% From Current Price Level
$19.50 – Buyers – 1.54:1, -40.64% From Current Price Level
$19 – Sellers – 1.23:1, -42.16% From Current Price Level
$18.50 – Sellers – 1.73:1, -43.68% From Current Price Level
$18 – Sellers – 1.54:1, -45.21% From Current Price Level
$17.50 – Sellers – 1.15:1, -46.73% From Current Price Level
$17 – Buyers – 10.67:1, -48.25% From Current Price Level
$16.50 – Sellers – 2.18:1, -49.77% From Current Price Level
$16 – Sellers – 3.5:1, -51.29% From Current Price Level
$15.50 -Buyers – 1.82:1, -52.82% From Current Price Level
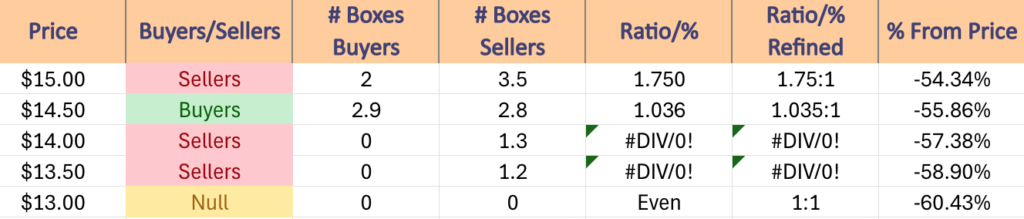
$15 – Sellers – 1.75:1, -54.34% From Current Price Level
$14.50 – Buyers – 1.04:1, -55.86% From Current Price Level
$14 – Sellers – 1.3:0*, -57.38% From Current Price Level
$13.50 – Sellers – 1.2:0*, -58.9% From Current Price Level
$13 – NULL – 0:0*, -60.43% From Current Price Level
*** I DO NOT OWN SHARES OR OPTIONS CONTRACT POSITIONS IN YINN ETF AT THE TIME OF PUBLISHING THIS ARTICLE ***