The VIX closed at 18.22, indicating an implied one day move of +/-1.15% & an implied one month move of +/-5.27% for the S&P 500.
Highest Technical Rated S&P 500 Components Per 5/13/2025’s Close:
1 – PLTR
2 – NRG
3 – GEV
4 – AXON
5 – TPR
6 – HWM
7 – FSLR
8 – CEG
9 – MOS
10 – AVGO
Lowest Technical Rated S&P 500 Components Per 5/13/2025’s Close:
1 – UNH
2 – MRNA
3 – ENPH
4 – ARE
5 – REGN
6 – BDX
7 – IQV
8 – HUM
9 – MRK
10 – DOW
Highest Volume Rated S&P 500 Components Per 5/13/2025’s Close:
1 – UNH
2 – FSLR
3 – ENPH
4 – PSX
5 – LNT
6 – DVA
7 – NRG
8 – BLDR
9 – HUM
10 – ELV
Lowest Volume Rated S&P 500 Components Per 5/13/2025’s Close:
1 – WST
2 – SYK
3 – SLB
4 – OMC
5 – MCO
6 – PNR
7 – AOS
8 – L
9 – ROST
10 – WTW
Highest Technical Rated ETFs Per 5/13/2025’s Close:
1 – ETU
2 – ROBN
3 – MAXI
4 – BTCL
5 – BITU
6 – AETH
7 – BTFX
8 – BITX
9 – EVAV
10 – PTIR
Lowest Technical Rated ETFs Per 5/13/2025’s Close:
1 – ETHD
2 – TSLZ
3 – TSLQ
4 – TSDD
5 – SOXS
6 – BTCZ
7 – SBIT
8 – MSOX
9 – FIAT
10 – HZEN
Highest Volume Rated ETFs Per 5/13/2025’s Close:
1 – EFFI
2 – SIXP
3 – EDGI
4 – PSCJ
5 – LIAX
6 – SPBC
7 – XBOC
8 – LFAE
9 – PBFR
10 – UBND
Lowest Volume Rated ETFs Per 5/13/2025’s Close:
1 – OOSP
2 – AUGZ
3 – AUGW
4 – PABU
5 – ECML
6 – FLUD
7 – DECZ
8 – MIG
9 – MOTE
10 – JEMB
Highest Technical Rated General Stocks Per 5/13/2025’s Close:
1 – RGC
2 – KDLY
3 – ASST
4 – DFDV
5 – NXTT
6 – AREN
7 – AIJTY
8 – GRYP
9 – ARGHF
10 – MHTX
Lowest Technical Rated General Stocks Per 5/13/2025’s Close:
1 – MULN
2 – AFMD
3 – EJH
4 – FMTO
5 – PTPI
6 – SUNE
7 – YHC
8 – STSS
9 – VOR
10 – ADTX
Highest Volume Rated General Stocks Per 5/13/2025’s Close:
1 – LOBO
2 – MOGO
3 – HCWB
4 – CNSP
5 – TWO
6 – NCL
7 – ALZN
8 – APYX
9 – EZGO
10 – ELWS
Lowest Volume Rated General Stocks Per 5/13/2025’s Close:
1 – NROM
2 – CHTR
3 – DXYN
4 – STLRF
5 – DTEGF
6 – MNXXF
7 – CVALF
8 – ARESF
9 – PYRGF
10 – CULL
*** THE LIST ABOVE IS STRICTLY FOR INFORMATIONAL PURPOSES – I MAY OR MAY NOT HAVE OR INITIATE A LONG, SHORT, OR LONG/SHORT POSITION IN ANY NAME ABOVE AT ANY TIME ***
The VIX closed at 18.39, indicating an implied one day move of +/-1.16% & an implied one month move of +/-5.32% for the S&P 500.
Highest Technical Rated S&P 500 Components Per 5/12/2025’s Close:
1 – NRG
2 – PLTR
3 – GEV
4 – TPR
5 – AXON
6 – HWM
7 – PODD
8 – PAYC
9 – CEG
10 – APH
Lowest Technical Rated S&P 500 Components Per 5/12/2025’s Close:
1 – MRNA
2 – UNH
3 – ENPH
4 – ARE
5 – REGN
6 – BDX
7 – ALB
8 – DOW
9 – LYB
10 – IQV
Highest Volume Rated S&P 500 Components Per 5/12/2025’s Close:
1 – NRG
2 – DRI
3 – FSLR
4 – ENPH
5 – MCK
6 – IQV
7 – MAS
8 – ZBRA
9 – SWK
10 – LNT
Lowest Volume Rated S&P 500 Components Per 5/12/2025’s Close:
1 – IRM
2 – ESS
3 – CPT
4 – FFIV
5 – MAA
6 – SNA
7 – PCG
8 – HES
9 – EIX
10 – SPGI
Highest Technical Rated ETFs Per 5/12/2025’s Close:
1 – EVAV
2 – ETU
3 – BABX
4 – MAXI
5 – BTCL
6 – BITU
7 – ROBN
8 – BTFX
9 – BITX
10 – BITW
Lowest Technical Rated ETFs Per 5/12/2025’s Close:
1 – ETHD
2 – TSLZ
3 – TSLQ
4 – TSDD
5 – HZEN
6 – MSOX
7 – SOXS
8 – BTCZ
9 – SBIT
10 – YANG
Highest Volume Rated ETFs Per 5/12/2025’s Close:
1 – CVRD
2 – EKG
3 – DIVL
4 – JHCP
5 – RWX
6 – MINV
7 – NDAA
8 – VCLN
9 – OCTQ
10 – USE
Lowest Volume Rated ETFs Per 5/12/2025’s Close:
1 – ABLG
2 – PBJA
3 – MYCH
4 – AUGZ
5 – FLAO
6 – AUGW
7 – MOTE
8 – DECZ
9 – USCA
10 – OVT
Highest Technical Rated General Stocks Per 5/12/2025’s Close:
1 – RGC
2 – KDLY
3 – AMMJ
4 – ASST
5 – GGEI
6 – NXTT
7 – DFDV
8 – GRYP
9 – SHMP
10 – SMFL
Lowest Technical Rated General Stocks Per 5/12/2025’s Close:
1 – NCNA
2 – EJH
3 – AXDX
4 – SUNE
5 – JBIO
6 – STSS
7 – APVO
8 – VSTE
9 – ADTX
10 – GDHG
Highest Volume Rated General Stocks Per 5/12/2025’s Close:
1 – INHD
2 – BAOS
3 – YHC
4 – OUT
5 – TAOP
6 – GDC
7 – WLGS
8 – KDLY
9 – SUP
10 – TANH
Lowest Volume Rated General Stocks Per 5/12/2025’s Close:
1 – ASDRF
2 – CTHR
3 – NFUNF
4 – AURX
5 – EQMEF
6 – PIFYF
7 – ALPIB
8 – CYSNYF
9 – BTSGU
10 – AHOTF
*** THE LIST ABOVE IS STRICTLY FOR INFORMATIONAL PURPOSES – I MAY OR MAY NOT HAVE OR INITIATE A LONG, SHORT, OR LONG/SHORT POSITION IN ANY NAME ABOVE AT ANY TIME ***
The VIX closed at 21.9, indicating an implied one day move of +/-1.38% & an implied one month move of +/-6.33% for the S&P 500.
Highest Technical Rated S&P 500 Components Per 5/9/2025’s Close:
1 – PLTR
2 – HWM
3 – AXON
4 – GEV
5 – PODD
6 – NFLX
7 – VRSN
8 – NRG
9 – PAYC
10 – TPR
Lowest Technical Rated S&P 500 Components Per 5/9/2025’s Close:
1 – MRNA
2 – REGN
3 – UNH
4 – BDX
5 – ALB
6 – DOW
7 – LYB
8 – ARE
9 – BLDR
10 – TMO
Highest Volume Rated S&P 500 Components Per 5/9/2025’s Close:
1 – PODD
2 – AKAM
3 – EXPE
4 – MCK
5 – MTCH
6 – MCHP
7 – LNT
8 – SOLV
9 – TECH
10 – FRT
Lowest Volume Rated S&P 500 Components Per 5/9/2025’s Close:
1 – AMCR
2 – AJG
3 – AVY
4 – XYL
5 – EQIX
6 – SNA
7 – JBL
8 – ALL
9 – CME
10 – SLB
Highest Technical Rated ETFs Per 5/9/2025’s Close:
1 – JNUG
2 – NUGT
3 – BTCL
4 – BITU
5 – LABD
6 – BTFX
7 – BITX
8 – GDMN
9 – AUMI
10 – MAXI
Lowest Technical Rated ETFs Per 5/9/2025’s Close:
1 – ETHD
2 – HZEN
3 – TSLZ
4 – TSLQ
5 – TSDD
6 – MSOX
7 – BTCZ
8 – SBIT
9 – LABU
10 – MRNY
Highest Volume Rated ETFs Per 5/9/2025’s Close:
1 – JGRW
2 – HOCT
3 – FTXH
4 – FBOT
5 – BCHP
6 – NBTR
7 – INRO
8 – BLCV
9 – PY
10 – LIAK
Lowest Volume Rated ETFs Per 5/9/2025’s Close:
1 – PABU
2 – CCNR
3 – AUGZ
4 – FFGX
5 – XTJL
6 – OVB
7 – USCA
8 – JEMB
9 – RSPR
10 – ZAUG
Highest Technical Rated General Stocks Per 5/9/2025’s Close:
1 – RGC
2 – BBIG
3 – ASST
4 – BLIAQ
5 – NXTT
6 – AREN
7 – AIJTY
8 – RGLS
9 – ONXGF
10 – OCG
Lowest Technical Rated General Stocks Per 5/9/2025’s Close:
1 – PTPI
2 – MULN
3 – JBIO
4 – SUNE
5 – FMTO
6 – AXDX
7 – IXHL
8 – VOR
9 – STSS
10 – APVO
Highest Volume Rated General Stocks Per 5/9/2025’s Close:
1 – TWO
2 – WBUY
3 – ILAG
4 – SRXH
5 – NVVE
6 – SHPH
7 – SYTA
8 – UNIT
9 – NXTT
10 – ABTS
Lowest Volume Rated General Stocks Per 5/9/2025’s Close:
1 – IDKFF
2 – BACK
3 – PLLTL
4 – CTHR
5 – VYCO
6 – DCMDF
7 – IVFH
8 – GCUMF
9 – SMTSF
10 – SSY
*** THE LIST ABOVE IS STRICTLY FOR INFORMATIONAL PURPOSES – I MAY OR MAY NOT HAVE OR INITIATE A LONG, SHORT, OR LONG/SHORT POSITION IN ANY NAME ABOVE AT ANY TIME ***
The VIX closed at 23.55, indicating an implied one day move of +/-1.48% & an implied one month move of +/-6.81% for the S&P 500.
Highest Technical Rated S&P 500 Components Per 5/7/2025’s Close:
1 – PLTR
2 – GEV
3 – HWM
4 – VRSN
5 – NFLX
6 – NRG
7 – CAH
8 – PM
9 – TKO
10 – APH
Lowest Technical Rated S&P 500 Components Per 5/7/2025’s Close:
1 – MRNA
2 – ENPH
3 – ALB
4 – BLDR
5 – SWK
6 – DOW
7 – BDX
8 – ARE
9 – APA
10 – LYB
Highest Volume Rated S&P 500 Components Per 5/7/2025’s Close:
1 – HOLX
2 – GOOGL
3 – DIS
4 – GOOG
5 – JKHY
6 – DAY
7 – CRL
8 – ROK
9 – GEN
10 – UBER
Lowest Volume Rated S&P 500 Components Per 5/7/2025’s Close:
1 – HES
2 – HUM
3 – ANSS
4 – GLW
5 – EW
6 – ELV
7 – LULU
8 – DG
9 – FITB
10 – CAT
Highest Technical Rated ETFs Per 5/7/2025’s Close:
1 – JNUG
2 – NUGT
3 – GDMN
4 – UGL
5 – MEXX
6 – LABD
7 – AUMI
8 – SGDM
9 – SHLD
10 – GOEX
Lowest Technical Rated ETFs Per 5/7/2025’s Close:
1 – HZEN
2 – TSLZ
3 – TSLQ
4 – TSDD
5 – MSOX
6 – ETHU
7 – ETHT
8 – GXLM
9 – MRNY
10 – BTCZ
Highest Volume Rated ETFs Per 5/7/2025’s Close:
1 – GPRF
2 – DMCY
3 – MIG
4 – TRSY
5 – KAUG
6 – KALL
7 – SHUS
8 – SMAP
9 – PBOC
10 – XTJL
Lowest Volume Rated ETFs Per 5/7/2025’s Close:
1 – CCNR
2 – PABU
3 – ABLG
4 – AUGZ
5 – FLAO
6 – AUGW
7 – NUGO
8 – TYLD
9 – TSEC
10 – OOSP
Highest Technical Rated General Stocks Per 5/7/2025’s Close:
1 – RGC
2 – ASST
3 – AIJTY
4 – RGLS
5 – OCG
6 – BLIAQ
7 – TOI
8 – TDUP
9 – AREN
10 – IPIX
Lowest Technical Rated General Stocks Per 5/7/2025’s Close:
1 – DGLY
2 – EJH
3 – PTPI
4 – MULN
5 – JBIO
6 – SUNE
7 – IXHL
8 – FMTO
9 – STSS
10 – PTN
Highest Volume Rated General Stocks Per 5/7/2025’s Close:
1 – TOVX
2 – NCEW
3 – TWO
4 – OUT
5 – ASST
6 – MEGL
7 – NSYS
8 – UNIT
9 – DGLY
10 – AVDX
Lowest Volume Rated General Stocks Per 5/7/2025’s Close:
1 – SROYF
2 – RDGT
3 – MUNMF
4 – DTEGF
5 – TSGZF
6 – BANL
7 – SNOA
8 – DBLVF
9 – AIRRF
10 – QMCI
*** THE LIST ABOVE IS STRICTLY FOR INFORMATIONAL PURPOSES – I MAY OR MAY NOT HAVE OR INITIATE A LONG, SHORT, OR LONG/SHORT POSITION IN ANY NAME ABOVE AT ANY TIME ***
The VIX closed at 24.76, indicating an implied one day move of +/-1.56% & an implied one month move of +/-7.16% for the S&P 500.
Highest Technical Rated S&P 500 Components Per 5/6/2025’s Close:
1 – PLTR
2 – HWM
3 – GEV
4 – VRSN
5 – NFLX
6 – CRWD
7 – NRG
8 – CEG
9 – CAH
10 – PM
Lowest Technical Rated S&P 500 Components Per 5/6/2025’s Close:
1 – MRNA
2 – ENPH
3 – CRL
4 – BDX
5 – ARE
6 – SWK
7 – BLDR
8 – TER
9 – DOW
10 – LYB
Highest Volume Rated S&P 500 Components Per 5/6/2025’s Close:
1 – VRTX
2 – CTRA
3 – TSN
4 – CLX
5 – MRNA
6 – DASH
7 – ZBH
8 – WAT
9 – PNW
10 – DAY
Lowest Volume Rated S&P 500 Components Per 5/6/2025’s Close:
1 – GLW
2 – NDAQ
3 – NXPI
4 – ESS
5 – AMAT
6 – WDAY
7 – RTX
8 – C
9 – IPG
10 – SCHW
Highest Technical Rated ETFs Per 5/6/2025’s Close:
1 – JNUG
2 – NUGT
3 – UGL
4 – GDMN
5 – AUMI
6 – LABD
7 – SGDM
8 – MEXX
9 – GOAU
10 – GOEX
Lowest Technical Rated ETFs Per 5/6/2025’s Close:
1 – HZEN
2 – TSLZ
3 – TSLQ
4 – TSDD
5 – ETHU
6 – ETHT
7 – GXLM
8 – MSOX
9 – JDST
10 – DTSRF
Highest Volume Rated ETFs Per 5/6/2025’s Close:
1 – SEPZ
2 – FLUD
3 – APRZ
4 – DECZ
5 – JEMB
6 – MARZ
7 – MAYZ
8 – SIFI
9 – NVBW
10 – IDLV
Lowest Volume Rated ETFs Per 5/6/2025’s Close:
1 – QMAG
2 – USCA
3 – AGRH
4 – TFJL
5 – MEM
6 – SHRT
7 – SSPY
8 – RVER
9 – OGSP
10 – DSCF
Highest Technical Rated General Stocks Per 5/6/2025’s Close:
1 – RGC
2 – AIJTY
3 – RGLS
4 – TDUP
5 – AREN
6 – TOI
7 – TMPOQ
8 – OCG
9 – ONXGF
10 – SALM
Lowest Technical Rated General Stocks Per 5/6/2025’s Close:
1 – EJH
2 – MULN
3 – PTPI
4 – JBIO
5 – IXHL
6 – SUNE
7 – STSS
8 – YHC
9 – WHLR
10 – CMLS
Highest Volume Rated General Stocks Per 5/6/2025’s Close:
1 – KTTA
2 – FOXO
3 – CAMP
4 – OUT
5 – MRIN
6 – AIFU
7 – BLMZ
8 – AQB
9 – MEGL
10 – OXBR
Lowest Volume Rated General Stocks Per 5/6/2025’s Close:
1 – CVALF
2 – CRCUF
3 – TOMZ
4 – WNW
5 – NAUFF
6 – GITS
7 – QTRHF
8 – ENZN
9 – DYNT
10 – LIFFF
*** THE LIST ABOVE IS STRICTLY FOR INFORMATIONAL PURPOSES – I MAY OR MAY NOT HAVE OR INITIATE A LONG, SHORT, OR LONG/SHORT POSITION IN ANY NAME ABOVE AT ANY TIME ***
The VIX closed at , indicating an implied one day move of +/-% & an implied one month move of +/-% for the S&P 500.
Highest Technical Rated S&P 500 Components Per 5/6/2025’s Close:
1 –
2 –
3 –
4 –
5 –
6 –
7 –
8 –
9 –
10 –
Lowest Technical Rated S&P 500 Components Per 5/6/2025’s Close:
1 –
2 –
3 –
4 –
5 –
6 –
7 –
8 –
9 –
10 –
Highest Volume Rated S&P 500 Components Per 5/6/2025’s Close:
1 –
2 –
3 –
4 –
5 –
6 –
7 –
8 –
9 –
10 –
Lowest Volume Rated S&P 500 Components Per 5/6/2025’s Close:
1 –
2 –
3 –
4 –
5 –
6 –
7 –
8 –
9 –
10 –
Highest Technical Rated ETFs Per 5/6/2025’s Close:
1 –
2 –
3 –
4 –
5 –
6 –
7 –
8 –
9 –
10 –
Lowest Technical Rated ETFs Per 5/6/2025’s Close:
1 –
2 –
3 –
4 –
5 –
6 –
7 –
8 –
9 –
10 –
Highest Volume Rated ETFs Per 5/6/2025’s Close:
1 –
2 –
3 –
4 –
5 –
6 –
7 –
8 –
9 –
10 –
Lowest Volume Rated ETFs Per 5/6/2025’s Close:
1 –
2 –
3 –
4 –
5 –
6 –
7 –
8 –
9 –
10 –
Highest Technical Rated General Stocks Per 5/6/2025’s Close:
1 –
2 –
3 –
4 –
5 –
6 –
7 –
8 –
9 –
10 –
Lowest Technical Rated General Stocks Per 5/6/2025’s Close:
1 –
2 –
3 –
4 –
5 –
6 –
7 –
8 –
9 –
10 –
Highest Volume Rated General Stocks Per 5/6/2025’s Close:
1 –
2 –
3 –
4 –
5 –
6 –
7 –
8 –
9 –
10 –
Lowest Volume Rated General Stocks Per 5/6/2025’s Close:
1 –
2 –
3 –
4 –
5 –
6 –
7 –
8 –
9 –
10 –
*** THE LIST ABOVE IS STRICTLY FOR INFORMATIONAL PURPOSES – I MAY OR MAY NOT HAVE OR INITIATE A LONG, SHORT, OR LONG/SHORT POSITION IN ANY NAME ABOVE AT ANY TIME ***
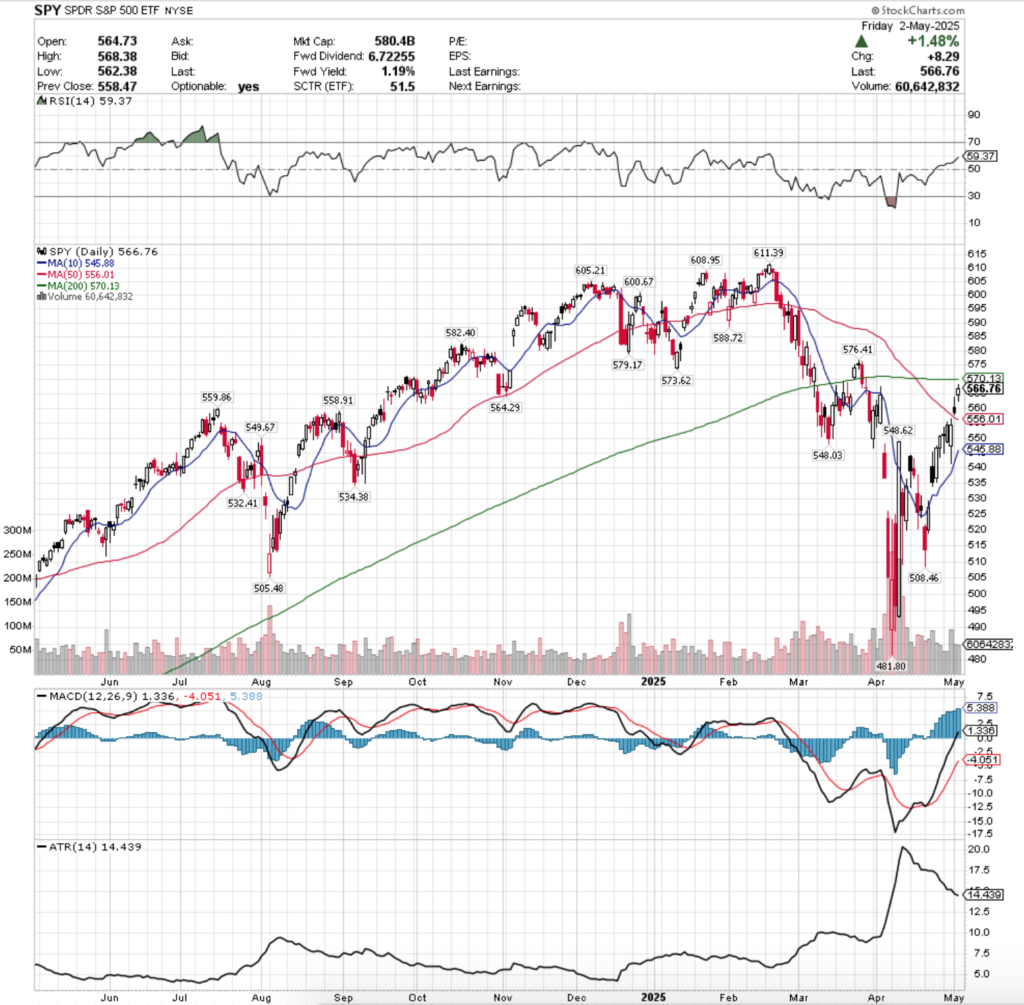
SPY, the SPDR S&P 500 ETF gained +2.93% last week, while the VIX closed the week out at 22.68, indicating an implied one day move of +/-1.43% & an implied one month move of +/-6.56%.
SPY ETF – SPDR S&P 500 ETF’s Technical Performance Over The Past Year
Their RSI is trending higher in the wake of last week & sits currently at 59.37, while their MACD is very bullish, but beginning to look a bit overextended, which will be something to keep an eye on heading into this week.
Volumes were +12.4% higher than the prior year’s average level (62,480,000 vs. 55,589,562), which paints an interesting set up to start the new week for a couple of reasons.
Mind you, in previous weeks/months’ notes (minus last week, as there was no note due to a charity event) I’ve mentioned how for there to be any type of uptrend it needs to find sustainable footing & steady advancing volume that is heavier than we’ve seen.
Last week’s volume was indeed higher, but but when we break down the day-over-day price action things aren’t quite spelling “liftoff” just yet.
Starting with Monday, SPY opened on a gap up with low volume that resulted in a high wave doji candle, covering a wide range of prices during the session, but indicating indecision/a point of “equilibrium” based on the opening/closing prices.
SPY was favoring the downside more than the upside based on the size of the day’s lower shadow, which dipped down as low as $545.02/share, indicating that there was still an appetite that low, despite the day opening on a gap up from Friday’s session.
Tuesday also flashed warning signals, as on yet another low volume session the day opened on a gap lower, but that managed to power higher & form a bullish engulfing candle for the day.
Granted, the preceding day was a doji & the volumes were low, but the day covered a wide range of prices making the bullish engulfing pattern inevitable, and the low volume on a wide-range day is not exactly something that screams “confidence” or “excitement” among market participants.
Wednesday also signaled caution, where another daily bullish engulfing candle pattern occurred on the week’s highest volume session, but again there was a twist.
The session opened on a gap down, before it declined down to the $541.52/share price level, which happened to be just above the support of the 10 day moving average.
Prices then climbed higher to flirt with just below the 50 day moving average’s resistance, and only managed to close just above Tuesday’s closing price.
This is where things get interesting, as there was clearly short-term/intra-day profit taking going on based on the volume, and this session covered the widest range of prices of the entire week.
While a high volume bullish engulfing day tends to be a good sign, the rest of the week casts shadows of doubt upon it.
Thursday opened on a gap up that opened above the 50 DMA’s resistance, went higher to $564.07, but ultimately profits were taken & the price was drive to close lower than the open, but still above the 50 DMA’s support.
While this occurred on the second highest volume of the week, the lower close than opening price & shooting star appearance of the day’s candle cast doubt onto how sustainable the move was.
Friday also added an interesting layer of complexity, as the day opened on a gap higher, but was unable to reach the resistance of the 200 day moving average, indicating that the long-term trend is still in tact.
The day closed on the third highest volume of the week as a spinning top candle, indicating that there’s a lot of indecision in the market.
With that, heading into this week there are a few interesting catalysts to watch, including a notable number of earnings reports due out & the FOMC decision/Powell Press Conference Wednesday.
Tuesday’s trade balance data may also be interesting given how much attention has been being paid to the tariff situation recently, but of the three listed events I’d guess earnings will be the most likely catalyst for market movement in any direction.
Looking into next week’s SPY performance, the big story is the long-term trend line & how sturdy it is.
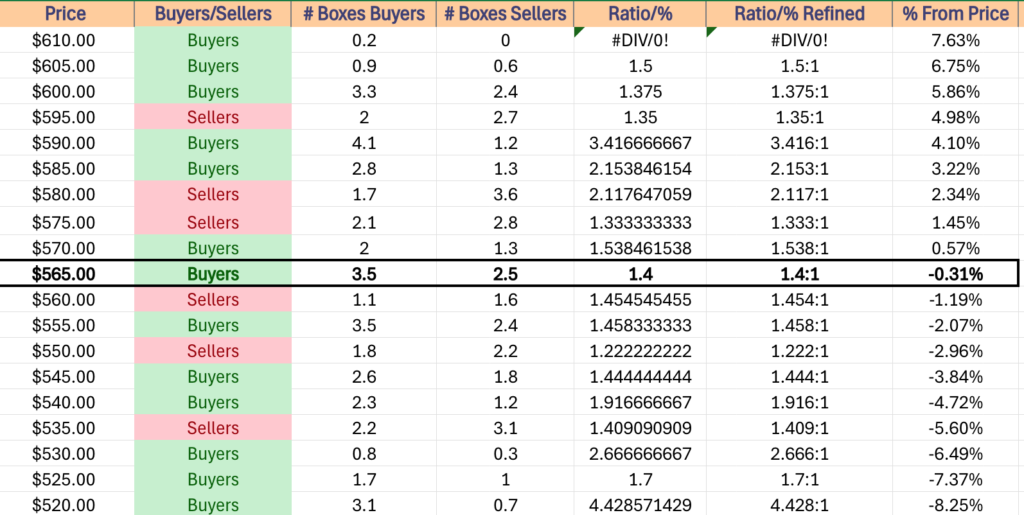
Currently the 200 day moving average is the next resistance level, and it resides in a Buyer dominated zone (1.54:1), along with the next highest resistance level ($573.62).
The most likely way that the long-term trend is broken to the upside will be temporarily & because of a gap up that opens above the 200 DMA’s resistance.
There are a couple of windows to be closed from last week, which will bring the 50 day moving average’s support into question; but unless we get squeezed higher & rally it seems the most likely upside case is oscillation around SPY’s 200 DMA while awaiting a larger upside or downside catalyst.
There’s quite a bit of uncertainty out there still, as mentioned above, and even in the event of a little bit of positive momentum developing, the $575-548.99/share price zones are Seller dominated, which are another reason that there will need to be significant increases in advancing volume for an uptrend to take place & prevail.
The $576.41/share is the upside point of interest if the long-term trend line is broken out above, as the way that market participants greet that resistance level will lend clues into the higher, but also Seller dominated near-term resistance points in an attempt at an uptrend.
Consolidation from where we sit now looks like filling in of the gaps that were just created on Thursday & Friday, before some type of oscillation around the 50 DMA & 200 DMA to the upside while awaiting a similar catalyst, but this will also be dependent on how price moves due to the changes of the 10 day moving average.
To the downside there will also need to be extra attention paid to the large window created on 4/23/2025, as when that fills in the $508.46, $505.48 & $481.80 marks will all become focal points in terms of range on a one year chart.
The table below lends insight into how market participants may behave at all of the retests listed above based on their behavior over the past ~3 years.
SPY has support at the $564.29 (Volume Sentiment: Sellers, 1.46:1), $559.86 (Volume Sentiment: Buyers, 1.46:1), $558.91 (Volume Sentiment: Buyers, 1.46:1) & $556.01/share (50 Day Moving Average, Volume Sentiment: Buyers, 1.46:1) price levels, with resistance at the $570.13 (200 Day Moving Average, Volume Sentiment: Buyers, 1.54:1), $573.62 (Volume Sentiment: Buyers, 1.54:1), $576.41 (Volume Sentiment: Sellers, 1.33:1) & $579.17/share (Volume Sentiment: Sellers, 1.33:1) price levels.
SPY ETF’s Price Level:Volume Sentiment Over The Past ~3 Years
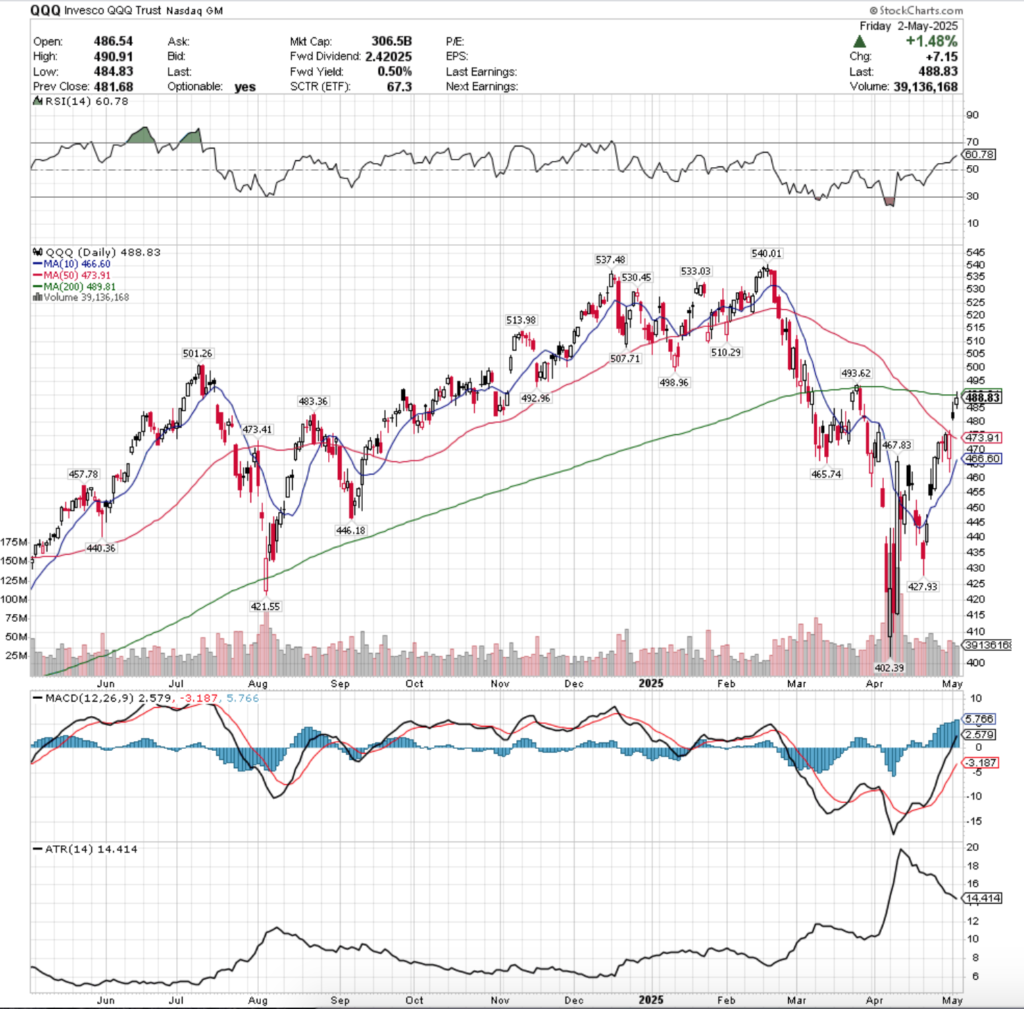
QQQ ETF – Invesco QQQ Trust ETF’s Technical Performance Over The Past Year
Their RSI is trending higher & is currently at 60.78, while their MACD is bullish, but beginning to show signs of possible over extension following the two gaps at the end of last week.
Volumes were +5.79% higher than the prior year’s average level (38,702,000 vs. 36,584,821), which like SPY, is not sufficient to claim a sustainable uptrend & last week’s performance leaves many questions about the near-term future for QQQ.
QQQ’s week began on a slow note as well, as a low volume session resulted in a high-wave doji, which while the body resided near the top, did not leave market participants with a strong sense of optimism.
The muted optimism based on the low participation was not a great sign, confirmed by Tuesday opening on a gap down lower.
On even lower volume QQQ was able to power higher despite the soft opening, forming a bullish engulfing pattern with Monday’s candle; however it was not convincing.
Wednesday also signaled frailty for QQQ, as the session opened on a gap lower that was near the low end of Monday’s range, broke down below the $465/share level to reach an intraday low of $462.43, before the week’s strongest volume power it higher to temporarily break above the resistance of the 50 day moving average.
QQQ closed just below the 50 DMA, indicating that the medium-term trend line was still serving as a ceiling & dimming the optimism on true market sentiment.
Thursday opened on a gap up, well above the 50 DMA, broke above the $485/share level intraday, before crumbling to close below its opening price level of the day, forming a shooting star candle & signaling that there was still blood in the water.
Friday the week ended on a note confirming this, as despite a gap up open & brief breakout above the 200 day moving average, QQQ sunk lower to close beneath it & as a spinning top candle, indicating indecision among market participants.
Heading into this week the long-term trend line is going to be in focus, as it managed to close the week as a resistance level.
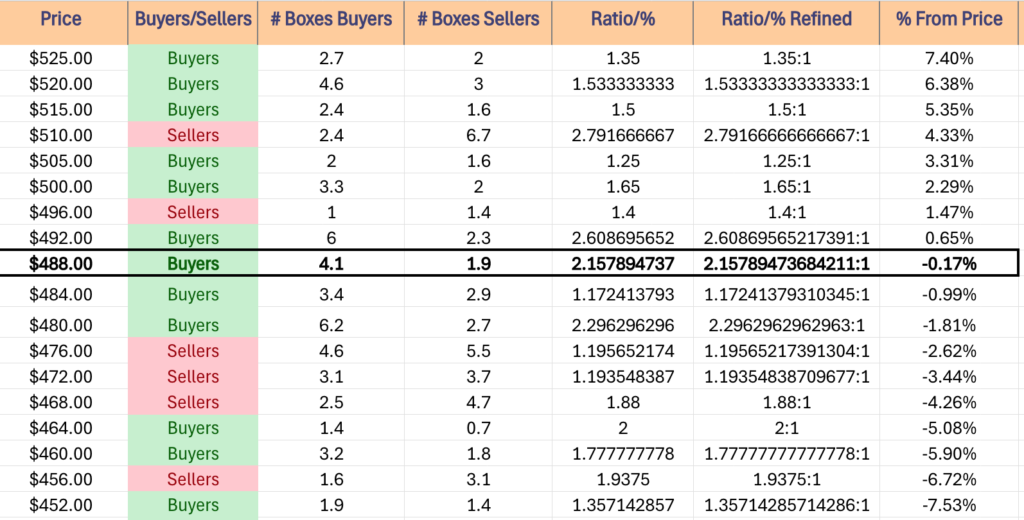
Should QQQ break out above it the $493.62/share level is the next area of interest, as the $496-499.99/share price zone is a Seller dominated one over the past ~2-3 years, which will pose an issue for QQQ as it tries to climb higher.
Again, as has been noted extensively over the past couple of months, this will require an influx in sustainable advancing volume to actually be meaningful & last.
More likely is that we see a consolidation as the windows caused by the end of week gaps close & prices oscillate between the 50 & 200 day moving averages while we await an upside or downside catalyst.
In terms of declines, should the 50 DMA’s support break down during those window closings, all eyes should direct towards the $445/share price level, as that is the low end of the window from mid-April, with next priority going to $427.93, $421.55 & $402.39/share.
In the meantime, the table below is valuable for assessing the strength & weakness of QQQ’s support/resistance levels when they come back for retests in the near-term based on the past ~2-3 years.
QQQ has support at the $483.36 (Volume Sentiment: Buyers, 2.3:1), $473.91 (50 Day Moving Average, Volume Sentiment: Sellers, 1.19:1), $473.41 (Volume Sentiment: Sellers, 1.19:1) & $466.60/share (10 Day Moving Average, Volume Sentiment: Buyers, 2:1) price levels, with resistance at the $489.81 (200 Day Moving Average, Volume Sentiment: Buyers, 2.16:1), $492.96 (Volume Sentiment: Buyers, 2.61:1), $493.62 (Volume Sentiment: Buyers, 2.61:1) & $498.96/share (Volume Sentiment: Sellers, 1.4:1) price levels.
QQQ ETF’s Price Level:Volume Sentiment Over The Past ~2 Years
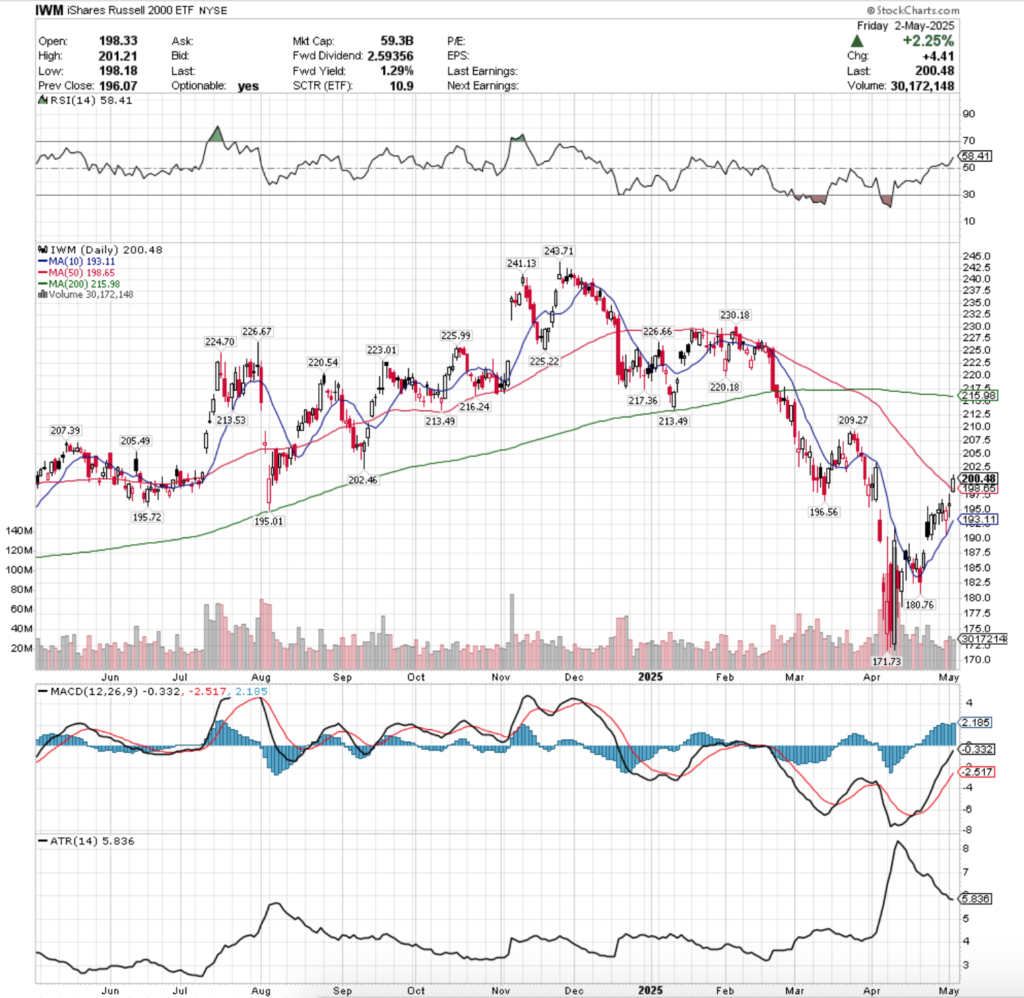
IWM, the iShares Russell 2000 ETF climbed +3.28% last week, as small caps were the second favorite names by market participants for the week.
IWM ETF – iShares Russell 2000 ETF’s Technical Performance Over The Past Year
Their RSI is also trending higher & currently is 58.41, while their MACD is bullish, but has shown undulations in its histogram, indicating that there is some weakness due to the consolidation range of the past two weeks (sans Thursday & Friday).
Volumes were -9.32% lower than the previous year’s average (27,004,000 vs. 29,778,606), which casts a shadow of doubt onto the weekly gains, as there was limited participation behind the move.
Monday the week opened on low volume for IWM & signaled immediately that there was uncertainty as to which direction the small cap index would go, as the day resulted in a spinning top candle nestled in the high end of their recent consolidation range.
Tuesday produced a bullish engulfing pattern for IWM, but again on very weak volume, indicating that there was still quite a bit of uncertainty, especially given that Monday’s candle was a spinning top.
The length of the session’s lower shadow also signaled that there was still significant downside appetite, almost to as low as the previous day.
Wednesday followed suit with SPY & QQQ, opening on a gap lower, testing down to the support of the 10 day moving average, before powering higher to briefly break out above the $195/share level & close above the day’s open.
While volumes were higher than Monday & Tuesday, they were still muted for the size of the range that the day’s price action covered.
Thursday opened on a gap up, but resulted in a high wave spinning top that closed on the week’s highest volume.
While this means that there is clearly some high range appetite, the profit taking that drove prices lower both early on in the session & after the highs of the day were hit show that there is more of an interest in preserving capital right now in terms of market participants & the small cap index.
Friday the week wound down on an interesting note, as the session opened on a gap higher to just below the resistance of the 50 day moving average, before on the second highest volume of the week breaking out above it to close above the $200/share price level.
This week will be interesting to see how IWM & the 50 DMA interact, given that their 200 DMA is still rather far above them, indicating that the long-term trend looks stable & won’t change for some time.
In terms of an upside move, while it’s not an official resistance level, the $203.33/share level will be an area of interest to see if the scallop can become a cup & handle & take off, or if we see a denial & consolidation.
If it breaks out to the upside, the $209.27/share level will be the next area of interest, due to its proximity to the 200 day moving average’s resistance.
Like SPY & QQQ, there will need to be an influx in advancing volume that remains consistent before anything on this front is considered possibly more than just a brief pump/squeeze.
The consolidation case from Friday’s close involved the Thursday-Friday window being closed & an oscillation around the 50 day moving average while waiting on an upside or downside catalyst, which will become interesting the closer that the 10 day moving average gets to both levels.
In terms of the downside, the 10 DMA’s support will be a key area to watch, as should prices break down & meet the 10 DMA, controlled bleeding will come from IWM oscillating around it while consolidating lower, else, more dramatic declines call into play the two lowest support levels on their one year chart, $180.76 & $171.71/share.
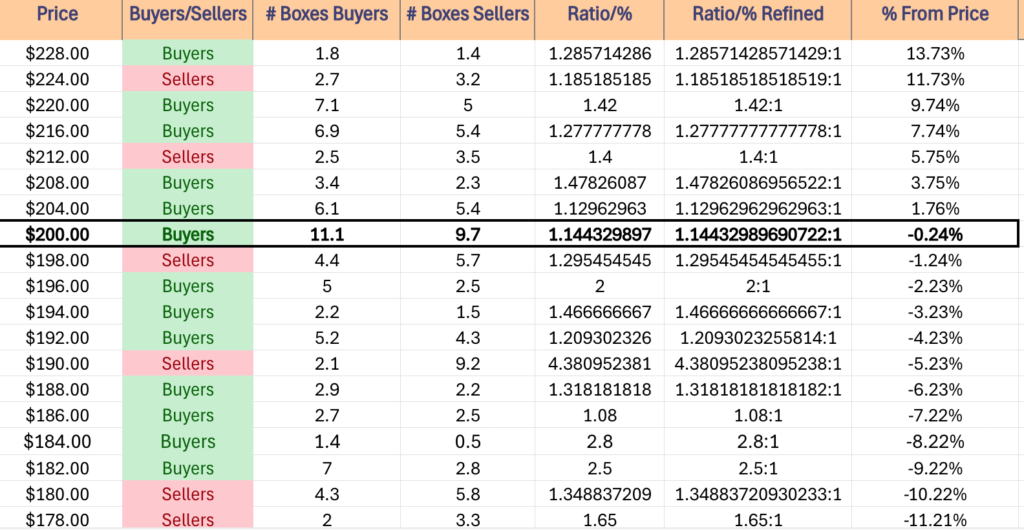
Using the table below will help navigate these retests as it is all volume sentiments from each price level IWM has traded at over the past ~3 years.
IWM has support at the $198.65 (50 Day Moving Average, Volume Sentiment: Sellers, 1.3:1), $196.56 (Volume Sentiment: Buyers, 2:1), $195.72(Volume Sentiment: Buyers, 1.47:1) & $195.01/share (Volume Sentiment: Buyers, 1.47:1) price levels, with resistance at the $202.46 (Volume Sentiment: Buyers, 1.14:1), $205.49 (Volume Sentiment: Buyers, 1.13:1), $207.39 (Volume Sentiment: Buyers, 1.13:1) & $209.27/share (Volume Sentiment: Buyers, 1.48:1) price levels.
IWM ETF’s Price Level:Volume Sentiment Over The Past ~2-3 Years
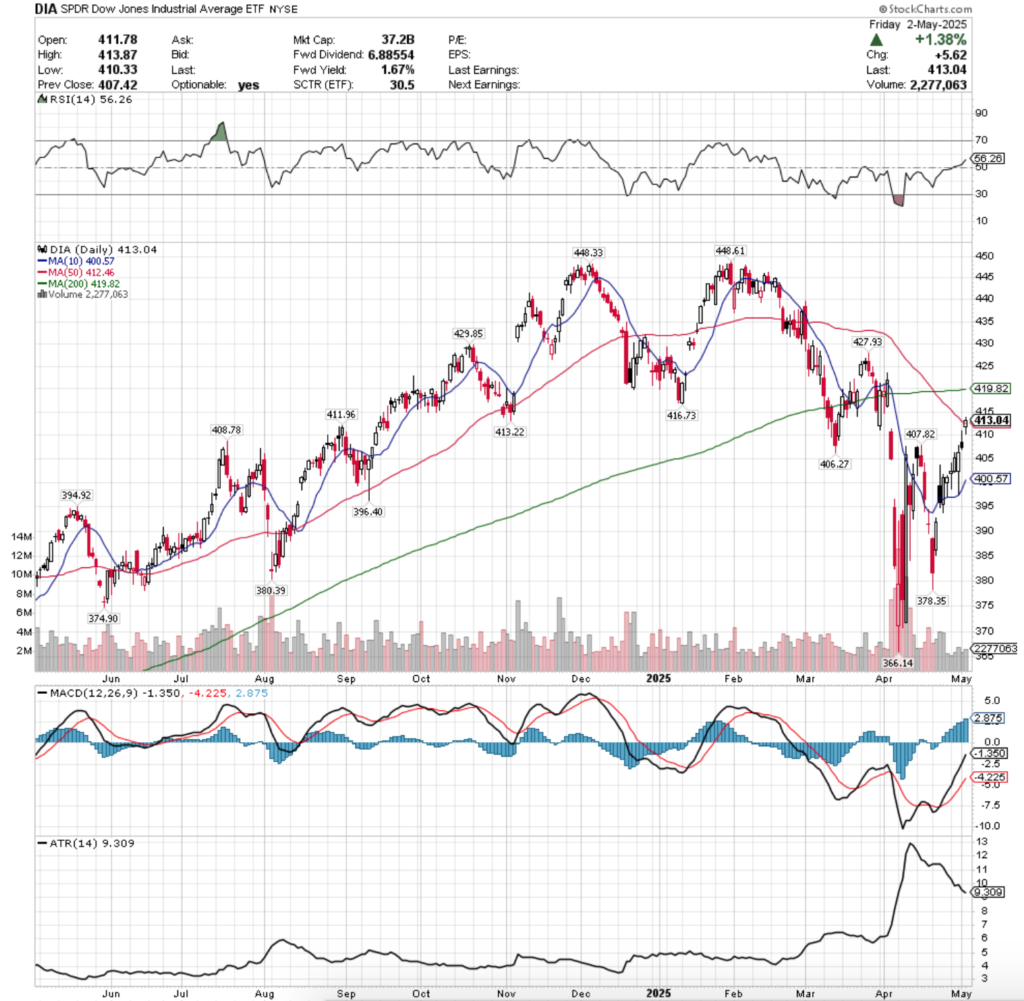
DIA ETF – SPDR Dow Hones Industrial Average ETF’s Technical Performance Over The Past Year
Their RSI is trending higher & currently sits at 56.26, while their MACD is beginning to show signs of being over-extended (which history has shown is less important for DIA vs. other indexes).
Volumes were -36.72% lower than the prior year’s average level (2,022,000 vs. 3,195,498), which is showing a severe level of distrust/caution by market participants, given that the bluechip index was the favorite among market participants for so long, regardless of what the other indexes were doing.
Now we’r not seeing that steady buying anymore, but DIA has still proven to be more closely tied to how IWM is trading, but with more advances as it is still seen as a safer haven for money compared to the small cap names.
Monday DIA opened up on ultra-weak volume & closed as a narrow range, high wave spinning top candle, indicating that there was a lot of indecision, pumping & profit taking.
Tuesday featured less volume, but managed to open higher & break above the $405/share level & stay there to close higher, but the limited participation signals that there is a hefty amount of skepticism in the index that was previously the safe haven among the major four indexes.
Wednesday opened in-line with Tuesday’s opening price, tested much lower down to the 10 day moving average, before reversing to trend higher & close out the session as an advance.
Thursday opened on a gap up, tested above the $410/share level, but was swatted back down to below the high of Wednesday to close in a shooting star candle that closed lower than it opened, indicating that there is still a bit of bearishness creeping in, despite the optimistic squeeze higher.
Friday followed the other index ETFs & saw a squeeze pinched higher gap up open for DIA, that managed to break above the resistance of the 50 day moving average & close just above it, but the lowest shadow & proximity away from the long-term trend line is cause for concern.
While the lower shadow can possibly be attributed to profit taking based on it being the second highest volume session of the week, there seems to be other explanations.
DIA has a unique position due to how it has proven resilient when other indexes were consolidating or declining over the past year as times became more volatile.
However, upside case to watch this week is revolving around the 200 day moving average, and whether or not DIA gaps above it, and if so how strongly supported the move is by their volume.
Consolidation case is DIA dips back below the 50 DMA & closes the window from Friday, before oscillating around the 50 DMA waiting for a catalyst one way or the other, and or the bear case.
The bear case here has its target on the 10 day moving average, as it will continue moving higher, and unless folks actually begin jumping out of the pool, there’s still going to be consistent, but muted demand for blue chip names.
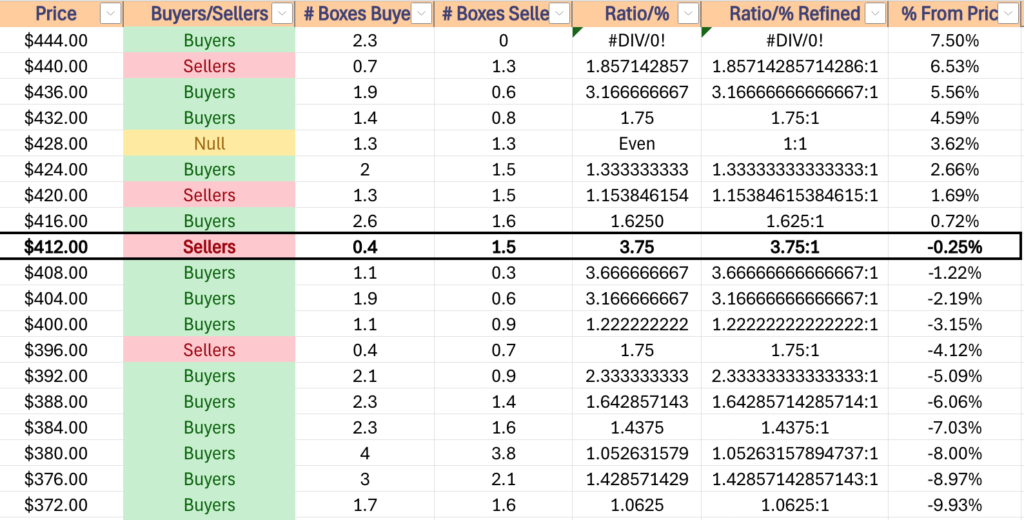
When referencing the table below it is wise to keep in mind that DIA has been the most resilient of the four majors, and as a result has a Buyers bias at most price levels from their last ~4-5 years of data for volume sentiment.
If there is a larger reason for folks to jump from the pool then the 10 DMA will certainly break down, but for now it is too ambiguous to tell what may happen.
Regardless, when interpreting the data, read the ratios as “Hotter” or “Colder” compared to one another when seeing a list of multiple Buyer zones in a consecutive series, as from there you can rank the relative strengths of each price level despite being in a swamp of “Buyers”.
DIA has support at the $412.46 (50-Day Moving Average, Volume Sentiment: Sellers, 3.75:1), $411.96 (Volume Sentiment: Buyers, 3.67:1), $408.78 (Volume Sentiment: Buyers, 3.67:1) & $407.82/share (Volume Sentiment: Buyers, 3.17:1) price levels, with resistance at the $413.22 (Volume Sentiment: Sellers, 3.75:1), $416.73 (Volume Sentiment: Buyers, 1.63:1), $419.82 (200 Day Moving Average, Volume Sentiment: Buyers, 1.63:1) & $427.93/share (Volume Sentiment: Buyers, 1.33:1) price levels.
DIA ETF’s Price Level:Volume Sentiment Over The Past ~4 Years
The Week Ahead
Monday the week kicks off with S&P Final U.S. Services PMI at 9:45 am, followed by ISM Services at 10 am.
Ares Management, BioCryst Pharma, BioNTech, CNA Financial, Cummins, Freshpet, Henry Schein, Integra, JBT Marel, Ocular Therapeutix, onsemi, Park Hotels & Resorts, Recursion Pharmaceuticals, RLJ Lodging, Twist Bioscience, Tyson Foods & Zimmer Biomet all report earnings before Monday’s opening bell, with Addus HomeCare, Aecom Tech, Air Lease, Ameresco, Atlas Energy Solutions, BellRing Brands, Bright Horizons, BWX Technologies, Cabot, Celanese, Clorox, Corcept Therapeutics, Corebridge Financial, Coterra Energy, Denny’s, Diamondback Energy, Dorman Products, Douglas Dynamics, Ethan Allen, EverQuote, Fabrinet, Ford Motor, Golub Capital, Hims & Hers Health, IAC, ICHOR, Ingevity, Inspire Medical Systems, Interparfums, JELD-WEN, Kilroy Realty, Lattice Semi, Limbach, LTC Properties, Matson, Mattel, Mueller Water, National Health, National Storage Affiliates, Navitas Semiconductor, Neurocrine Biosciences, New Mountain Finance, NJ Resources, ONE Gas, Otter Tail Power, Palantir Technologies, Palomar Holdings, Paymentus, Playa Hotels & Resorts, PRA Group, Primoris Services, Realty Income, Regal Rexnord, Relay Therapeutics, Sabra Health Care REIT, Sun Communities, Syndax Pharmaceuticals, Talos Energy, Tidewater, Titan America, Upwork, V2X, Vertex Pharma, Vimeo, Viper Energy Partners, Vornado Realty Trust & Williams Cos. all reporting after the closing bell.
U.S. Trade Deficit data is released on Tuesday at 8:30 am.
Tuesday morning’s earnings reports include AdaptHealth, ADM, American Electric, Aramark, Array Tech, Atkore International, Avanos Medical, Avient, Axcelis Tech, Ball Corp, CCC Intelligent Solutions, Colliers, Constellation Energy, Cormedix, Datadog, DigitalOcean, Driven Brands, Ducommun, Duke Energy, Embraer, Energizer, Enpro, EVgo, Ferrari, Fidelity National Info, First Watch Restaurant Group, Gartner, Genius Sports, Global Payments, GlobalFoundries, Harmony Biosciences, Ingredion, IPG Photonics, IQVIA, Jacobs Solutions, KBR, Knife River, Kontoor Brands, Krystal Biotech, Kulicke & Soffa, LCI Industries, Lear, Leidos, Lemonade, Louisiana-Pacific, Marathon Petroleum, Marriott, MFA Financial, MPLX LP, Northwest Natural, Novanta, Omnicell, Peabody Energy, Pediatrix Medical Group, Philips, Portillo’s, Premier, Sealed Air, Shoals Technologies, SolarEdge Technologies, Sunoco LP, Sunstone Hotel, TopBuild, Transdigm Group, TreeHouse Foods, UBS, UL Solutions, Uniti Group, Waters, WEC Energy Group, WK Kellogg, Xometry, XPEL & Zoetis, with Advanced Micro Devices, Agilon Health, Allegiant Travel, Amentum Holdings, American Financial, Andersons, Arcosa, Arcus Biosciences, Arista Networks, Assurant, Astera Labs, AZEK, BlackLine, Cadre Holdings, California Resources, Chemours, Chord Energy, Cirrus Logic, Corpay, Corsair Gaming, Coty, Coupang, Cytokinetics, Devon Energy, DHT, Douglas Emmett, Electronic Arts, Energy Transfer, eXp World Holdings, Flywire, Fortune Brands Innovations, Gen Digital, Grand Canyon Education, Grocery Outlet, Halozyme Therapeutics, Helios Technologies, Horace Mann, Innovex International, Intapp, International Flavors, Jack Henry, Jamf Holding, Jazz Pharma, Kinross Gold, Klaviyo, Lucid Group, Lumentum, Manitowoc, Maravai Life Sciences, Masimo, Mercury, Mosaic, MRC Global, NerdWallet, Ovintiv, Par Pacific, Powell Industries, PTC Therapeutics, Qualys, Redfin, Resideo, Revolve Group, Rivian Automotive, Sarepta Therapeutics, Select Water Solutions, Supernus Pharma, Tempus AI, Teradata, The Baldwin Group, Upstart, Varonis Systems, Vestis, Voya Financial, VSE Corp & Wynn Resorts all due to report after the session’s closing bell.
Wednesday features the FOMC Meeting at 2pm, Chair Powell’s Press Conference at 2:30 pm, & Consumer Credit data at 3pm.
Walt Disney, Acushnet, Adient, Ardmore Shipping, ATS, AvidXchange, Avista, Axalta Coating Systems, Azenta, Bandwidth, Barrick, BeiGene, Bentley Systems, Bio-Techne, Bloomin’ Brands, BorgWarner, Bruker, Bunge, CDW, Cencora, Centuri Holdings, Ceva, Charles River, Conduent, Dayforce, Delek US Holdings, Dine Brands, DNOW, Edgewell Personal Care, Elanco Animal Health, Emerson, Entegris, Fiverr, Flex, Fortis, Geo Group, Geron, Hain Celestial, HNI, Johnson Controls, Jones Lang LaSalle, Kennametal, Lantheus Holdings, LifeStance Health Group, LivaNova, Magnera, MarketAxess, MasterCraft, Middleby, National Vision, New York Times, NiSource, ODP, Oscar Health, Owens Corning, Pagaya, Payoneer, Performance Food Group, Perrigo, Rhythm Pharmaceuticals, Rockwell Automation, RXO, Sabre, Shopify, Southwest Gas, Steve Madden, Taboola, Teva Pharma, TPG, Trimble, TripAdvisor, Uber, Unity Software, Verisk Analytics & Vertex all report earnings before Wednesday’s opening bell, followed by ACADIA Pharmaceuticals, ACV Auctions, ADTRAN, Alpha and Omega Semi, AMC Entertainment, Amdocs, American States Water, Amplitude, APA, AppLovin, Arm Holdings, Atmos Energy, Avis Budget, Axon, B&G Foods, B2Gold, Barrett Business, Beyond Meat, Black Hills, Blue Bird, Brighthouse Financial, BrightView, Bumble, Carvana, Centrus Energy, CF Industries, Chesapeake Utilities, Civitas Resources, Cleveland-Cliffs, Coeur Mining, Coherent, Compass Materials, Concentra, Copa Holdings, Core Scientific, CoreCivic, Corteva, Crane NXT, CSG Systems, Curtiss-Wright, Digi International, DoorDash, Dutch Bros, Encore Capital, Energy Recovery, EPR Properties, Esco Tech, Establishment Labs, EVERTEC, Evolus, Excelerate Energy, Fastly, Fidelity National, Fluence, Flutter Entertainment, Fortinet, Forward Air, FS KKR Capital, Genco Shipping & Trading, Genpact, GoodRx, GXO Logistics, H&R Block, Houlihan Lokey, Howard Hughes Holdings, Informatica, Innovative Industrial Properties, IonQ, Jackson Financial, Joby Aviation, Kinetik, Kodiak Gas Services, Kratos Defense and Security, Kyndryl, LandBridge, LegalZoom, Light & Wonder, Magnite, Manulife Financial, Marqeta, Marriott Vacations, MKS Instruments, Murphy Oil, Murphy USA, NCR Atleos, Occidental Petroleum, OPENLANE, Orion Engineered Carbons, Ormat Technologies, Pan Am Silver, Paycom Software, Permian Resources, Pitney Bowes, Primerica, Q2 Holdings, Qiagen, QuidelOrtho, QuinStreet, Radware, RB Global, Remitly Global, Root, Royal Gold, RxSight, Schrodinger, Sinclair Broadcast, SiTime, Sitio Royalties, Skyworks, Sonos, STAAR Surgical, Suncor Energy, Sunrun, Symbotic, Tetra Tech, U.S. Physical Therapy, UGI, Veeco Instruments, Veracyte, Verra Mobility, Vishay, Watts Water Technologies, Western Midstream & Zillow after the closing bell.
Initial Jobless Claims & U.S. Productivity data are released on Friday at 8:30 am, before Wholesale Inventories data comes out at 10 am.
Thursday morning’s earnings reports include ACI Worldwide, ACM Research, Alight, Allegro Microsystems, Allete, Altice USA, Americold Realty Trust, Appian, Aspen Aerogels, Autohome, BCE, BigCommerce, Canada Goose, Cars.com, Cheniere Energy, Choice Hotels, Clear Secure, Cogent Communications, ConocoPhillips, Core Natural Resources, Crocs, Enovis, EPAM Systems, Evergy, First Advantage, Genesis Energy LP, Gray Media, Green Plains, Haemonetics, Hanesbrands, Insmed, Installed Building Products, International Seaways, Janus International Group, Kenvue, Kimbell Royalty Partners, Krispy Kreme, Lamar Advertising, Life Time, Ligand Pharmaceuticals, Lincoln National, MACOM Tech, Malibu Boats, Match Group, MAXIMUS, MDU Resources, Millicom International Cellular, Molson Coors Brewing, N-able, NCR Voyix, NetScout Systems, Nexstar, Nomad Foods, Nova Measuring, Nutrien, Olaplex, Papa John’s, Peloton, PENN Entertainment, Planet Fitness, Playtika, Prestige Consumer, Primo Brands, Privia Health, Restaurant Brands International, Sapiens, ScanSource, Sempra Energy, SharkNinja, Six Flags Entertainment, Somnigroup International, Spectrum Brands, Stagwell, Stevanato Group, Stratasys, Tapestry, Tecnoglass, TEGNA, US Foods, Valvoline, Vericel, Viatris, Vital Farms, Warby Parker, Warner Bros. Discovery, Warner Music Group, Wolverine & YETI Holdings, with Coinbase Global, 1-800-FLOWERS, 10x Genomics, Adtalem Global Education, Affirm, Akamai Technologies, Alarm.com, Alliant Energy, American Healthcare REIT, AMN Healthcare, Applied Optoelectronics, Arlo Technologies, Assured Guaranty, Astrana Health, AvePoint, Barings, Bill.com, CarGurus, Clean Energy Fuels, Cloudflare, Collegium Pharmaceutical, Crinetics Pharmaceuticals, Definitive Healthcare, Diodes, DoubleVerify, DraftKings, Dropbox, EverCommerce, Evolent Health, Expedia Group, Federal Realty Investment Trust, FIGS, Fox Factory Holding, Franco-Nevada, Funko, Globus Medical, Green Dot, Hub Group, HubSpot, ICU Medical, Illumina, Innodata, Innospec, Insulet, JFrog, Lions Gate Entertainment, LPL Financial, Lyft, MARA Holdings, McKesson, Metallus, Microchip, Mitek Systems, MP Materials, News, nLIGHT, Olo, OneStream, Onto Innovation, OUTFRONT Media, Pacira BioSciences, Paramount Global, Pinterest, Post, Progyny, PubMatic, Rackspace Technology, RingCentral, Rocket Companies, Rocket Lab USA, Sensata Technologies, Solventum, SoundHound AI, Sprout Social, Sweetgreen, Synaptics, Texas Roadhouse, The Trade Desk, TKO Group Holdings, Toast, TransMedics Group, Treace Medical Concepts, Trex, Varex Imaging, Victory Capital, Westrock Coffee Company, Wolfspeed, Xponential Fitness, YELP, Ziff Davis, ZipRecruiter & Zymeworks all reporting after the session’s closing bell.
Friday the week winds down with Fed Governor Barr speaking at 6:45 am, Fed Governor Kugler speaking at 8:30 am, Fed Governor Waller & Fed President Williams on a panel at 11:30 am, Fed Governor Cook speaking at 6:45 pm & Fed Governor Bowman, Fed President Musalem & Fed President Hammack speaking on a panel at 7:45 pm.
Algonquin Power & Utilities, Alpha Metallurgical Resources, AMC Networks, ANI Pharmaceuticals, Calumet Specialty Products, Construction Partners, Embecta, Enbridge, Essent Group, Gogo, Hawaiian Electric, Koppers Holdings, Kymera Therapeutics, PAR Technology, Pembina Pipeline, Plains All American, Starwood Property Trust, Sun Life, Sylvamo, TeraWulf & TXNM Energy all report earnings before Friday morning’s opening bell.
See you back here next week!
*** I DO NOT OWN SHARES OR OPTIONS CONTRACT POSITIONS IN SPY, QQQ, IWM OR DIA AT THE TIME OF PUBLISHING THIS ARTICLE ***
The VIX closed at 22.68, indicating an implied one day move of +/-1.43% & an implied one month move of +/-6.56% for the S&P 500.
Highest Technical Rated S&P 500 Components Per 5/2/2025’s Close:
1 – PLTR
2 – HWM
3 – GEV
4 – NFLX
5 – VRSN
6 – CRWD
7 – NRG
8 – CAH
9 – APH
10 – DASH
Lowest Technical Rated S&P 500 Components Per 5/2/2025’s Close:
1 – ENPH
2 – MRNA
3 – BDX
4 – CRL
5 – TER
6 – UNH
7 – ARE
8 – SWK
9 – LYB
10 – DOW
Highest Volume Rated S&P 500 Components Per 5/2/2025’s Close:
1 – TTWO
2 – BDX
3 – KDP
4 – MSI
5 – HOLX
6 – DXCM
7 – SYK
8 – MHK
9 – GDDY
10 – ABNB
Lowest Volume Rated S&P 500 Components Per 5/2/2025’s Close:
1 – NWS
2 – DTE
3 – HCA
4 – AEP
5 – RJF
6 – STZ
7 – PGR
8 – FITB
9 – ACN
10 – WBA
Highest Technical Rated ETFs Per 5/2/2025’s Close:
1 – PTIR
2 – PLTU
3 – SHLD
4 – MSTU
5 – MSTX
6 – SCO
7 – UGL
8 – BABX
9 – FGM
10 – BTCL
Lowest Technical Rated ETFs Per 5/2/2025’s Close:
1 – TSLZ
2 – TSLQ
3 – HZEN
4 – TSDD
5 – ETHU
6 – ETHT
7 – BTCZ
8 – SBIT
9 – MRNY
10 – KOLD
Highest Volume Rated ETFs Per 5/2/2025’s Close:
1 – BSR
2 – MGRO
3 – BTR
4 – NVOX
5 – IMAR
6 – IJAN
7 – BOXA
8 – CAAA
9 – SAGP
10 – PEMX
Lowest Volume Rated ETFs Per 5/2/2025’s Close:
1 – CCNR
2 – BBEM
3 – TYLD
4 – AFIX
5 – XFIV
6 – AUGW
7 – VSHY
8 – SPC
9 – KLMN
10 – XBJL
Highest Technical Rated General Stocks Per 5/2/2025’s Close:
1 – CRTG
2 – JNVR
3 – AIJTY
4 – RGLS
5 – RGC
6 – EMWPF
7 – ABVE
8 – AREN
9 – VAXX
10 – TOI
Lowest Technical Rated General Stocks Per 5/2/2025’s Close:
1 – NIVF
2 – MULN
3 – PTPI
4 – IXHL
5 – STSS
6 – SUNE
7 – JBIO
8 – EJH
9 – FMTO
10 – YHC
Highest Volume Rated General Stocks Per 5/2/2025’s Close:
1 – DEA
2 – PLRZ
3 – FRGT
4 – AIFU
5 – NTRP
6 – IBO
7 – MAMA
8 – PAPL
9 – NITO
10 – ADIL
Lowest Volume Rated General Stocks Per 5/2/2025’s Close:
1 – CTXXF
2 – ARREF
3 – RSASF
4 – CRECF
5 – SHFS
6 – VSME
7 – LIFFF
8 – WHLM
9 – OST
10 – SMAGF
*** THE LIST ABOVE IS STRICTLY FOR INFORMATIONAL PURPOSES – I MAY OR MAY NOT HAVE OR INITIATE A LONG, SHORT, OR LONG/SHORT POSITION IN ANY NAME ABOVE AT ANY TIME ***
The VIX closed at 24.6, indicating an implied one day move of +/-1.55% & an implied one month move of +/-7.11% for the S&P 500.
Highest Technical Rated S&P 500 Components Per 5/1/2025’s Close:
1 – PLTR
2 – NFLX
3 – VRSN
4 – HWM
5 – GEV
6 – CRWD
7 – TTWO
8 – NRG
9 – PM
10 – AXON
Lowest Technical Rated S&P 500 Components Per 5/1/2025’s Close:
1 – ENPH
2 – MRNA
3 – CRL
4 – SWK
5 – TER
6 – BDX
7 – ARE
8 – UNH
9 – HAL
10 – BLDR
Highest Volume Rated S&P 500 Components Per 5/1/2025’s Close:
1 – BDX
2 – FTV
3 – LLY
4 – APD
5 – QCOM
6 – VTR
7 – MSFT
8 – CHD
9 – HUBB
10 – PWR
Lowest Volume Rated S&P 500 Components Per 5/1/2025’s Close:
1 – DLTR
2 – BLK
3 – RF
4 – GPC
5 – WBA
6 – NKE
7 – MMM
8 – ADM
9 – FITB
10 – NVR
Highest Technical Rated ETFs Per 5/1/2025’s Close:
1 – PTIR
2 – PLTU
3 – TESL
4 – SHLD
5 – SCO
6 – UGL
7 – DEFI
8 – GDMN
9 – BTCL
10 – MSTU
Lowest Technical Rated ETFs Per 5/1/2025’s Close:
1 – TSLZ
2 – TSLQ
3 – TSDD
4 – HZEN
5 – ETHU
6 – BTCZ
7 – ETHT
8 – SBIT
9 – SOXL
10 – MRNY
Highest Volume Rated ETFs Per 5/1/2025’s Close:
1 – MEMX
2 – AUGZ
3 – FLJJ
4 – SEPP
5 – QBER
6 – PBMY
7 – DEEF
8 – PEMX
9 – CAAA
10 – OGSP
Lowest Volume Rated ETFs Per 5/1/2025’s Close:
1 – SPEU
2 – SBND
3 – FDVL
4 – TRPA
5 – RFLR
6 – XBJA
7 – NUGO
8 – USCL
9 – CVSE
10 – PBDE
Highest Technical Rated General Stocks Per 5/1/2025’s Close:
1 – JNVR
2 – RGC
3 – RGLS
4 – AIJTY
5 – ABVE
6 – AREN
7 – TOI
8 – NEWH
9 – SALM
10 – UPXI
Lowest Technical Rated General Stocks Per 5/1/2025’s Close:
1 – MULN
2 – PTPI
3 – JBIO
4 – IXHL
5 – FMTO
6 – SUNE
7 – STSS
8 – YHC
9 – LICYF
10 – ACON
Highest Volume Rated General Stocks Per 5/1/2025’s Close:
1 – CMCT
2 – TWO
3 – ZCAR
4 – HCTI
5 – KRON
6 – PAPL
7 – ADIL
8 – ATNF
9 – HOOK
10 – STKH
Lowest Volume Rated General Stocks Per 5/1/2025’s Close:
1 – HWNI
2 – ELRRF
3 – CIAFF
4 – CPFXF
5 – ZOOZ
6 – TRCK
7 – SNTG
8 – HGTXU
9 – SYRA
10 – AAUAF
*** THE LIST ABOVE IS STRICTLY FOR INFORMATIONAL PURPOSES – I MAY OR MAY NOT HAVE OR INITIATE A LONG, SHORT, OR LONG/SHORT POSITION IN ANY NAME ABOVE AT ANY TIME ***
XLV, The Health Care Select Sector SPDR Fund ETF has remained near-perfectly flat Y-o-Y, dipping only -0.04%, while having fallen -12.06% since their 52-week high in September of 2024, while sitting +8.27% above their 52-week low set in April of 2025 (all figures ex-distributions).
Some of their largest holdings include Eli Lilly & Co. (LLY), UnitedHealth Group Inc. (UNH), Johnson & Johnson (JNJ), AbbVie Inc. (ABBV), Abbott Laboratories (ABT), Merck & Co. Inc. (MRK), Intuitive Surgical Inc. (ISRG), Thermo Fisher Scientific (TMO), Amgen Inc. (AMGN) & Boston Scientific Corp. (BSX).
Given how close their 52-week low was & how sharp the V-shape of their rally since has gone, it is a good time to check in on the volume sentiments at of the prices they’ve traded at in recent history.
Below is a brief technical analysis of XLV, as well as a price level:volume sentiment analysis of each of the price levels XLV has traded at over the past ~3 years.
Included in this data is also their recent support & resistance levels so that readers can gain insight into how strong/weak these support/resistance levels may be in the future, based on past market participant behavior.
It is not intended to serve as financial advice, but rather as an additional tool to reference while performing your own due diligence on XLV.
Technical Analysis Of XLV, The Health Care Select Sector SPDR Fund ETF
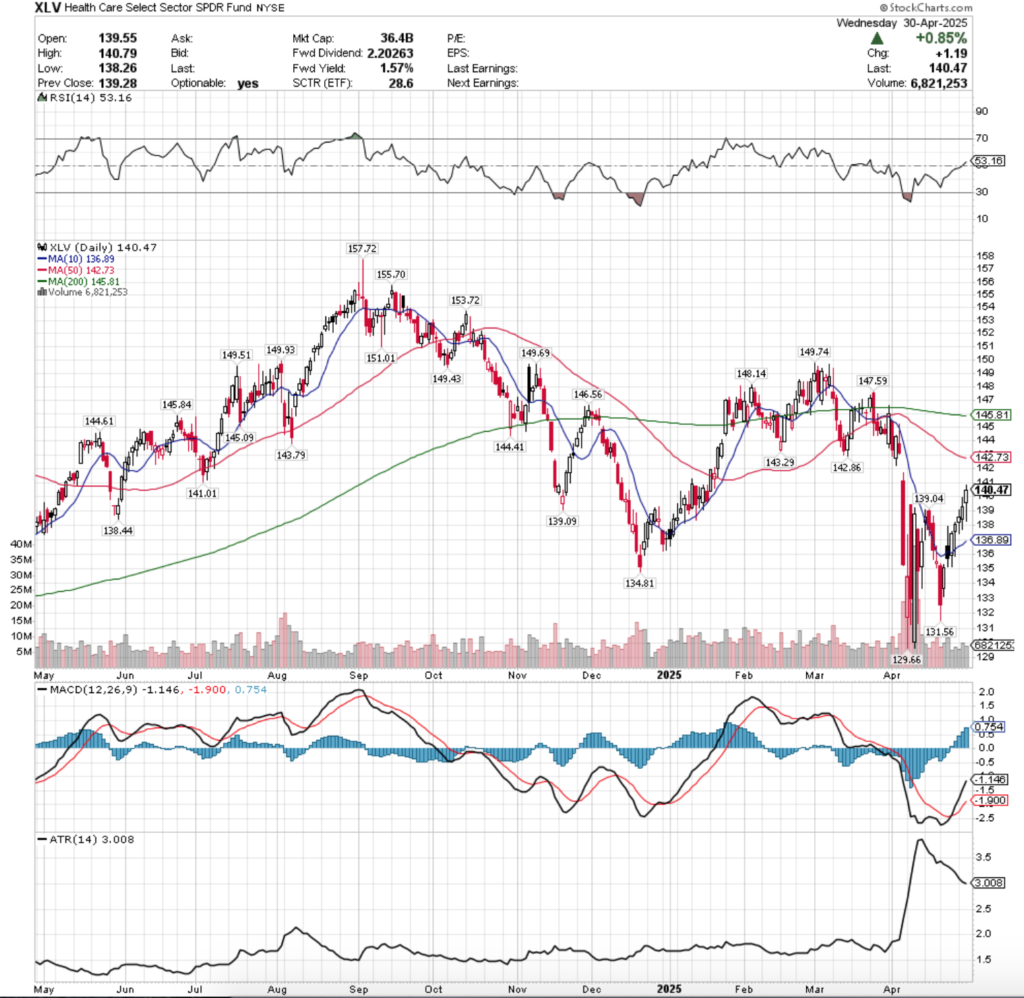
XLV ETF – Health Care Select Sector SPDR Fund ETF’s Technical Performance Over The Past Year
Their RSI has just bullishly advanced over the neutral 50-mark & currently sites at 53.16, while their MACD is still bullish after crossing over the signal line last week.
Volumes have been -9.64% vs. the prior year’s average over the past week & a half (7,012,500 vs. 7,760,714.29), which casts a light of skepticism on their recent bull run though, especially after all of the declining volume of early April, as it signals that there is still a great deal of uncertainty out there.
Last Monday opened on a gap down session with low volume that dipped as low as $131.56/share before closing at $132.57/share.
Tuesday opened midway between the range of XLV’s Monday candle’s real-body, tested lower briefly, before powering higher & closing just below Monday’s opening price to form a bullish harami pattern, which spurred the rally that we’ve witnessed since.
Wednesday opened on a gap higher above the 10 day moving average’s resistance, indicating that there is a short-term change in sentiment for XLV, but there were signs that this is not necessarily going to be long-lived.
While Wednesday was able to rally as high as $137.93/share, it was also pushed below the session to as low as $135.13/share to close below the 10 day moving average’s resistance at $135.73/share, as the highest volume of the past week & a half was attributed to intraday profit taking.
Thursday opened slightly higher, but below the 10 DMA, tested lower & found footing near Wednesday’s lows & managed to break above & close higher than the 10 DMA.
Friday opened on a gap up, retraced almost entirely all the way down Thursday’s candle’s real body, before breaking out higher to close above the $138/share mark.
The theme of these deep day-over-day retests (which have continued each day since), which also adds to the skepticism behind the strength of the rally, as it shows that there has still been a strong sense to stay close to the 10 day moving average & that there may be a bit of day-over-day profit taking happening.
This week kicked off on a gap up open for XLV, briefly breaking $139/share intra-day, to the upside, but also briefly breaking down below the $138/share level & the session resulted in ambiguity as the day’s candle closed as a spinning top.
This uncertainty will lead to an interesting next couple of days, particularly as we watch to see if there is any form of bearishness heading into the weekend/on the open of next week.
Tuesday also showed a wide range of indecision with the high waves on the day’s candle, which based on the small uptick in volume was also likely the result of a bit of intraday profit taking as the price moved further from the short-term trend line.
Wednesday opened on a gap up, but began showing cracks in the enthusiasm, as prices retraced down beyond the $139/share level & temporarily to below Tuesday’s opening price, before managing to find footing & rally higher into the close.
This indicates that there is likely to be more downside pressure on the horizon & that there is a growing appetite for profit taking in the wake of the recent run up.
The narrow tweezer v-shaped recovery also looks like it will be unsustainable in the long-run & that there will be some form of declines on the horizon.
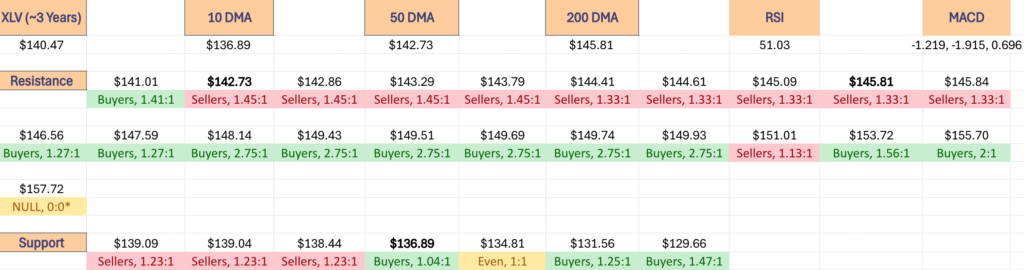
To the upside the first price level to be watching is $141.71, which is the high from April 4, 2025, as a retest of that that is unsuccessful is likely to indicate that there’s a consolidation coming.
Should it be broken through, there is a resistance zone between $142.73 (50 Day Moving Average) & $145.81/share (200 Day Moving Average) where there are eight total resistance touch-points (9 if you count the resistance level $0.04 above the 200 DMA) before the levels become less condensed.
What’s particularly troubling here is that each of those levels resides in a Seller dominated price level per the past ~3 years.
This makes it seem that we won’t be seeing any breakout above the long-term trend line’s (200 DMA) resistance for quite some time, unless it involves a high volume gap above it (and even then, it’s unlikely to sustain for long).
What’s more likely is that we see continued consolidation that oscillates around the 10 day moving average, as there is quite a bit of uncertainty still remaining in the market.
This is also in part because the price zones between the current price & the 10 DMA’s support are historically Seller dominated, but the 10 DMA resides in a Buyer oriented zone historically.
Another interesting point to watch there ties into the bear case, as while there are seven support levels between Wednesday’s closing price & the bottom of XLV’s one year chart, the lowest is at $129.66, which is the bottom point of the consolidation range mentioned above.
This likely will be why unless there is a major earnings disappointment, the XLV’s price will be following the 10 DMA & swimming around it like the remoras that swim around sharks & whales until we get an upside or downside catalyst.
One thing is for certain though, no heightened volume, no serious breakout in either direction, particularly after the subdued volume levels of the past year vs. the years prior.
With that said, it’s worth reviewing the tables in the section below, as well as the past 1,2 & 3 year charts (and other longer-dated ones based on your time horizons, but given this is ~3 years of data that’s a good idea to review) & assess where XLV might find its support & resistance, and reference the data below.
The section below outlines the volume sentiment at each price level XLV has traded at over the past ~3 years & can be used to assess the strength/weakness of the support/resistance levels & price levels that XLV retests in the coming weeks.
This can aid in understanding how market participants may behave again at each level.
Price Level:Volume Sentiment Analysis For XLV, The Health Care Select Sector SPDR Fund ETF
The top table below shows the support & resistance levels of XLV from the past year’s chart, as well as their price level:volume sentiment at each from data covering the past ~3 years, using Wednesday 4/30/2025’s closing data for their price & moving averages/other technicals.
The 10, 50 & 200 day moving averages are denoted with bold.
The next tables show the volume sentiment at each individual price level XLV has traded at over the past ~3 years.
Beneath them is a copy & pasteable list of the same data, where the support/resistance levels are denoted in bold.
All ratios with “0” in the denominator are denoted with a “*”.
NULL values are price levels that had limited trading volume, whether it be due to gaps, quick advances or they are at price extremes; in the event that they are retested & there is more data they would have a distinct “Buyers”, “Sellers” or “Even” title.
This is not intended as financial advice, but rather another tool to consider when performing your own research & due diligence on XLV.
The following section lays out XLV’s one year support/resistance levels, as well as their Buyer:Seller (Seller:Buyer) ratios at each price level that they’ve traded at over the past ~3 years, which can be used as a barometer for estimating the expected strength/weakness of each of the support/resistance levels.
XLV ETF’s Price Level:Volume Sentiment Over The Past ~3 Years At Their Past Year’s Support/Resistance Levels
XLV ETF’s Price Level:Volume Sentiment Over The Past ~3 YearsAt Their Past Year’s Support/Resistance Levels
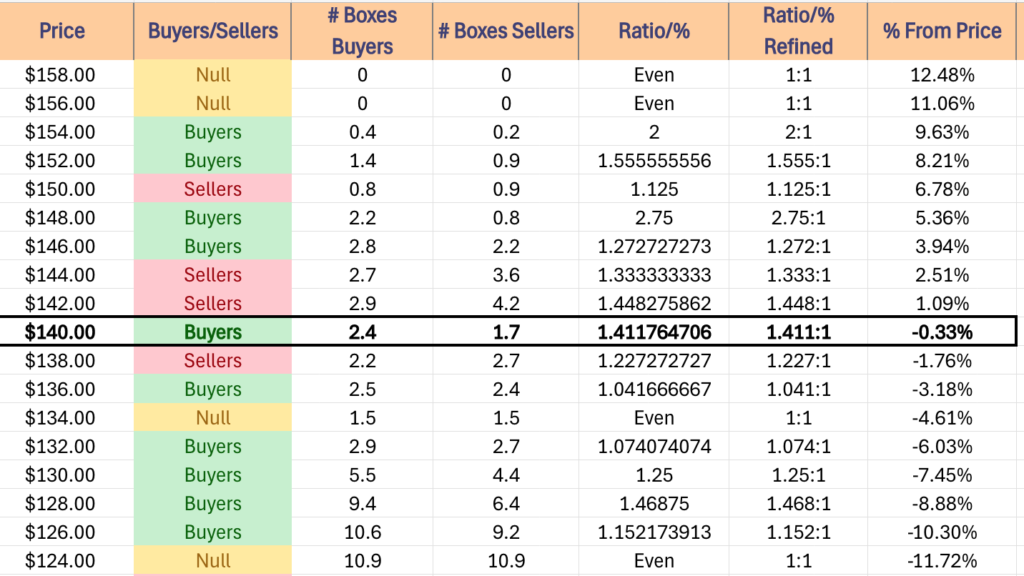
Price Level:Volume Sentiment For XLV ETF Over The Past ~3 Years
Price Level:Volume Sentiment For XLV ETF Over The Past ~3 Years
$158 – NULL – 0:0*, +12.48% From Current Price Level
$156 – NULL – 0:0*, +11.06% From Current Price Level
$154 – Buyers – 2:1, +9.63% From Current Price Level
$152 – Buyers – 1.56:1, +8.21% From Current Price Level
$150 – Sellers – 1.13:1, +6.78% From Current Price Level
$148 – Buyers – 2.75:1, +5.36% From Current Price Level
$146 – Buyers – 1.27:1, +3.94% From Current Price Level
$144 – Sellers – 1.33:1, +2.51% From Current Price Level – 200 Day Moving Average*
$142 – Sellers – 1.45:1, +1.09% From Current Price Level – 50 Day Moving Average*
$140 – Buyers – 1.41:1, -0.33% From Current Price Level – Current Price Level*
$138 – Sellers – 1.23:1, -1.76% From Current Price Level
$136 – Buyers – 1.04:1, -3.18% From Current Price Level – 10 Day Moving Average*
$134 – Even – 1:1, -4.61% From Current Price Level
$132 – Buyers – 1.07:1, -6.03% From Current Price Level
$130 – Buyers – 1.25:1, -7.45% From Current Price Level
$128 – Buyers – 1.47:1, -8.88% From Current Price Level
$126 – Buyers – 1.15:1, -10.3% From Current Price Level
$124 – Even – 1:1, -11.72% From Current Price Level
$122 – Sellers – 1.2:1, -13.15% From Current Price Level
$120 – Sellers – 1.13:1, -14.57% From Current Price Level
$118 – Sellers – 1.39:1, -16% From Current Price Level
$116 – Sellers – 1.24:1, -17.42% From Current Price Level
$114 – Buyers – 1.07:1, -18.84% From Current Price Level
$112 – Sellers – 3:1, -20.27% From Current Price Level
$110 – Buyers – 2.75:1, -21.69% From Current Price Level
$108 – Buyers – 2.89:1, -23.12% From Current Price Level
$106 – Sellers – 1.05:1, -24.54% From Current Price Level
$104 – Sellers – 1.31:1, -25.96% From Current Price Level
$102 – Buyers – 1.5:1, -27.39% From Current Price Level
$100 – Buyers – 1.4:1, -28.81% From Current Price Level
$99 – Even – 1:1, -29.52% From Current Price Level
$98 – Sellers – 1.82:1, -30.23% From Current Price Level
$97 – Sellers – 1.33:1, -30.95% From Current Price Level
$96 – Buyers – 1.17:1, -31.66% From Current Price Level
$95 – Buyers – 2.5:1, -32.37% From Current Price Level
$94 – Sellers – 1.2:1, -33.08% From Current Price Level
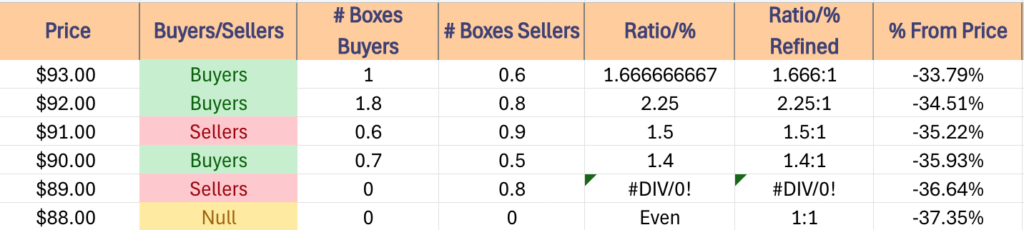
$93 – Buyers – 1.67:1, -33.79% From Current Price Level
$92 – Buyers – 2.25:1, -34.51% From Current Price Level
$91 – Sellers – 1.5:1, -35.22% From Current Price Level
$90 – Buyers – 1.4:1, -35.93% From Current Price Level
$89 – Sellers – 0.8:0*, -36.64% From Current Price Level
$88 – NULL – 0:0*, -37.35% From Current Price Level
*** I DO NOT OWN SHARES OR OPTIONS CONTRACT POSITIONS IN XLV AT THE TIME OF PUBLISHING THIS ARTICLE ***
The VIX closed at 24.7, indicating an implied one day move of +/-1.56% & an implied one month move of +/-7.14% for the S&P 500.
Highest Technical Rated S&P 500 Components Per 4/30/2025’s Close:
1 – PLTR
2 – VRSN
3 – NFLX
4 – CRWD
5 – TTWO
6 – GEV
7 – PM
8 – HWM
9 – AXON
10 – CNP
Lowest Technical Rated S&P 500 Components Per 4/30/2025’s Close:
1 – ENPH
2 – MRNA
3 – TER
4 – APA
5 – ARE
6 – CRL
7 – SWK
8 – HAL
9 – ALB
10 – NCLH
Highest Volume Rated S&P 500 Components Per 4/30/2025’s Close:
1 – AMCR
2 – FSLR
3 – SBUX
4 – CSGP
5 – ITW
6 – STX
7 – EIX
8 – GRMN
9 – SWK
10 – GEHC
Lowest Volume Rated S&P 500 Components Per 4/30/2025’s Close:
1 – WBA
2 – AKAM
3 – LEN
4 – STZ
5 – CEG
6 – LW
7 – TKO
8 – WDAY
9 – IPG
10 – KEY
Highest Technical Rated ETFs Per 4/30/2025’s Close:
1 – JNUG
2 – NUGT
3 – GDMN
4 – UGL
5 – PTIR
6 – PLTU
7 – SCO
8 – SHLD
9 – SGDM
10 – AUMI
Lowest Technical Rated ETFs Per 4/30/2025’s Close:
1 – TSLZ
2 – TSLQ
3 – TSDD
4 – ETHU
5 – ETHT
6 – HZEN
7 – BTCZ
8 – SOXL
9 – SBIT
10 – SVIX
Highest Volume Rated ETFs Per 4/30/2025’s Close:
1 – SSPY
2 – JIVE
3 – XVV
4 – MIDE
5 – PMAY
6 – CEW
7 – EFIV
8 – HDUS
9 – HTUS
10 – IMAY
Lowest Volume Rated ETFs Per 4/30/2025’s Close:
1 – CNEQ
2 – FDVL
3 – XMAY
4 – XBJA
5 – MINV
6 – GVUS
7 – FDTB
8 – TPLE
9 – PSMR
10 – IMAR
Highest Technical Rated General Stocks Per 4/30/2025’s Close:
1 – JNVR
2 – RGLS
3 – RGC
4 – AREN
5 – ABVE
6 – NEWH
7 – TOI
8 – ONXGF
9 – TMPOQ
10 – SALM
Lowest Technical Rated General Stocks Per 4/30/2025’s Close:
1 – MULN
2 – FMTO
3 – SUNE
4 – IXHL
5 – YHC
6 – STSS
7 – ACON
8 – HEPA
9 – XHG
10 – WLGS
Highest Volume Rated General Stocks Per 4/30/2025’s Close:
1 – JFBR
2 – OUT
3 – FRGT
4 – MAMA
5 – PPBT
6 – GRAF
7 – STSS
8 – JTAI
9 – CNF
10 – UNIT
Lowest Volume Rated General Stocks Per 4/30/2025’s Close:
1 – ALPIB
2 – CTXXF
3 – CVVUF
4 – NMHI
5 – SVBL
6 – SYRA
7 – PMCOF
8 – CIAFF
9 – HPQFF
10 – CRCUF
*** THE LIST ABOVE IS STRICTLY FOR INFORMATIONAL PURPOSES – I MAY OR MAY NOT HAVE OR INITIATE A LONG, SHORT, OR LONG/SHORT POSITION IN ANY NAME ABOVE AT ANY TIME ***