DTCR, the Global X Data Center & Digital Infrastructure ETF has had a good past year, gaining +15.15% (ex-distributions), including a 31.4% advance from their 52-week low in October of 2023 while only being -5.38% below their 52-week high set in March of 2024 (using Thursday’s closing price).
It’s no secret that the biggest talked about names in the market over the past year have been in the AI/Data Center & Digital Infrastructure space, a trend which looks to continue into the future as technologies continue to evolve.
Some of the fund’s largest holdings include American Tower Corp (AMT), Equinix Inc. (EQIX), Digital Realty Trust Inc. (DLR), Crown Castle Inc. (CCI), SBA Communications Corp. (SBAC), Keppel DC REIT (KDCREIT SP), GDS Holdings LTD – ADR (GDS), China Tower Corp LTD-H (788 HK), NextDC LTD (NXT AU) & Sarana Menara (TOWR IJ).
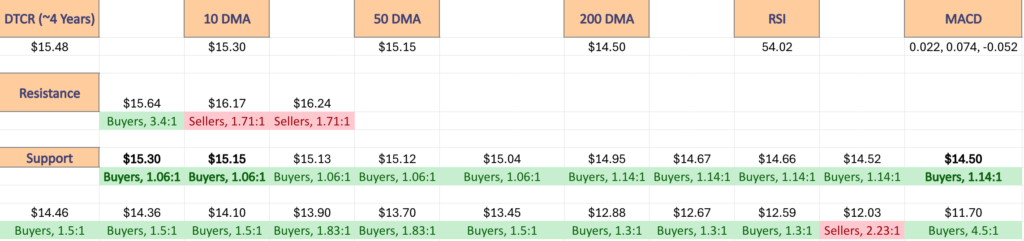
Given their recent performance & the volatile period markets have recently entered it is a good time to take a look at the volume sentiment around DTCR’s support & resistance levels.
Below is a brief technical analysis of DTCR’s recent performance, as well as a breakdown of DTCR’s volume sentiment at the price levels it has traded at over the past ~4 years.
It is not intended to serve as financial advice, but rather as an additional tool to reference while performing your own due diligence into DTCR or any of its components.
Technical Analysis Of DTCR, The Global X Data Center & Digital Infrastructure ETF
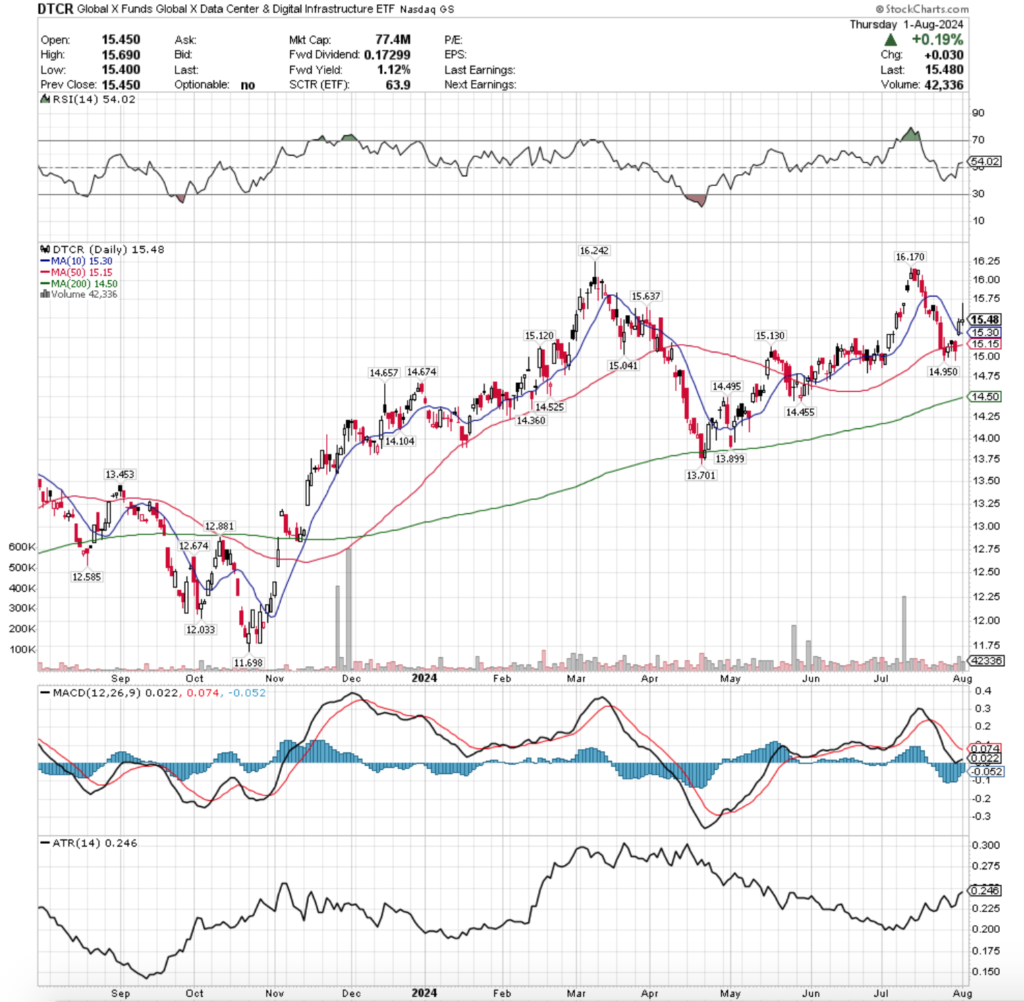
Their RSI is currently near the neutral level & sits at 54.02, while their MACD is bearish but moving towards the signal line, although today’s performance will likely drag it down more bearishly.
Volumes were +24.24% above their prior year’s average over the past week (39,080 vs. 31,415.48), mostly due to the gap up session of Wednesday & Thursday’s subsequent performance.
While this may typically be viewed as a sign of strength, the broader market sell off that we are experiencing is unlikely to spare DTCR & so it is not a bullish indication, especially given the status of their other indicators & oscillators.
Last Friday’s session was able to stop the bleeding of the previous two weeks with a close at about the 50 day moving average & leading to another bullish session at the beginning of this week.
Monday was not entirely a sign of strength though, as prices opened on a gap up, but tested down below the 50 DMA only to recover back above it, but still close below the opening price level.
If there had been an established uptrend prior to Monday the candle would be viewed as a hanging man (bearish).
This sour sentiment continued into Tuesday, when prices again tested below the 50 day moving average & were unable to recover to close above it, signaling that there was likely still trouble on the horizon & putting a damper on the prior two advancing sessions.
Wednesday had the highest volume of the week, likely either due to the high volumes of the advancing major indexes or perhaps a squeeze, resulting in a gap up session that marched higher throughout the day & was able to close above the support of the 10 day moving average.
Thursday signaled that the party is over & that the declines are ready to continue, with a shooting star candle on the session.
While there was also high volume on Thursday, the price covered such a wide range for the day that it included profit taking & should not have been viewed as purely bullish activity, particularly when you examine the height of the day’s upper shadow.
Intraday today DTCR’s gap from Wednesday has begun to fill in & the day’s candle as of 11:45 am has continued bearish implications as we look set into a “risk-off” into the weekend play across markets.
With that said, all eyes should be on whether DTCR forms a consolidation range in the area between the 10 & 50 DMAs, or if it declines further than that & makes a move at the $15.12-15.15 support zone.
Should that be broken, there will be downward pressure from the 10 & 50 DMAs & the $15.04 support level will become critical, as beyond that & the $14.95 point there is a lot of room to decline before any type of stable footing is found.
As their Average True Range perks up again, this should be something to be conscientious of & makes it imperative to understand how buyers & sellers have historically behaved at these support levels.
The data below can be used to help assess the strength of support & resistance levels for DTCR in the future, along with whatever other indicators, oscillators & market data that you prefer to use in your due diligence.
Price Level:Volume Sentiment Analysis Of DTCR, The Global X Data Center & Digital Infrastructure ETF
The top table below shows the support & resistance levels of DTCR ETF from the past year’s chart, as well as their price level:volume sentiment at each, using Thursday’s closing price.
The moving averages are denoted with bold.
The next charts show the volume sentiment at each individual price level DTCR has traded at over the past ~4 years.
Beneath them is a copy & pasteable list of the same data, where the support/resistance levels are denoted in bold.
All ratios with “0” in the denominator are denoted with a “*”.
NULL values are price levels that had limited trading volume, whether it be due to gaps, quick advances or they are at price extremes; in the event that they are retested & there is more data they would have a distinct “Buyers”, “Sellers” or “Even” title.
This is not intended as financial advice, but rather another tool to consider when performing your own research & due diligence on DTCR ETF or any of its components.
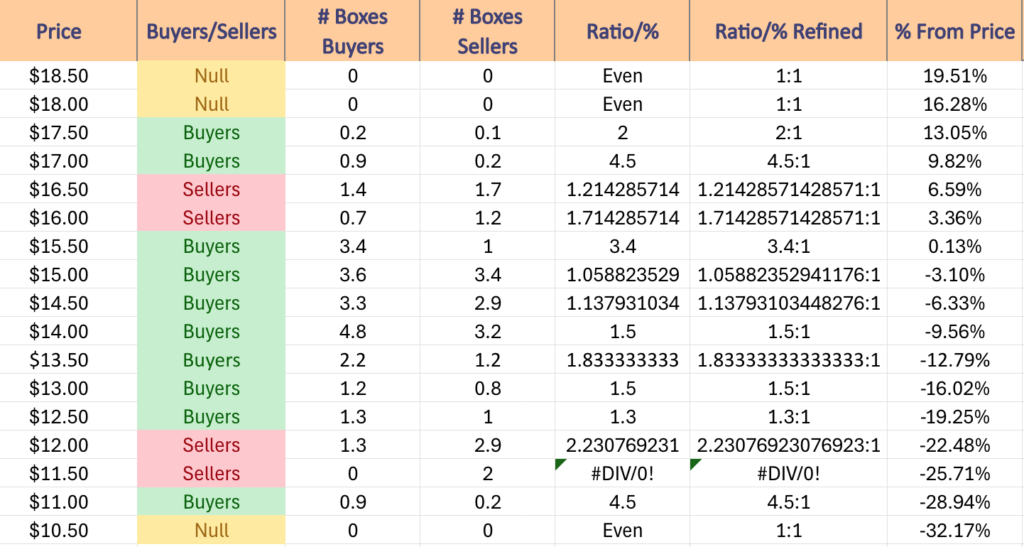
$18.50 – NULL – 0:0*, +19.51% From Current Price Level
$18 – NULL – 0:0*, +16.28% From Current Price Level
$17.50 – Buyers – 2:1, +13.05% From Current Price Level
$17 – Buyers – 4.5:1. +9.82% From Current Price Level
$16.50 – Sellers – 1.21:1, +6.59% From Current Price Level
$16 – Sellers – 1.71:1, +3.36% From Current Price Level
$15.50 – Buyers – 3.4:1. +0.13% From Current Price Level
$15 – Buyers – 1.06:1, -3.1% From Current Price Level – 10 & 50 day Moving Averages, Current Price Level***
$14.50 – Buyers – 1.14:1, -6.33% From Current Price Level – 200 Day Moving Average*
$14 – Buyers – 1.5:1, -9.56% From Current Price Level
$13.50 – Buyers – 1.83:1, -12.79% From Current Price Level
$13 – Buyers – 1.5:1, -16.02% From Current Price Level
$12.50 – Buyers – 1.3:1, -19.25% From Current Price Level
$12 – Sellers – 2.23:1, -22.48% From Current Price Level
$11.50 – Sellers – 2:0*, -25.71% From Current Price Level
$11 – Buyers – 4.5:1, -28.94% From Current Price Level
$10.50 – NULL – 0:0*, -32.17% From Current Price Level
*** I DO NOT OWN SHARES OR OPTIONS CONTRACT POSITIONS IN DTCR AT THE TIME OF PUBLISHING THIS ARTICLE ***