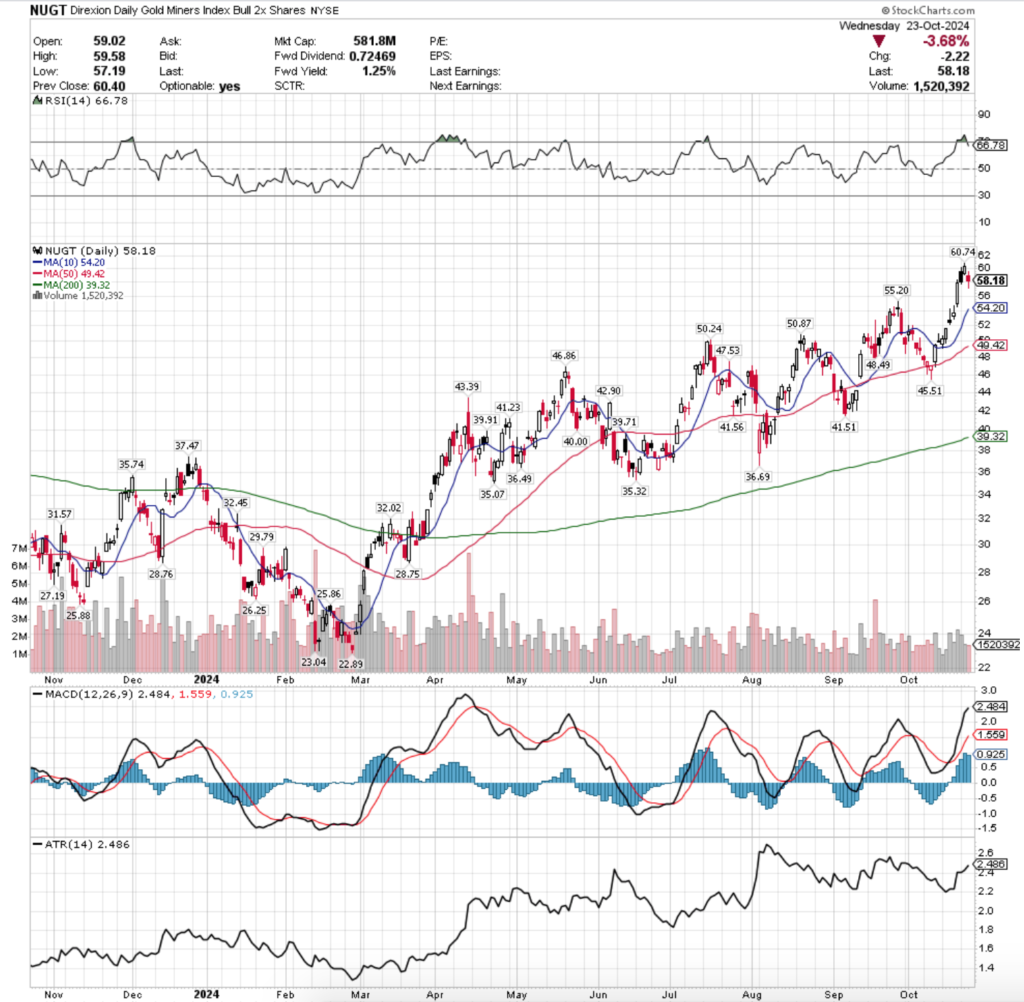
NUGT, the Direxion Daily Gold Miners Index Bull 2x Shares ETF has advanced +83.13% over the past year, adding +151.32% since their 52-week low in February of 2024, while resting -4.12% below their 52-week high set on October 22, 2024 (all figures ex-distributions).
In addition to exposure to gold miners, NUGT also offers international exposure to Canada, The U.S., Australia, South Africa, China, The U.K., Peru & Jersey.
Some of their largest holdings include Newmont Corporation (NEM), Agnico Eagle Mines Ltd. (AEM), Barrick Gold (GOLD), Wheaton Prescious Metals Corporation (WPM), Franco Nevada (FNV), Gold Fields (GFI), Zijin Mining H (ZIJMF), Northern Star Resources (NSTYY), Kinross Gold (KGC) & Anglogold (AU).
Below is a brief technical analysis of NUGT, as well as a price level:volume sentiment analysis of the price levels NUGT has traded at over the 1-2 years.
Included in this data is also their recent support & resistance levels so that readers can gain insight into how strong/weak these support/resistance levels may be in the future, based on past investor behavior.
It is not intended to serve as financial advice, but rather as an additional tool to reference while performing your own due diligence on NUGT.
Technical Analysis Of NUGT, The Direxion Daily Gold Miners Index Bull 2x Shares ETF

Their RSI has just dipped back below the overbought level of 70 & sits currently at 66.78, while their MACD is still bullish, but their histogram is beginning to signal that their uptrend may be weakening in the short-term.
Volumes were -27.38% below average over the past week & a half compared to the year prior’s average (1,710,051.25 vs. 2,354,801.93) as market participants began to get nervous near their 52-week high, which may be a sign of near-term profit taking on the horizon after the run up of the past couple of weeks.
Last week began with a retest of NUGT’s 10 day moving average’s support & the session ended in a bearish engulfing candle, giving the green light higher for investors.
It should be noted that this occurred on the lowest volume of the month though, likely as market participants were unsure if it would be able to remain above the support level or not & so they patiently awaited confirmation.
Tuesday opened higher, tested lower about midway through Monday’s trading range, before running higher & closing near the highs of the day on somewhat stronger volume than Monday, but still nothing to write home about compared to the average volume of the rest of the year.
Wednesday opened on a gap higher & tested above the $54/share mark, but closed with a hint of uncertainty & doubt as the spinning top candle’s real body was concentrated near the lower range of the day’s candlestick & it closed lower than it opened.
Volumes were much higher Wednesday, which was also a function of profit taking from the past week’s run up & the bears forcing the higher end of the day’s range to near the bottom of the candlestick to close below the open.
There was still more appetite for risk on Thursday however, as the session opened on a gap higher & while it wasn’t able to close above the $54/share mark it did test above it, but again, the session resulted in a spinning top candle as there was a great deal of uncertainty about the current NUGT valuation.
Volumes dipped day-over-day, but remained strong compared to the other days’ volumes that were noted above.
Friday the risk-on theme continued with another opening gap up that briefly tested lower before powering above the $58/share price level & closing just beneath it at $57.90/share, a day-over-day gain of +7.96% on the strongest volume seen since mid-September.
Warning signals began flashing this past Monday though, as the session opened on a gap higher to $59.50, went up to $60.19/share, before NUGT’s price collapsed to close below the open at $58.06/share.
Volume on Monday was just below that of Friday’s session, likely attributed to the day’s wide trading range & the profit taking that forced the close to be lower than the open as the gap up was unable to muster up much strength.
Tuesday opened higher & pushed up to reach the new 52-week high of $60.74 before closing at $60.40 & the low volume indicated that there was trouble on the horizon for NUGT as investors had finally seemed to have had enough risk.
This lead to yesterday’s-3.68% decline that began as a gap down that attempted to break above Tuesday’s low, but ultimately the bears took over & the price began deflating.
The size of the lower shadow indicates that there was a bit of downside appetite that market participants were interested in, but the bulls were able to force the close higher.
The lack of volume though is signaling that perhaps there is more downside appetite in the tank, particularly given how overextended the past few weeks’ run up has become.
In the coming week(s) the $55.20 support level will be an area of interest to keep an eye on, as it is the nearest support level to last night’s close.
After that investors will want to focus their attention on the support of the 10 day moving average, which will continue moving higher as days pass.
Should the 10 DMA’s support not hold up, the next support level is -6.4% away (using last night’s closing prices).
Another area to keep a keen eye on this upcoming week or two is NUGT’s volume levels, as any advances will require strong volume for confirmation at these high price levels & the strength of any declines/consolidation ranges will also be evident based on market paricipation.
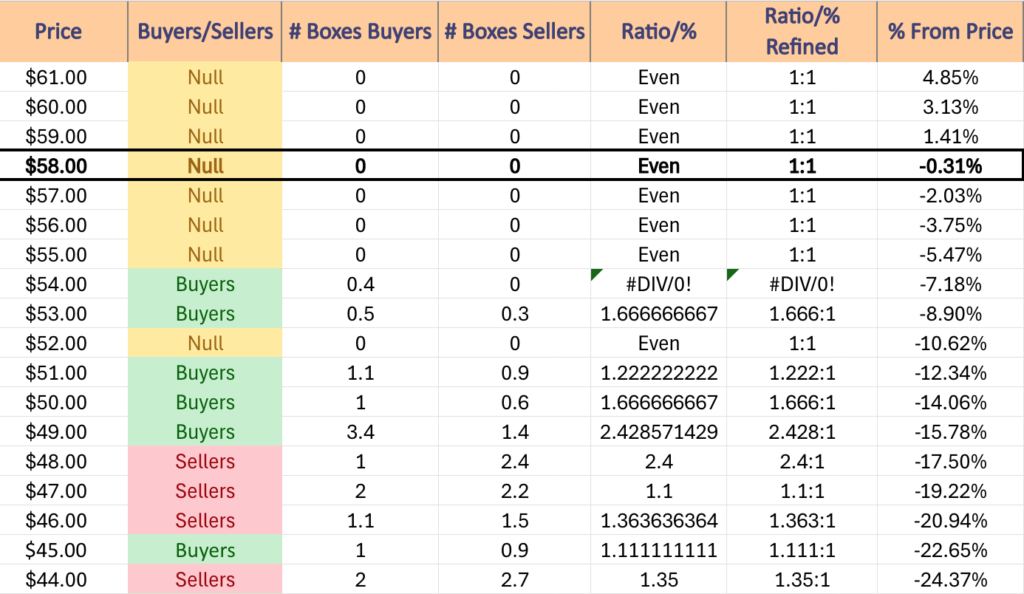
It is also important to explain that when reading tables in the next section that the data should be treated as a barometer that measures Buyer:Seller pressure (or Seller:Buyer).
Due to the jumpy nature described above of NUGT’s recent advances (and declines when you look at their chart before the run up described above) there are many “Buyer” dominated zones that have either a “0” in the denominator for Seller pressure, and other ratios that are near these price extremes.
With that said, when reading the data, the $54-$54.99-price level has a 0 in the denominator due to lack of downside testing in this range compared to advancing volume.
$53-53.99/share has 1.66:1 Buyers:Sellers, which can be seen as a more sturdy support level until the $54-$54.99 level is more thoroughly tested.
Similarly, based on historic behavior of the past 1-2 years the $49-49.99/share price level is considered more sturdy support than the others as it is currently Buyer dominated at a rate of 2.43:1.
Conversely, the $48-48.99/share Seller zone is considered weaker support than the Seller zones that follow it due to the strength of its ratio.
Again, this data is for informational purposes & can be used to aid your existing due diligence process, but it is not intended to serve as financial advice.
Price Level:Volume Sentiment Analysis For NUGT, The Direxion Daily Gold Miners Index Bull 2x Shares ETF
The top table below shows the support & resistance levels of NUGT from the past year’s chart, as well as their price level:volume sentiment at each, using Wednesday 10/23/24’s closing price.
The moving averages are denoted with bold.
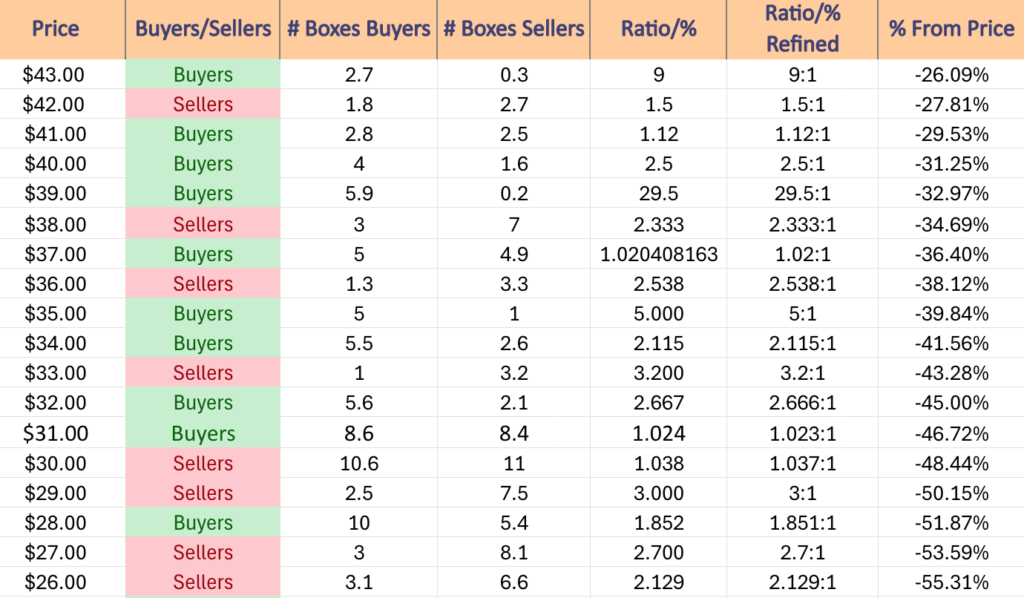
The next charts show the volume sentiment at each individual price level NUGT has traded at over the past 1-2 years.
Beneath them is a copy & pasteable list of the same data, where the support/resistance levels are denoted in bold.
All ratios with “0” in the denominator are denoted with a “*”.
NULL values are price levels that had limited trading volume, whether it be due to gaps, quick advances or they are at price extremes; in the event that they are retested & there is more data they would have a distinct “Buyers”, “Sellers” or “Even” title.
This is not intended as financial advice, but rather another tool to consider when performing your own research & due diligence on NUGT ETF.


$61 – NULL – 0:0*, +4.85% From Current Price Level
$60 – NULL – 0:0*, +3.13% From Current Price Level
$59 – NULL – 0:0*, +1.41% From Current Price Level
$58 – NULL – 0:0*, -0.31% From Current Price Level – Current Price Level*
$57 – NULL – 0:0*, -2.03% From Current Price Level
$56 – NULL – 0:0*, -3.75% From Current Price Level
$55 – NULL – 0:0*, -5.47% From Current Price Level
$54 – Buyers – 0.4:0*, -7.18% From Current Price Level – 10 Day Moving Average*
$53 – Buyers – 1.67:1, -8.9% From Current Price Level
$52 – NULL – 0:0*, -10.62% From Current Price Level
$51 – Buyers – 1.22:1, -12.34% From Current Price Level
$50 – Buyers – 1.67:1, -14.06% From Current Price Level
$49 – Buyers – 2.43:1, -15.78% From Current Price Level – 50 Day Moving Average*
$48 – Sellers – 2.4:1, -17.5% From Current Price Level
$47 – Sellers – 1.1:1, -19.22% From Current Price Level
$46 – Sellers – 1.36:1, -20.94% From Current Price Level
$45 – Buyers – 1.11:1, -22.65% From Current Price Level
$44 – Sellers – 1.35:1, -24.37% From Current Price Level
$43 – Buyers – 9:1, -26.09% From Current Price Level
$42 – Sellers – 1.5:1, -27.81% From Current Price Level
$41 – Buyers – 1.12:1, -29.53% From Current Price Level
$40 – Buyers – 2.5:1, -31.25% From Current Price Level
$39 – Buyers – 29.5:1, -32.97% From Current Price Level – 200 Day Moving Average*
$38 – Sellers – 2.33:1, -34.69% From Current Price Level
$37 – Buyers – 1.02:1, -36.4% From Current Price Level
$36 – Sellers – 2.54:1, -38.12% From Current Price Level
$35 – Buyers – 5:1, -39.84% From Current Price Level
$34 – Buyers – 2.12:1, -41.56% From Current Price Level
$33 – Sellers – 3.2:1, -43.28% From Current Price Level
$32 – Buyers – 2.67:1, -45% From Current Price Level
$31 – Buyers – 1.02:1, -46.72% From Current Price Level
$30 – Sellers – 1.04:1, -48.44% From Current Price Level
$29 – Sellers – 3:1, -50.15% From Current Price Level
$28 – Buyers – 1.85:1, -51.87% From Current Price Level
$27 – Sellers – 2.7:1, -53.59% From Current Price Level
$26 – Sellers – 2.13:1, -55.31% From Current Price Level
$25 – Buyers – 2.92:1, -57.03% From Current Price Level
$24 – Buyers – 2.18:1, -58.75% From Current Price Level
$23 – Seller s- 5.67:1, -60.47% From Current Price Level
$22 – NULL – 0:0*, -62.19% From Current Price Level
*** I DO NOT OWN SHARES OR OPTIONS CONTRACT POSITIONS IN NUGT AT THE TIME OF PUBLISHING THIS ARTICLE ***