PSIL, the AdvisorShares Psychedelics ETF has declined -9.65% over the past year, falling -24% from its 52-week high in March of 2024, while having rebounded +80.95% from its 52-week low set in October of 2024 (all figures ex-distributions).
PSIL ETF is designed to give investors exposure to the growing field of using psychedelics for mental healthcare research.
It also gives exposure to companies in the U.S., Canada, Europe, the U.K. & Australasia for investors looking to get more international exposure in their portfolios.
Some of its top holdings include Mind Medicine Inc. (MNMD), Cybin Inc. (CYBN), Incannex Healthcare Inc. (IXHL), GH Research PLC (GHRS), Alkermes PLC (ALKS), Atai Life Sciences NV (ATAI), Clearminded Medicine Inc. (CMND), Quantum Biopharma LTD. (QNTM), Sage Therapuetics (SAGE) & Relmada Therapuetics (RLMD).
Below is a brief technical analysis of PSIL, as well as a price level:volume sentiment analysis of the price levels PSIL has traded at over the past 2-3 years.
Included in this data is also their recent support & resistance levels so that readers can gain insight into how strong/weak these support/resistance levels may be in the future, based on past investor behavior.
It is not intended to serve as financial advice, but rather as an additional tool to reference while performing your own due diligence on PSIL.
Technical Analysis Of PSIL, The AdvisorShares Psychedelics ETF
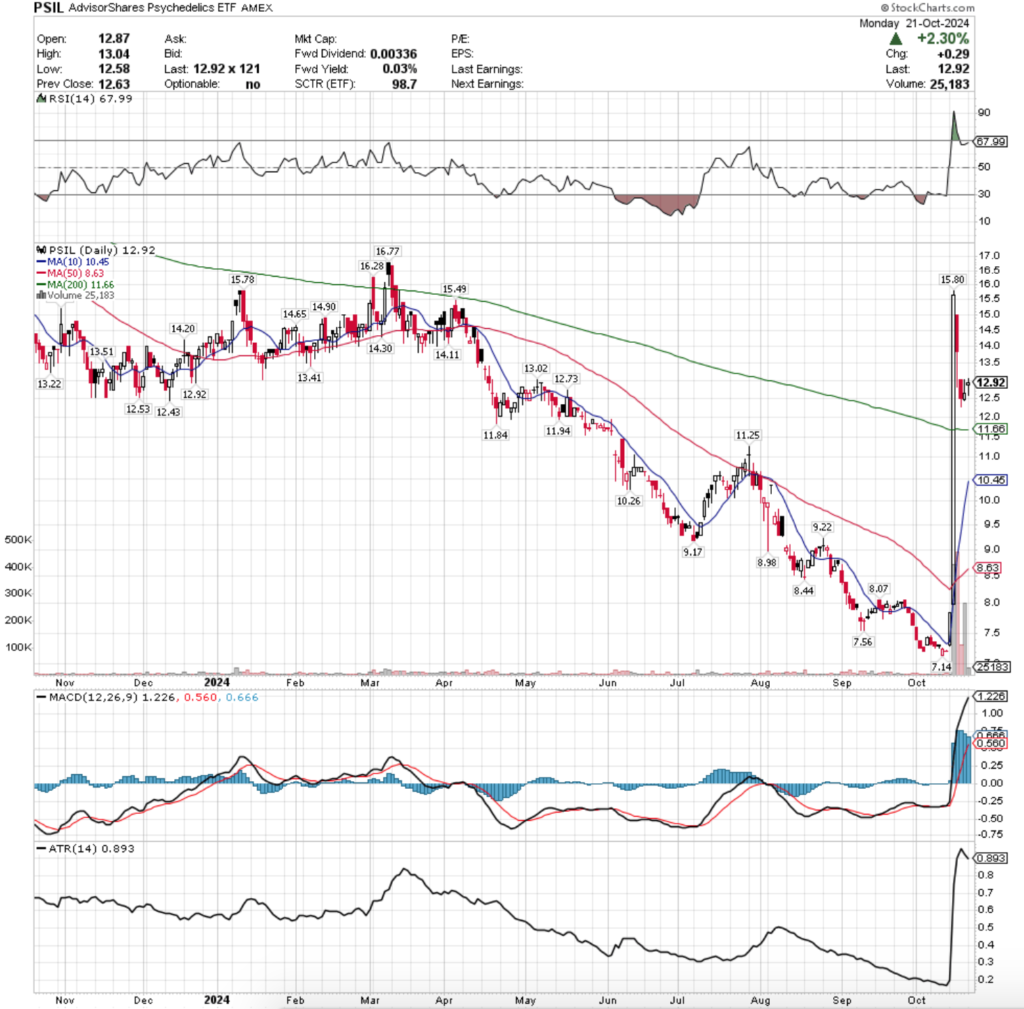
Their RSI is re-approaching the overbought level of 70 for the second time in a week & currently sits at 67.99, while their MACD is still bullish in the wake of last Tuesday’s session where shares jumped +99.49% day-over-day, but the histogram is beginning to wane.
Volumes were +1,891.94% above the prior year’s average over the past six sessions (211,996.67 vs. 10,642.72), mostly due to the major gaining session of 10/15/2024 & the subsequent profit taking/chasing that followed.
Before we get into the last week, PSIL had been in a steady decline for the past seven months, which will be important to keep in mind when we get into the next section.
Last Monday, PSIL began to show signs of life just two days after reaching a fresh 52-week & all-time low price of $7.14/share.
Despite happening on low volume, shares opened on a gap up & ran from an opening price of $7.31/share to the closing & day’s high price of $7.85 (+7.39% open to close gain for the day).
Tuesday also opened on a gap up at $7.99/share & proceeded to run higher on the second highest volume of the year to a high of $15.80 to close just lower at $15.66 for the day.
Given that this close was higher than 98% of their past year’s closing prices there was a great deal of profit taking on Wednesday, when the session opened lower at $15/share, retraced down to $12.80/share but was able to find footing & rally back to close at $13.85/share.
Wednesday naturally had the highest volume of the past year between people taking profits, people cashing out of long-held positions & other market participants trying to jump in & chase after the recent major gains in hopes that prices would continue to rally higher.
Thursday the declines continued, but the volume & day’s range were both much lower & the profit taking began to die down & a new consolidation range began to find footing near the $12.50/share mark.
Friday confirmed that investors were indeed with the $12.50 mark as the session opened slightly below it, before testing up as high as $13.01 (Thursday’s high was $13.02) & settling for the day at $12.63/share.
While the real body of Friday’s candle was focused on the lower third of the day’s range, volume was the third highest of the day as there appears to have been a mix of profit taking & risk-off into the weekend selling on the advancing session.
Monday’s session had glimmers of optimism, but also flashed caution lights for PSIL ETF.
The session opened on a gap higher, tested down to $0.05 lower than Friday’s close before powering higher to close the day +2.3%.
Volumes were above average Monday, but paled in comparison to the preceding five sessions which indicates weakness in sentiment, but the day’s high was $13.04, so there was appetite for higher prices than the prior two sessions.
Something to watch in the coming week is how PSIL moves in relation to broader markets, which look set to experience heightened volatility in the near-term (more on that in this week’s market review note).
If major indexes see major fallout they will not be immune, but they may fare better in the wake of the recent price run up & beginning of a new trading range establishment.
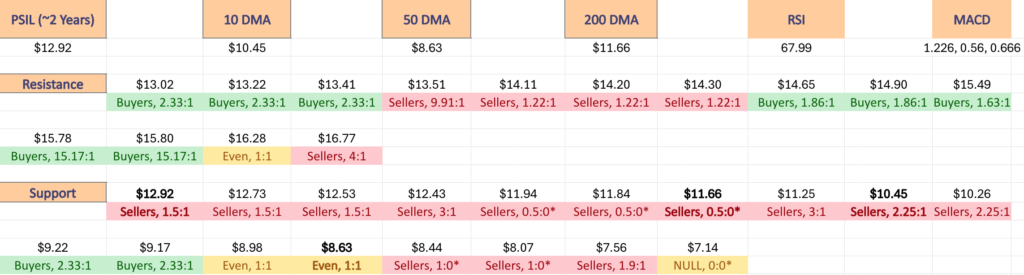
With that in mind, it will be important to have an understanding of how their support levels have previously been treated by market participants.
There are many in the support zone of $12.43-12.92, but if prices break down through that we will not see support again until $11.94-11.84 (pending the 10 day moving average doesn’t get above those levels first, which will depend on how long it takes for said test to play out).
Another key area to watch is the $12.92/share mark, which is yesterday’s closing price & also a support/resistance level from December of 2023.
In the event of upside movement that crosses through that & sets it as a support level, if prices continue up to $13.00/share they enter a Buyer dominated price zone, which may help them find footing to continue climbing.
If they don’t & it serves as resistance then PSIL will be stuck in a Seller dominated zone(s), as shown in the table below.
Before reading the table below, recall the note above of how PSIL had been in steady decline for most of the past seven months.
This would mean that a majority of their past year’s price levels are skewed towards Seller’s being the victorious force at play.
Most of the upside action from that time period came from last Tuesday’s jump, which will not be reflected in each price level’s data.
With that said, when using the ratios below that favor the Sellers, it is important to consider the magnitude of the Sellers:Buyers at each price zone compared to one another.
If a zone has 3:1 Sellers:Buyers & the next zone has only 1.08:1 Sellers:Buyers, it should be inferred that the former is more likely to be weaker than the latter based on historic behavior.
Once these zones have been tested more thoroughly the ratios will even out more & some may even flip to be Buyer dominated.
Again, this is not intended to serve as financial advice, but rather as a barometer of sentiment that can be used with your other due diligence practices.
Price Level:Volume Sentiment Analysis For PSIL, The AdvisorShares Psychedelics ETF
The top table below shows the support & resistance levels of PSIL from the past year’s chart, as well as their price level:volume sentiment at each, using Monday 10/22/24’s closing price.
The moving averages are denoted with bold.
The next charts show the volume sentiment at each individual price level PSIL has traded at over the past 2-3 years.
Beneath them is a copy & pasteable list of the same data, where the support/resistance levels are denoted in bold.
All ratios with “0” in the denominator are denoted with a “*”.
NULL values are price levels that had limited trading volume, whether it be due to gaps, quick advances or they are at price extremes; in the event that they are retested & there is more data they would have a distinct “Buyers”, “Sellers” or “Even” title.
This is not intended as financial advice, but rather another tool to consider when performing your own research & due diligence on PSIL ETF.
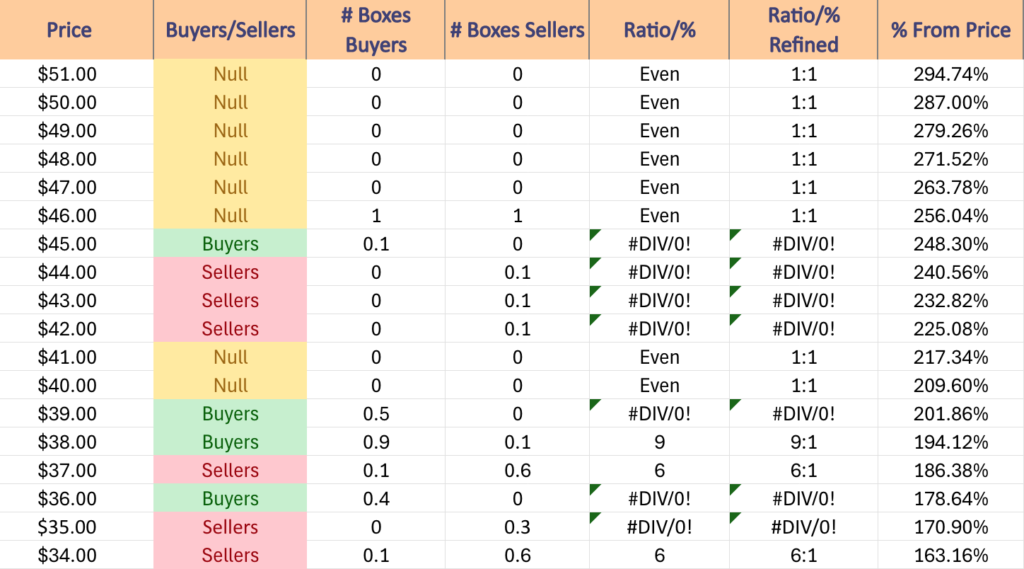
$51 – NULL – 0:0*, +294.74% From Current Price Level
$50 – NULL – 0:0*, +287% From Current Price Level
$49 – NULL – 0:0*, +279.26% From Current Price Level
$48 – NULL – 0:0*, +271.52% From Current Price Level
$47 – NULL – 0:0*, +263.78% From Current Price Level
$46 – Even – 1:1, +256.04% From Current Price Level
$45 = Buyers – 0.1:0*, +248.3% From Current Price Level
$44 – Sellers – 0.1:0*, +240.56% From Current Price Level
$43 – Sellers – 0.1:0*, +232.82% From Current Price Level
$42 – Sellers – 0.1:0*, +225.08% From Current Price Level
$41 – NULL – 0:0*, +217.34% From Current Price Level
$40 – NULL – 0:0*, +209.6% From Current Price Level
$39 – Buyers – 0.5:0*, +201.86% From Current Price Level
$38 – Buyers – 9:1, +194.12% From Current Price Level
$37 – Sellers – 6:1, +186.38% From Current Price Level
$36 – Buyers – 0.4:0*, +178.64% From Current Price Level
$35 – Sellers – 0.3:0*, +170.9% From Current Price Level
$34 – Sellers – 6:1, +163.16% From Current Price Level
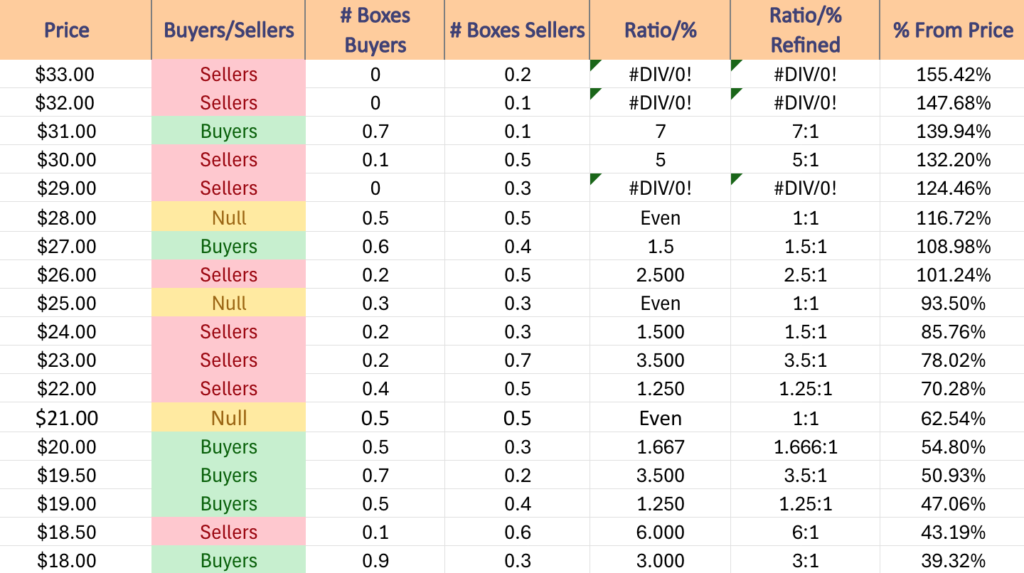
$33 – Seller s- 0.2:0*, +155.42% From Current Price Level
$32 – Sellers – 0.1:0*, +147.68% From Current Price Level
$31 – Buyers – 7:1, +139.94% From Current Price Level
$30 – Sellers – 5:1, +132.2% From Current Price Level
$29 – Sellers – 0.3:0*, +124.46% From Current Price Level
$28 – Even – 1:1, +116.72% From Current Price Level
$27 – Buyers – 1.5:1, +108.98% From Current Price Level
$26 – Sellers – 2.5:1, +101.24% From Current Price Level
$25 – Even – 1:1, +93.5% From Current Price Level
$24 – Sellers – 1.5:1, +85.76% From Current Price Level
$23 – Sellers – 3.5:1, +78.02% From Current Price Level
$22 – Sellers – 1.25:1, +70.28% From Current Price Level
$21 – Even – 1:1, +62.54% From Current Price Level
$20 – Buyers – 1.67:1, +54.8% From Current Price Level
$19.50 – Buyers – 3.5:1, +50.93% From Current Price Level
$19 – Buyers – 1.25:1, +47.06% From Current Price Level
$18.50 – Sellers – 6:1, +43.19% From Current Price Level
$18 – Buyers – 3:1, +39.32% From Current Price Level
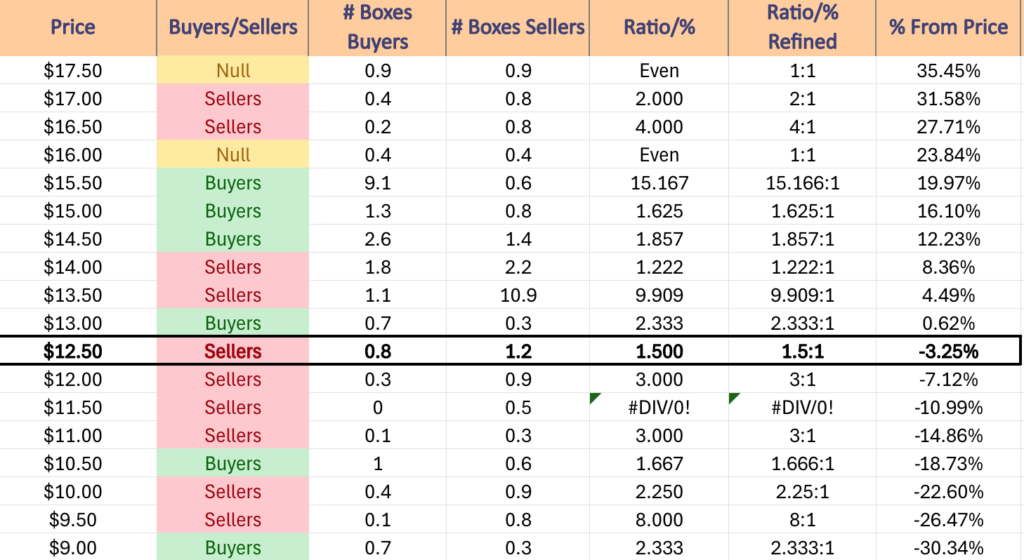
$17.50 – Even – 1:1, +35.45% From Current Price Level
$17 – Sellers – 2:1, +31.58% From Current Price Level
$16.50 – Sellers – 4:1, +27.71% From Current Price Level
$16 – Even – 1:1, +23.84% From Current Price Level
$15.50 – Buyers – 15.17:1, +19.97% From Current Price Level
$15 – Buyers – 1.63:1, +16.1% From Current Price Level
$14.50 – Buyers – 1.86:1, +12.23% From Current Price Level
$14 – Sellers – 1.22:1, +8.36% From Current Price Level
$13.50 – Sellers – 9.91:1, +4.49% From Current Price Level
$13 – Buyers – 2.33:1, +0.62% From Current Price Level
$12.50 – Sellers – 1.5:1, -3.25% From Current Price Level – Current Price Block & 10 Day Moving Average**
$12 – Sellers – 3:1, -7.12% From Current Price Level
$11.50 – Sellers – 0.5:0*, -10.99% From Current Price Level – 200 Day Moving Average*
$11 – Sellers – 3:1, -14.86% From Current Price Level
$10.50 – Buyers – 1.67:1, -18.73% From Current Price Level
$10 – Sellers – 2.25:1, -22.6% From Current Price Level
$9.50 – Sellers – 8:1, -26.47% From Current Price Level
$9 – Buyers – 2.33:1, -30.34% From Current Price Level
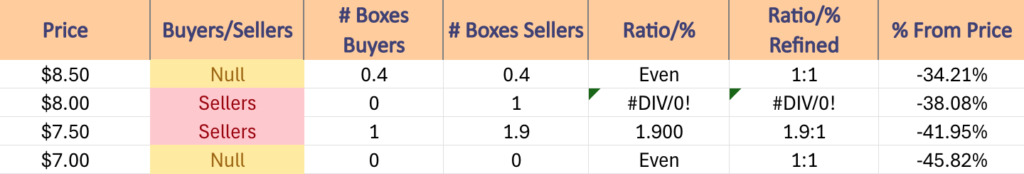
$8.50 – Even – 1:1, -34.21% From Current Price Level – 50 Day Moving Average*
$8 – Sellers – 1:0*, -38.08% From Current Price Level
$7.50 – Sellers – 1.9:1, -41.95% From Current Price Level
$7 – NULL – 0:0*, -45.82% From Current Price Level
*** I DO NOT OWN SHARES OR OPTIONS CONTRACT POSITIONS IN PSIL AT THE TIME OF PUBLISHING THIS ARTICLE ***