Stocks have had an interesting & full past month & a half since our last Volume Sentiment Analysis on 1/2/25, featuring declines, advances & a bit of consolidation as well.
SPY & QQQ are still near all-time highs, DIA’s ~1% below their ATH & IWM has been in a relatively range-bound oscillation phase.
Meanwhile, last night the VIX closed at 15.35, indicating an implied one day move of +/-0.97% & an implied one month move of +/-4.44% for the S&P 500.
There are a lot of mixed signals out there, but one thing is certain, market participants have lost steam & are beginning to get a bit nervous.
As noted in this week’s note, when comparing the previous year’s average volume vs. that same metric from 2/18/2024 SPY’s average volume is down -34.7% Y-o-Y, QQQ’s average volume is down -31.44% Y-o-Y, IWM’s is -15.93% lower Y-o-Y & DIA’s is -6% lower Y-o-Y.
This will need to change if there is going to be any meaningful breakouts above the recent all-time highs that are sustainable runs.
January’s FOMC minutes are due to be released this afternoon, NVDA reports earnings one week from today & there are still many other earnings reports due out this & next week, which are all things that traders & investors are waiting on before deciding their next moves.
With this in mind, it is important to understand how each index ETF has performed in recent history, as it lends clues into the strength/weakness of each index’s support/resistance levels.
This can be valuable when assessing risk in the event of retests of any of these levels.
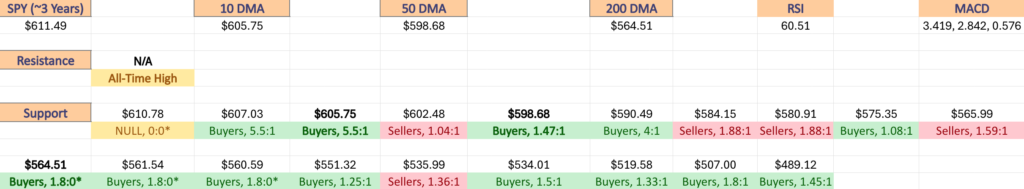
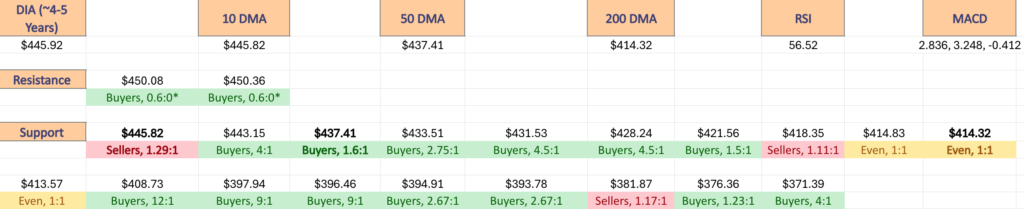
Each section below contains a view of each index ETF’s chart (for a technical breakdown of each ETF’s chart please see this past weekend’s market review note), as well as a list of their current one year support & resistance levels with the volume sentiment noted beneath it on the table.
There is an additional table beneath this table with each price level’s sentiment, as well as a typed text version below that is able to be copied & pasted.
Note that “NULL, 0:0*” values denote areas that each name has traded at but with limited volume data to work with from a comparison standpoint in terms of creating a ratio of buyers:sellers (or vice versa) or is the outlier above the highest/lowest level with price data.
Also, prices that do have a ratio of Buyers:Sellers (Sellers:Buyers) where the denominator is 0 are denoted with an asterisk “*” as well.
In the written lists of the price levels & volume sentiments the price levels that contain support & resistance levels are marked in BOLD.
Recall that at price extremes such as the highs that we have recently hit there will tend to be skewed data due to the small sample size & factor that into how you interpret each price level’s reported sentiment.
This is intended to serve as an additional tool, similar to a barometer to use during your due diligence process & is not meant to replace doing your own research & is not financial advice.
Price Level:Volume Sentiment Analysis For SPY, The SPDR S&P 500 ETF
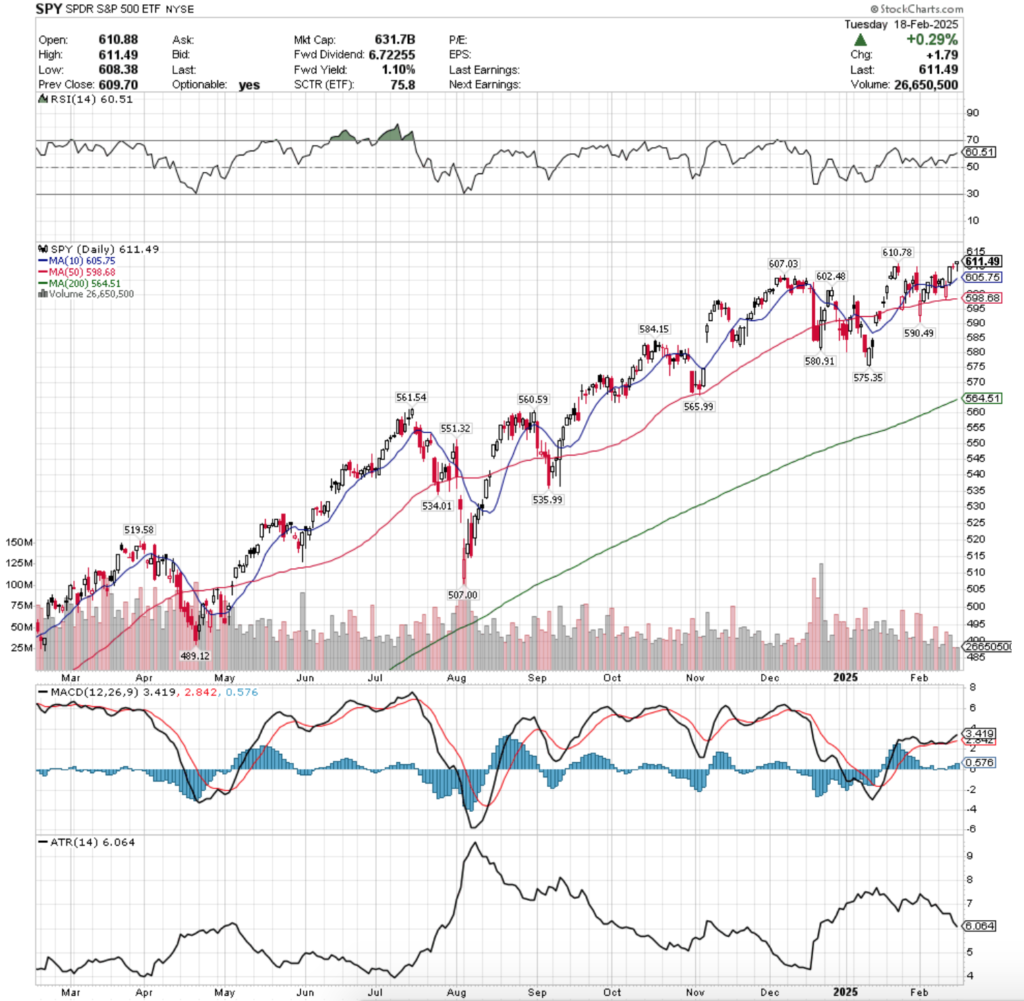
SPY, the SPDR S&P 500 ETF‘s volume above is concerning, given that their resistance level is their all-time high but volumes have been visibly declining throughout 2025.
In the event that there is no catalyst higher the data below will be helpful to assess the risks associated with each support level’s retest in the near-term.
The flattening of SPY’s moving averages is also an area of concern, making it even more important to review the data in the tables below, which outlines the volume sentiments of each price level SPY has traded at over the past ~3 years.
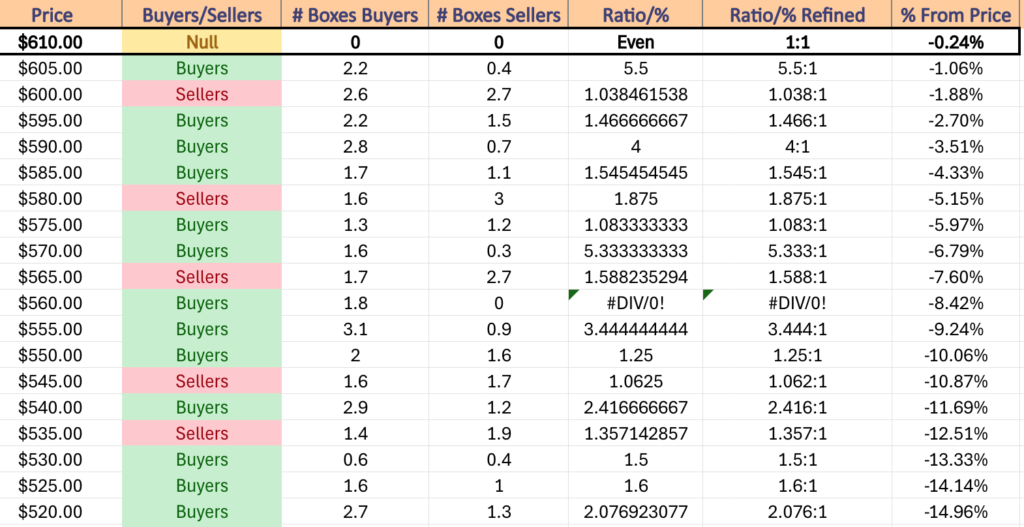
$610 – NULL – 0:0*, -0.24% From Current Price Level – Current Price Level & All-Time High**
$605 – Buyers – 5.5:1, -1.06% From Current Price Level – 10 Day Moving Average*
$600 – Sellers – 1.04:1, -1.88% From Current Price Level
$595 – Buyers – 1.47:1, -2.7% From Current Price Level – 50 Day Moving Average*
$590 – Buyers – 4:1, -3.51% From Current Price Level
$585 – Buyers – 1.55:1, -4.33% From Current Price Level
$580 – Sellers – 1.88:1, -5.15% From Current Price Level
$575 – Buyers – 1.08:1, -5.97% From Current Price Level
$570 – Buyers – 5.33:1, -6.79% From Current Price Level
$565 – Sellers -1.59:1, -7.6% From Current Price Level
$560 – Buyers – 1.8:0*, -8.42% From Current Price Level – 200 Day Moving Average*
$555 – Buyers – 3.44:1, -9.24% From Current Price Level
$550 – Buyers – 1.25:1, -10.06% From Current Price Level
$545 – Sellers – 1.06:1, -10.87% From Current Price Level
$540 – Buyers – 2.42:1, -11.69% From Current Price Level
$535 – Sellers – 1.36:1, -12.51% From Current Price Level
$530 – Buyers – 1.5:1, -13.33% From Current Price Level
$525 – Buyers – 1.6:1, -14.14% From Current Price Level
$520 – Buyers -2.08:1, -14.96% From Current Price Level
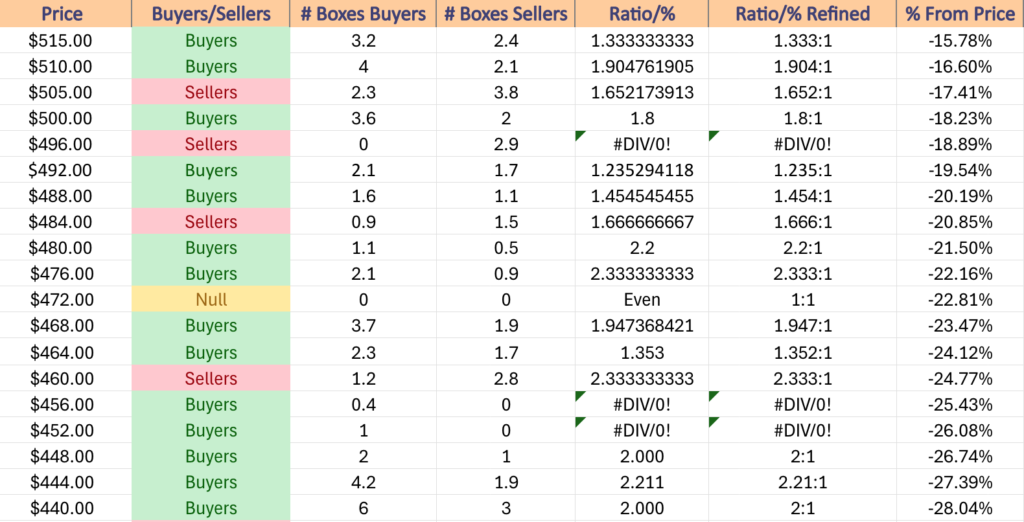
$515 – Buyers – 1.33:1, -15.78% From Current Price Level
$510 – Buyers – 1.9:1, -16.6% From Current Price Level
$505 – Sellers – 1.65:1, -17.14% From Current Price Level
$500 -Buyers – 1.8:1, -18.23% From Current Price Level
$496 – Sellers – 2.9:0*, -18.89% From Current Price Level
$492 – Buyers – 1.24:1, -19.54% From Current Price Level
$488 – Buyers – 1.45:1, -20.19% From Current Price Level
$484 – Sellers – 1.67:1, -20.85% From Current Price Level
$480 – Buyers – 2.2:1, -21.5% From Current Price Level
$476 – Buyers – 2.33:1, -22.16% From Current Price Level
$472 – NULL – 0:0*, – 22.81% From Current Price Level
$468 – Buyers – 1.95:1, -23.47% From Current Price Level
$464 – Buyers – 1.35:1, -24.12% From Current Price Level
$460 – Sellers – 2.33:1, -24.77% From Current Price Level
$456 – Buyers – 0.4:0*, -25.43% From Current Price Level
$452 – Buyers – 1:0*, -26.08% From Current Price Level
$448 – Buyers- 2:1, -26.74% From Current Price Level
$444 – Buyers – 2.21:1, -27.39% From Current Price Level
$440 – Buyers – 2:1, -28.04% From Current Price Level
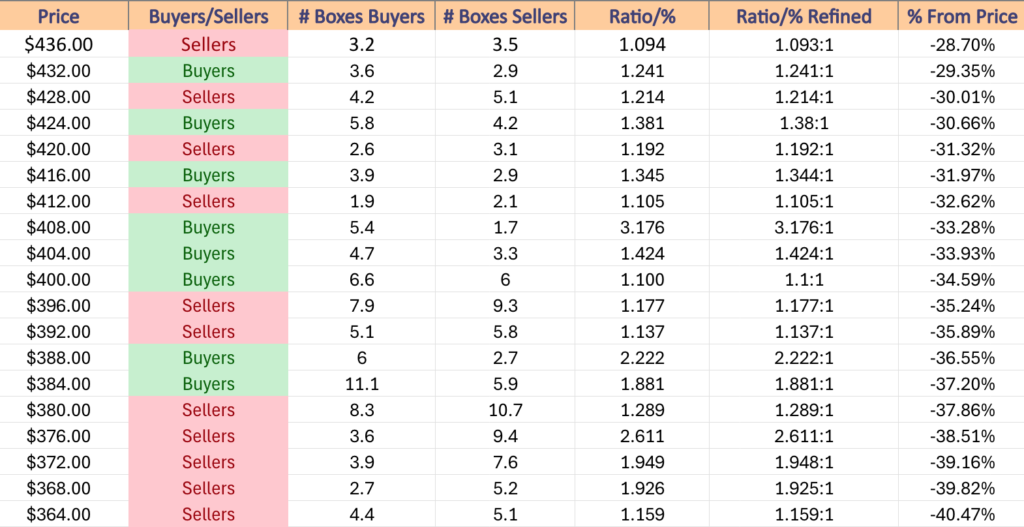
$436 – Sellers – 1.09:1, -28.7% From Current Price Level
$432 – Buyers – 1.24:1, -29.35% From Current Price Level
$428 – Sellers – 1.21:1, -30.01% From Current Price Level
$424 – Buyers – 1.38:1, -30.66% From Current Price Level
$420 – Sellers – 1.19:1, -31.32% From Current Price Level
$416 – Buyers – 1.34:1, -31.97% From Current Price Level
$412 – Sellers – 1.11:1, -32.62% From Current Price Level
$408 – Buyers – 3.18:1, -33.28% From Current Price Level
$404 – Buyers – 1.42:1, -33.93% From Current Price Level
$400 – Buyers – 1.1:1, -34.59% From Current Price Level
$396 – Sellers – 1.18:1, -35.24% From Current Price Level
$392 – Sellers – 1.14:1, -35.89% From Current Price Level
$388 – Buyers – 2.22:1, -36.55% From Current Price Level
$384 – Buyers – 1.88:1, -37.2% From Current Price Level
$380 – Sellers – 1.29:1, -37.86% From Current Price Level
$376 – Sellers – 2.61:1, -38.5% From Current Price Level
$372 – Sellers – 1.95:1, -39.16% From Current Price Level
$368 – Sellers – 1.93:1, -39.82% From Current Price Level
$364 – Sellers – 1.16:1, -40.47% From Current Price Level
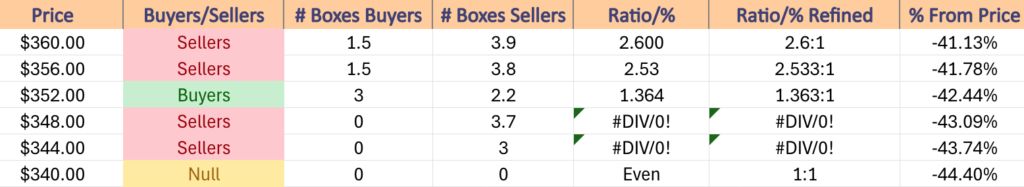
$360 – Sellers – 2.6:1, -41.13% From Current Price Level
$356 – Sellers – 2.53:1, -42.78% From Current Price Level
$352 – Buyers – 1.36:1. -42.44% From Current Price Level
$348 – Sellers – 3.7:0*, -43.09% From Current Price Level
$344 – Sellers – 3:0*, -43.74% From Current Price Level
$340 – NULL – 0:0*, -44.4% From Current Price Level
Price Level:Volume Sentiment Analysis For QQQ, The Invesco QQQ Trust ETF
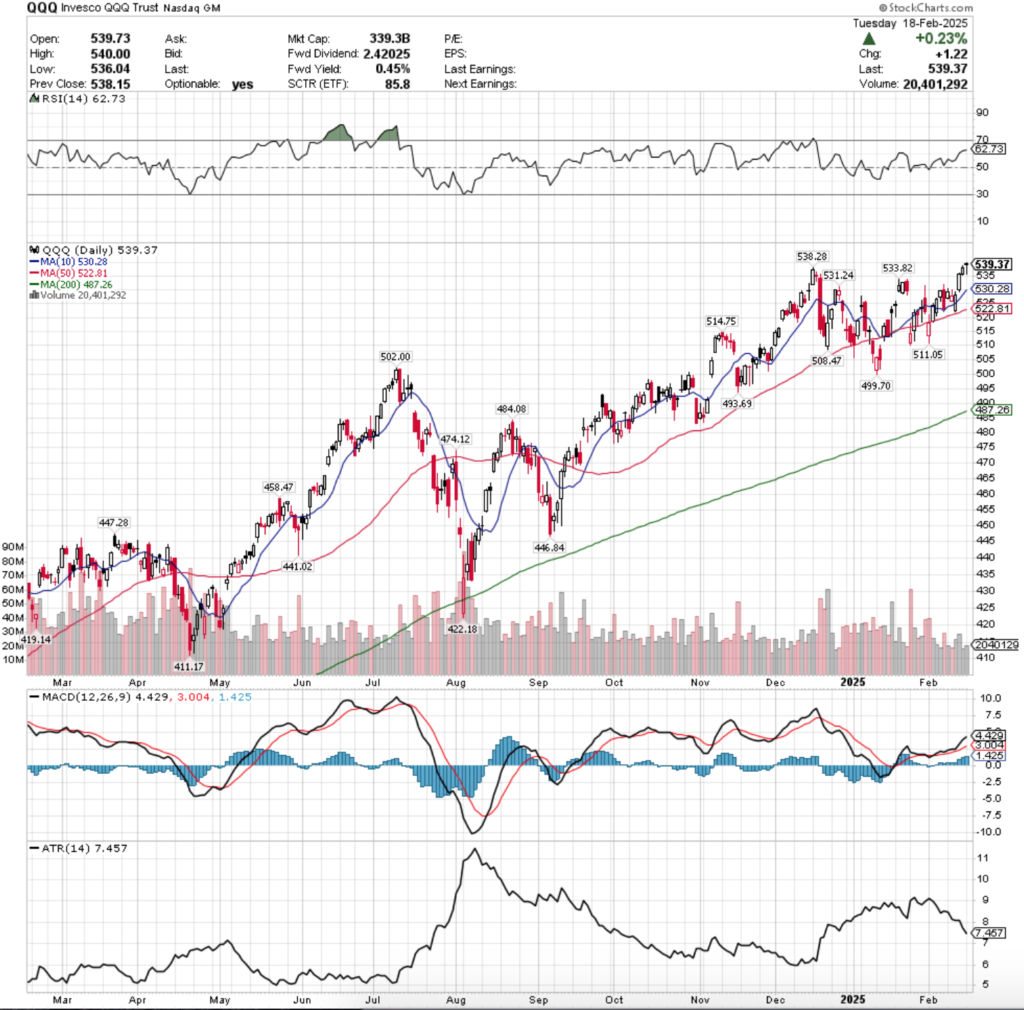
QQQ, the Invesco QQQ Trust ETF that tracks the NASDAQ 100 has also witnessed a similar reduction in volume while sitting near all-time highs.
Without a meaningful increase in volume it seems unlikely that there’s much of a chance of a sustainable climb higher beyond the current ATH’s from here & that there will be retests of their more recent support levels.
Given that these support levels are relatively sparse as noted in this week’s note (link in into section), it is beneficial to understand how market participants have behaved at each price level QQQ’s traded at over the past ~2-3 years, shown below.
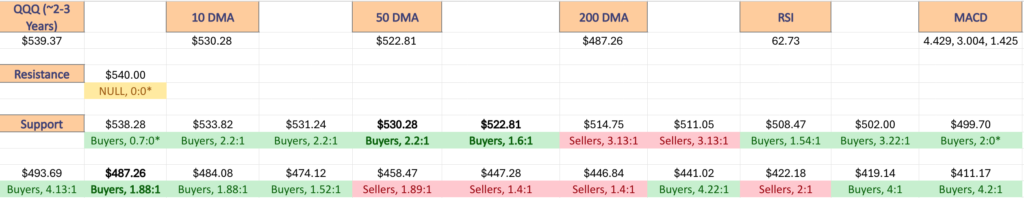
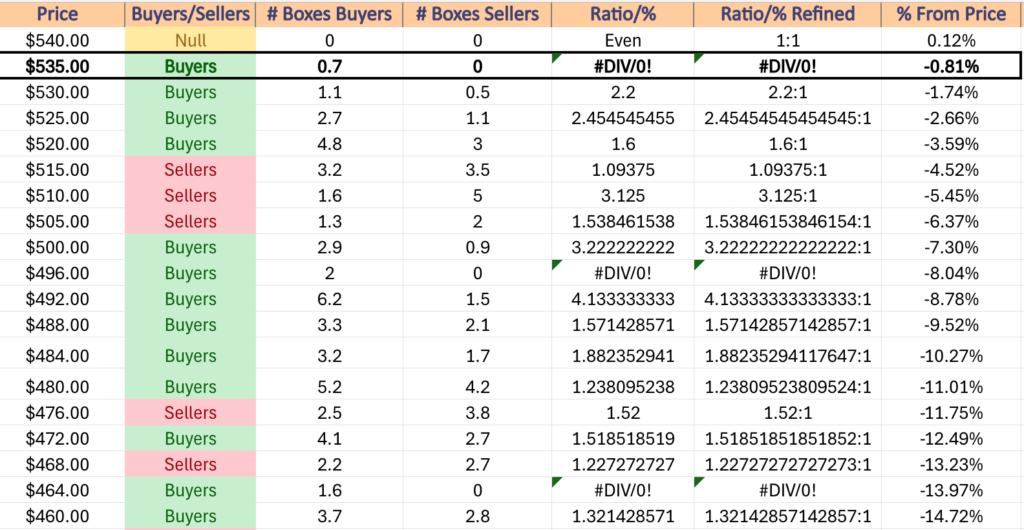
$540 – NULL – 0:0*, +0.12% From Current Price Level – All-Time High*
$535 – Buyers – 0.7:0*, -0.81% From Current Price Level – Current Price Level*
$530 – Buyers – 2.2:1, -1.74% From Current Price Level – 10 Day Moving Average*
$525 – Buyers – 2.46:1, -2.66% From Current Price Level
$520 – Buyers – 1.6:1, -3.59% From Current Price Level – 50 Day Moving Average*
$515 – Sellers – 1.09:1, -4.52% From Current Price Level
$510 – Sellers – 3.13:1, -5.45% From Current Price Level
$505 – Sellers – 1.54:1, -6.37% From Current Price Level
$500 – Buyers – 3.22:1, -7.3% From Current Price Level
$496 – Buyers – 2:0*, -8.04% From Current Price Level
$492 – Buyers – 4.13:1, -8.78% From Current Price Level
$488 – Buyers – 1.57:1, -9.52% From Current Price Level
$484 – Buyers – 1.88:1, -10.27% From Current Price Level – 200 Day Moving Average*
$480 – Buyers – 1.24:1, -11.01% From Current Price Level
$476 – Sellers – 1.52:1, -11.75% From Current Price Level
$472 – Buyers – 1.52:1, -12.49% From Current Price Level
$468 – Sellers – 1.23:1, -13.23% From Current Price Level
$464 – Buyers – 1.6:0*, -13.97% From Current Price Level
$460 – Buyers – 1.32:1, -14.72% From Current Price Level
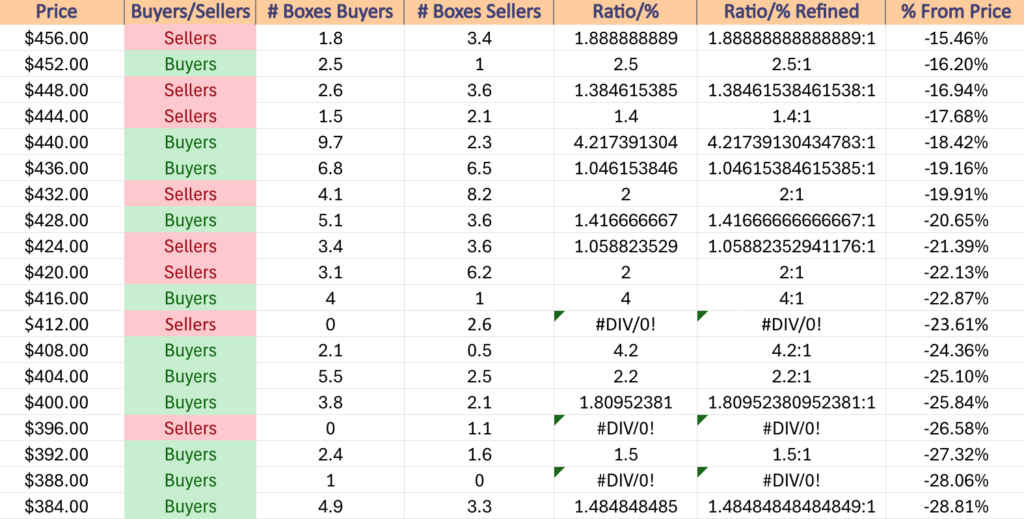
$456 – Sellers – 1.89:1, -15.46% From Current Price Level
$452 – Buyers – 2.5:1, -16.2% From Current Price Level
$448 – Sellers – 1.39:1, -16.94% From Current Price Level
$444 – Sellers – 1.4:1, -17.68% From Current Price Level
$440 – Buyers – 4.22:1, -18.42% From Current Price Level
$436 – Buyers – 1.05:1, -19.16% From Current Price Level
$432 – Sellers – 2:1, -19.91% From Current Price Level
$428 – Buyers – 1.42:1, -20.65% From Current Price Level
$424 – Sellers – 1.06:1, -21.39% From Current Price Level
$420 – Sellers – 2:1, -22.13% From Current Price Level
$416 – Buyers – 4:1, -22.87% From Current Price Level
$412 – Sellers – 2.6:0*, -23.61% From Current Price Level
$408 – Buyers – 4.2:1, -24.36% From Current Price Level
$404 – Buyers – 2.2:1, -25.1% From Current Price Level
$400 – Buyers – 1.81:1, -25.84% From Current Price Level
$396 – Sellers – 1.1:0*, -26.58% From Current Price Level
$392 – Buyers – 1.5:1, -27.32% From Current Price Level
$388 – Buyers – 1:0*, -28.06% From Current Price Level
$384 – Buyers – 1.49:1, -28.81% From Current Price Level
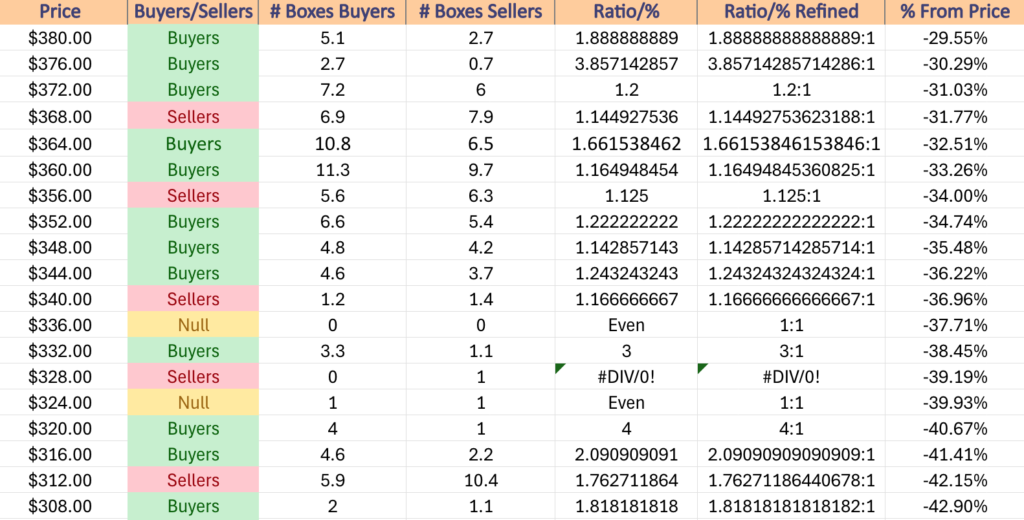
$380 – Buyers – 1.89:1, -29.55% From Current Price Level
$376 – Buyers – 3.86:1. -30.29% From Current Price Level
$372 – Buyers – 1.2:1, -31.03% From Current Price Level
$368 – Sellers – 1.15:1, -31.77% From Current Price Level
$364 – Buyers – 1.66:1, -32.51% From Current Price Level
$360 – Buyers – 1.17:1, -33.26% From Current Price Level
$356 – Sellers – 1.13:1, -34% From Current Price Level
$352 – Buyers – 1.22:1, -34.74% From Current Price Level
$348 – Buyers – 1.14:1, -35.48% From Current Price Level
$344 – Buyers – 1.24:1, -36.22% From Current Price Level
$340 – Sellers – 1.17:1, -36.96% From Current Price Level
$336 – NULL – 0:0*, -37.71% From Current Price Level
$332 – Buyers – 3:1, -38.45% From Current Price Level
$328 – Sellers – 1:0*, -39.19% From Current Price Level
$324 – Even – 1:1, -39.93% From Current Price Level
$320 -Buyers – 4:1, -40.67% From Current Price Level
$316 – Buyers- 2.09:1, -41.41% From Current Price Level
$312 – Sellers – 1.76:1, -42.15% From Current Price Level
$308 – Buyers – 1.82:1, -42.9% From Current Price Level
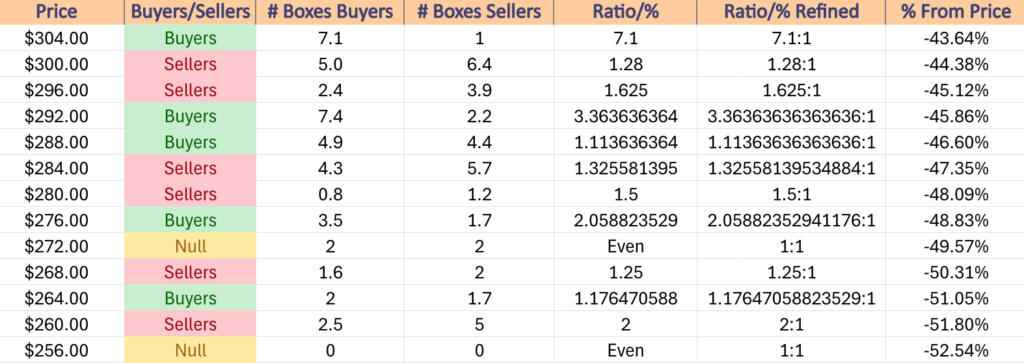
$304 – Buyers – 7.1:1, -43.64% From Current Price Level
$300 – Sellers – 1.28:1, -44.38% From Current Price Level
$296 – Sellers – 1.63:1, -45.12% From Current Price Level
$292 – Buyers – 3.36:1, -45.86% From Current Price Level
$288 – Buyers – 1.11:1, -46.6% From Current Price Level
$284 – Sellers – 1.33:1, -47.35% From Current Price Level
$280 – Sellers – 1.5:1, -48.09% From Current Price Level
$276 – Buyers – 2.06:1, -48.83% From Current Price Level
$272 – Even – 1:1, -49.57% From Current Price Level
$268 – Sellers – 1.25:1, -50.31% From Current Price Level
$264 – Buyers – 1.18:1, -51.05% From Current Price Level
$260 – Sellers – 2:1, -51.8% From Current Price Level
$256 – NULL – 0:0*, -52.54% From Current Price Level
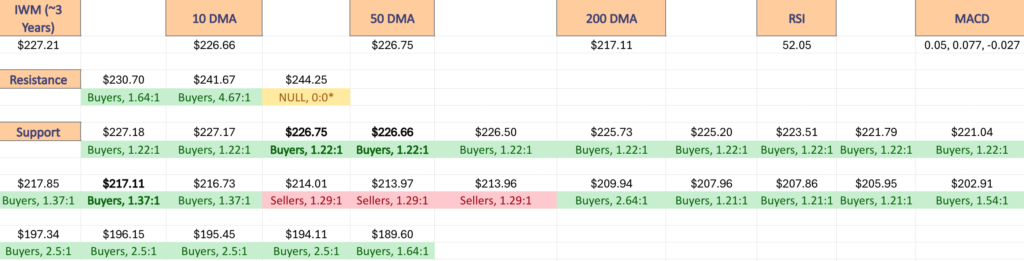
Price Level:Volume Sentiment Analysis For IWM, The iShares Russell 2000 ETF
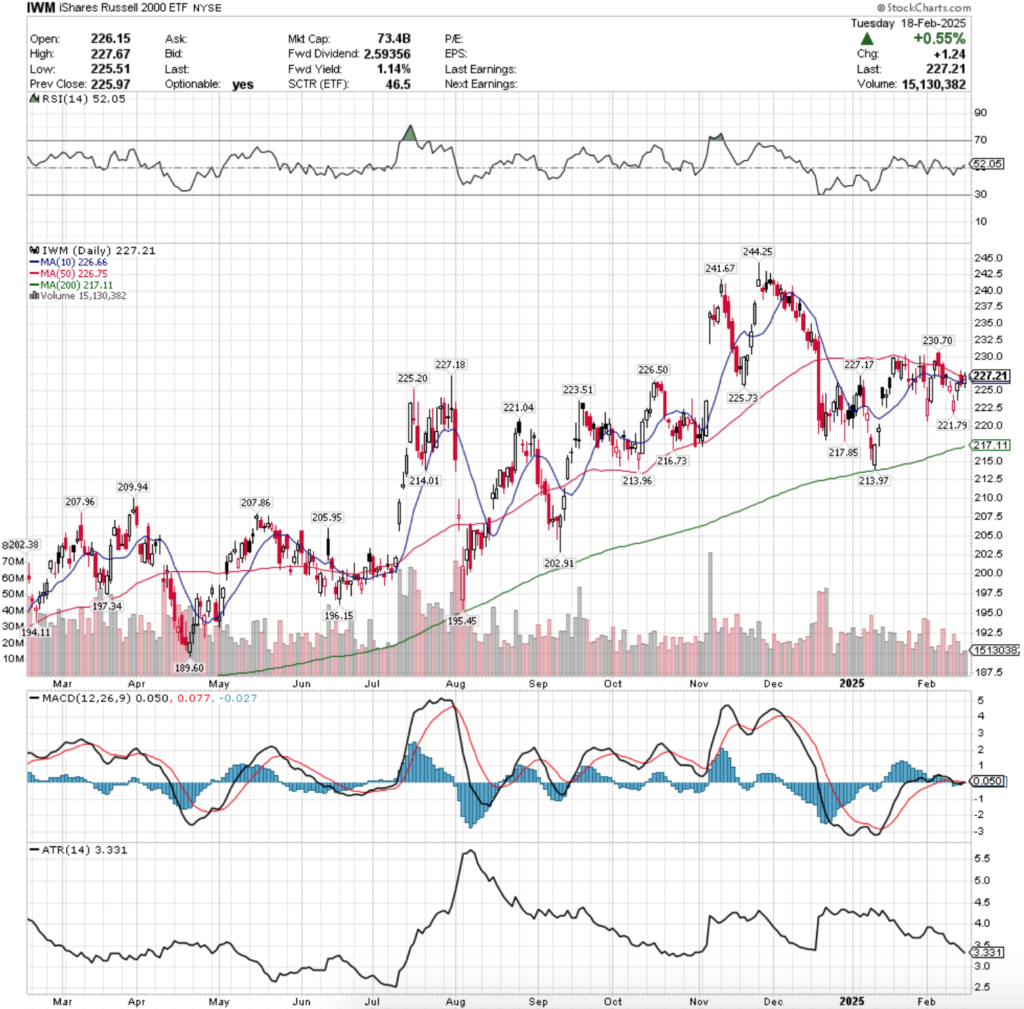
IWM, the iShares Russell 2000 ETF‘s recent volume declines are similar to SPY & QQQ’s, but not quite as drastic when compared to the year prior.
Still, given that they have been oscillating between support & resistance zones for much of 2025 to date it is worth having an understanding of how each support/resistance level/zone has held up in terms of strength/weakness in order to assess risk moving forward.
The tables below outline IWM’s volume sentiment at each price level that they’ve traded at over the past ~3 years, which will also prove beneficial when they ultimately break out, be it to the upside or downside.
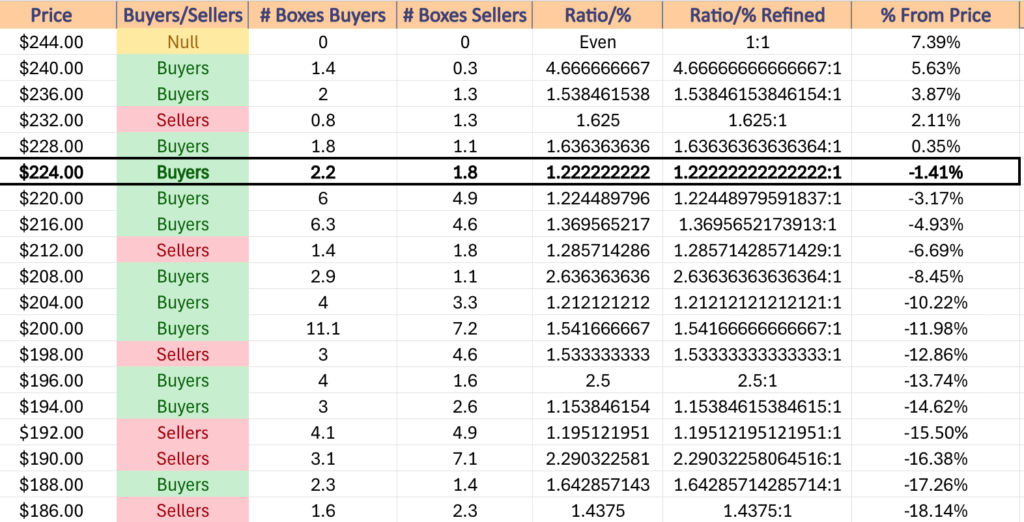
$244 – NULL – 0:0*, +7.39% From Current Price Level – All Time High*
$240 – Buyers – 4.67:1, +5.63% From Current Price Level
$236 – Buyers – 1.54:1, +3.87% From Current Price Level
$232 – Sellers – 1.63:1, +2.11% From Current Price Level
$228 – Buyers – 1.64:1, +0.35% From Current Price Level
$224 – Buyers – 1.22:1, -1.41% From Current Price Level – Current Price Level, 10 & 50 Day Moving Averages***
$220 – Buyers – 1.23:1, -3.17% From Current Price Level
$216 – Buyers – 1.37:1, -4.93% From Current Price Level – 200 Day Moving Average*
$212 – Sellers – 1.29:1, -6.69% From Current Price Level
$208 – Buyers – 2.64:1, -8.45% From Current Price Level
$204 – Buyers – 1.21:1, -10.22% From Current Price Level
$200 – Buyers – 1.54:1, -11.98% From Current Price Level
$198 – Sellers – 1.53:1, -12.86% From Current Price Level
$196 – Buyers – 2.5:1, -13.74% From Current Price Level
$194 – Buyers – 1.15:1, -14.62% From Current Price Level
$192 – Sellers – 1.2:1, -15.5% From Current Price Level
$190 – Sellers – 2.29:1, -16.38% From Current Price Level
$188 – Buyers – 1.64:1, -17.26% From Current Price Level
$186 – Sellers – 1.44:1, -18.14% From Current Price Level
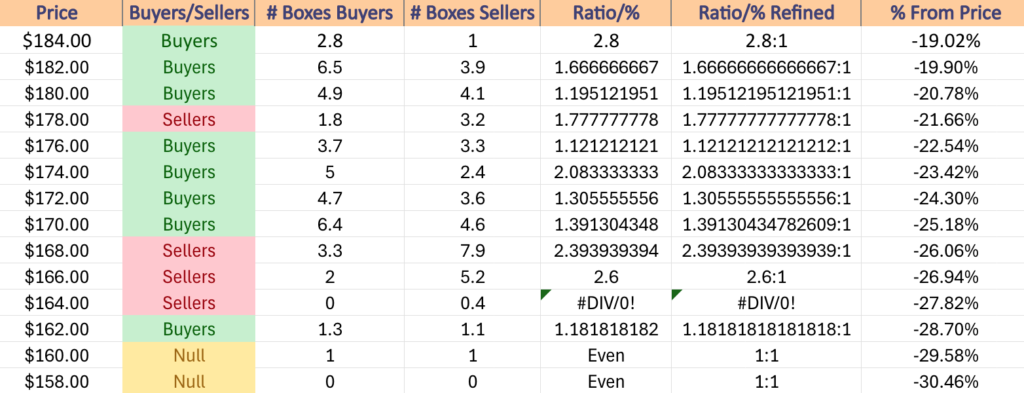
$184 – Buyers – 2.8:1, -19.02% From Current Price Level
$182 – Buyers – 1.67:1, -19.9% From Current Price Level
$180 – Buyers – 1.2:1, -20.78% From Current Price Level
$178 – Sellers – 1.78:1, -21.66% From Current Price Level
$176 – Buyers – 1.12:1, -22.54% From Current Price Level
$174 – Buyers – 2.08:1, -23.42% From Current Price Level
$172 – Buyers – 1.31:1, -24.3% From Current Price Level
$170 – Buyers – 1.39:1, -25.18% From Current Price Level
$168 – Sellers – 2.39:1, 26.06% From Current Price Level
$166 – Sellers – 2.6:1, -26.94% From Current Price Level
$164 – Sellers – 0.4:0*, -27.82% From Current Price Level
$162 – Buyers – 1.18:1, -28.7% From Current Price Level
$160 – Even – 1:1, -29.58% From Current Price Level
$158 – NULL – 0:0*, -30.46% From Current Price Level
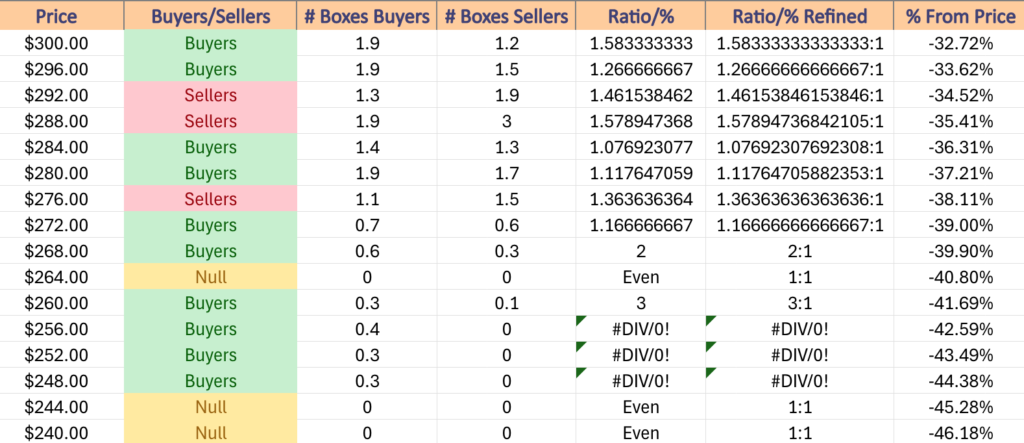
Price Level:Volume Sentiment Analysis For DIA, The SPDR Dow Jones Industrial Average ETF
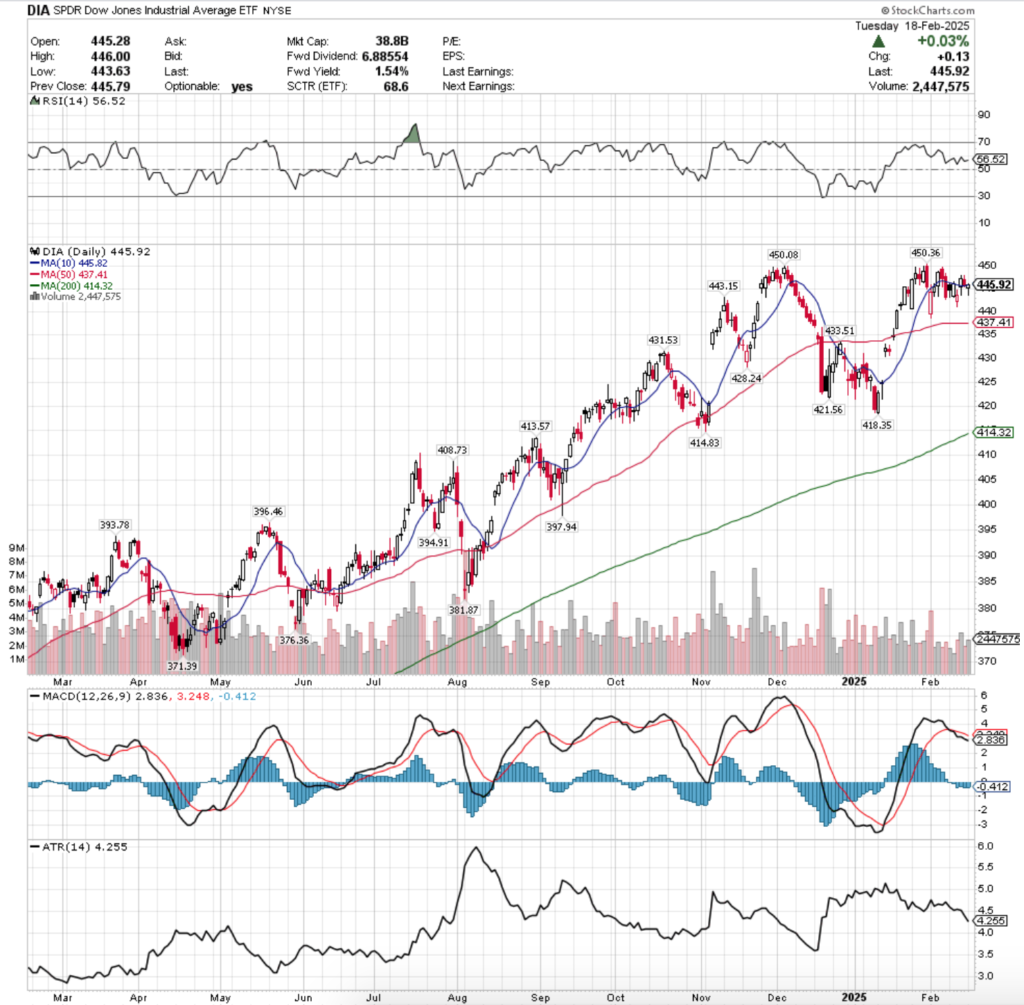
DIA, the SPDR Dow Jones Industrial Average ETF has also seen less volume over the month of February while it has been in a consolidation range just below it’s all-time high.
With a flat 10 Day Moving Average just below its price & a flat 50 DMA just -5.28% below it & limited other support levels it’s a good time to check in on the volume sentiment around the prices that it has traded at in recent history.
The tables below outline DIA’s volume sentiment at the price levels it has traded at over the past ~4-5 years.
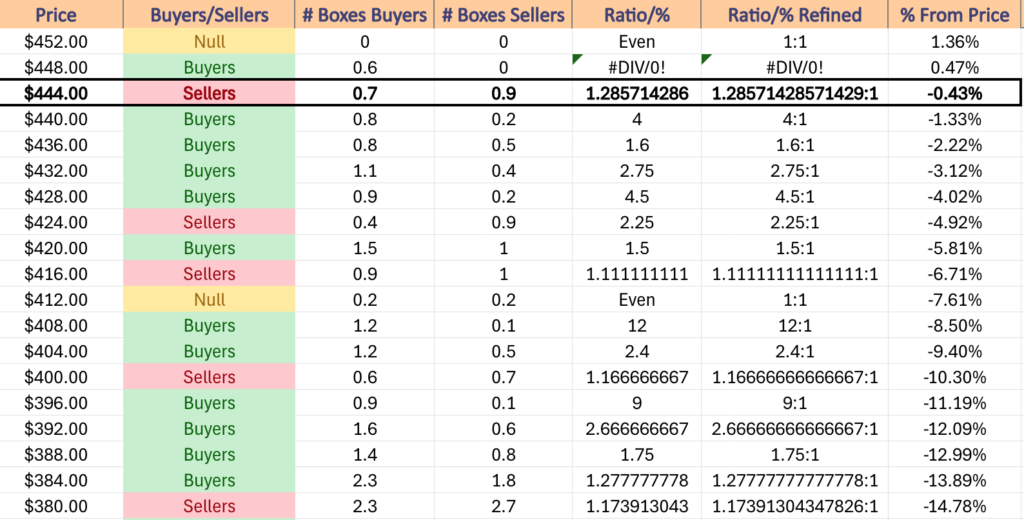
$452 – NULL – 0:0*, +1.36% From Current Price Level
$448 – Buyers – 0.6:0*, +0.47% From Current Price Level – All-Time High*
$444 – Sellers – 1.29:1, -0.43% From Current Price Level – Current Price Level & 10 Day Moving Average*
$440 – Buyers – 4:1, -1.33% From Current Price Level
$436 – Buyers – 1.6:1, -2.22% From Current Price Level – 50 Day Moving Average*
$432 – Buyers – 2.75:1, -3.12% From Current Price Level
$428 – Buyers – 4.5:1, -4.02% From Current Price Level
$424 – Sellers – 2.25:1, -4.92% From Current Price Level
$420 – Buyers – 1.5:1, -5.81% From Current Price Level
$416 – Sellers – 1.11:1, -6.71% From Current Price Level
$412 – Even – 1:1, -7.61% From Current Price Level – 200 Day Moving Average*
$408 – Buyers – 12:1, -8.5% From Current Price Level
$404 – Buyers – 2.4:1, -9.4% From Current Price Level
$400 – Sellers – 1.17:1, -10.3% From Current Price Level
$396 – Buyers – 9:1, -11.19% From Current Price Level
$392 – Buyers – 2.67:1, -12.09% From Current Price Level
$388 – Buyers – 1.75:1, -12.99% From Current Price Level
$384 – Buyers – 1.28:1, -13.89% From Current Price Level
$380 – Sellers – 1.17:1, -14.78% From Current Price Level
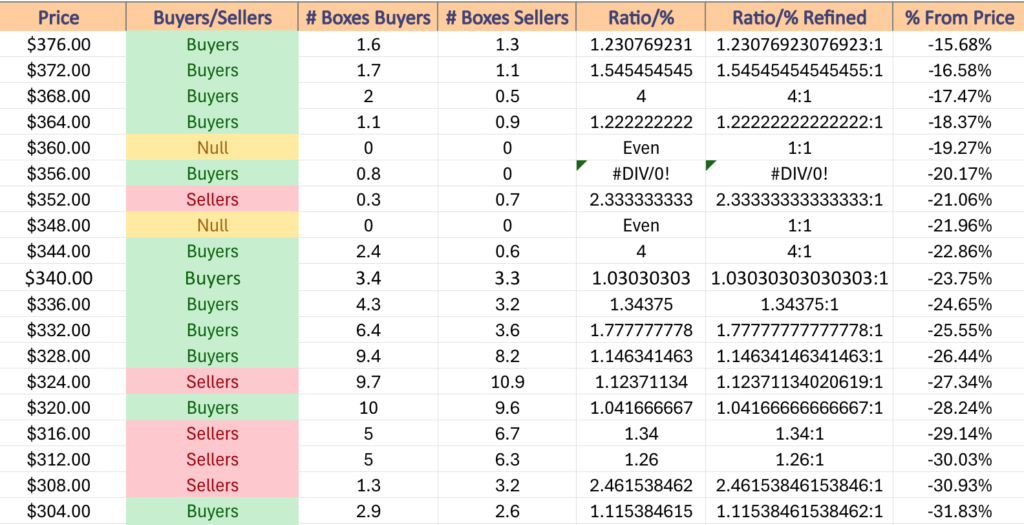
$376 – Buyers – 1.23:1, -15.68% From Current Price Level
$372 – Buyers – 1.55:1, -16.58% From Current Price Level
$368 – Buyers – 4:1, -17.47% From Current Price Level
$364 – Buyers – 1.22:1, -18.37% From Current Price Level
$360 – NULL – 0:0*, -19.27% From Current Price Level
$356 – Buyers – 0.8:0*, -20.17% From Current Price Level
$352 – Sellers – 2.33:1, -21.06% From Current Price Level
$348 – NULL – 0:0*, -21.96% From Current Price Level
$344 – Buyers – 4:1, -22.86% From Current Price Level
$340 – Buyers – 1.03:1, -23.75% From Current Price Level
$336 – Buyers – 1.34:1, -24.65% From Current Price Level
$332 – Buyers – 1.78:1, -25.55% From Current Price Level
$328 – Buyers – 1.15:1, -26.44% From Current Price Level
$324 – Sellers – 1.12:1, -27.34% From Current Price Level
$320 – Buyers – 1.04:1 – 28.24% From Current Price Level
$316 – Sellers – 1.34:1, -29.14% From Current Price Level
$312 – Sellers – 1.26:1, -30.03% From Current Price Level
$308 – Sellers – 2.46:1, -30.96% From Current Price Level
$304 – Buyers – 1.12:1, -31.83% From Current Price Level
$300 – Buyers – 1.58:1, -32.72% From Current Price Level
$296 – Buyers – 1.27:1, -33.62% From Current Price Level
$292 – Sellers – 1.46:1, -34.52% From Current Price Level
$288 – Sellers – 1.58:1, -35.41% From Current Price Level
$284 – Buyers – 1.08:1, -36.31% From Current Price Level
$280 – Buyers – 1.12:1, -37.21% From Current Price Level
$276 – Sellers – 1.36:1, -38.11% From Current Price Level
$272 – Buyers – 1.17:1, -39% From Current Price Level
$268 – Buyers – 2:1, -39.9% From Current Price Level
$264 – NULL – 0:0*, -40.8% From Current Price Level
$260 – Buyers – 3:1, -41.69% From Current Price Level
$256 – Buyers – 0.4:0*, -42.59% From Current Price Level
$252 – Buyers – 0.3:0*, -43.49% From Current Price Level
$248 – Buyers – 0.3:0*, -44.38% From Current Price Level
$244 – NULL – 0:0*, -45.28% From Current Price Level
$240 – NULL – 0:0*, -46.18% From Current Price Level
*** I DO NOT OWN SHARES OR OPTIONS CONTRACT POSITIONS IN SPY, QQQ, IWM OR DIA AT THE TIME OF PUBLISHING THIS ARTICLE ***