What a week it’s been; a 50 bps cut from the FOMC, fresh all-time highs for the S&P 500 & Dow Jones Industrial Average & the usual gloomy month of September has been ok for stocks thus far, although the VIX sits at 16.8, indicating an implied one day move of +/-1.06% & an implied one month move of +/-4.86%.
Many of the same elements of political uncertainty in the U.S. & abroad remain or have escalated since our last index ETF price level:volume sentiment check in from July & as a result volatility looks to remain elevated in the coming months.
This makes it a prime time to check in on historic Buyer:Seller (or Seller:Buyer) sentiment at the price levels that each index ETF has traded at over the past few years in order to assess the strength of each’s support & resistance levels.
Due to the aforementioned new high price levels that each index ETF has been experiencing & the subdued volumes that we have seen since April many of the higher range price levels are still “NULL”, meaning that they are not 0, but there is not enough data currently to work with in terms of assigning buyer:seller (Seller:Buyer) strength ratios.
Additionally, you will notice as you go through the numbers that the higher prices tend to skew more towards the buyers, as there have been limited downside tests against these price levels, and the low volumes have not helped this.
Similarly, you will notice that there tend to be more sellers towards the lower ends of the price ranges.
Upon retests of a price level these numbers will become evened out more, but in the meantime the strength (weakness) of each level’s ratio can be used like a barometer to assess how strongly buyers & sellers have historically felt at each & how that may impact their decisions in the future.
Each section below contains a view of each index ETF’s chart (for a technical breakdown of each ETF’s chart please see this past weekend’s market review note), as well as a list of their current one year support & resistance levels with the volume sentiment noted beneath it on the table.
There is an additional table beneath this table with each price level’s sentiment, as well as a typed text version below that is able to be copied & pasted.
Note that “NULL, 0:0*” values denote areas that each name has traded at but with limited volume data to work with from a comparison standpoint in terms of creating a ratio of buyers:sellers (or vice versa).
Also, prices that do have a ratio of Buyers:Sellers (Sellers:Buyers) where the denominator is 0 are denoted with an asterisk “*” as well.
In the written lists of the price levels & volume sentiments the price levels that contain support & resistance levels are marked in BOLD.
Recall that at price extremes such as the highs that we have recently hit there will tend to be skewed data due to the small sample size & factor that into how you interpret each price level’s reported sentiment.
This is intended to serve as an additional tool to use during your due diligence process & is not meant to replace doing your own research & is not financial advice.
Price Level:Volume Sentiment Analysis For SPY (S&P 500) ETF
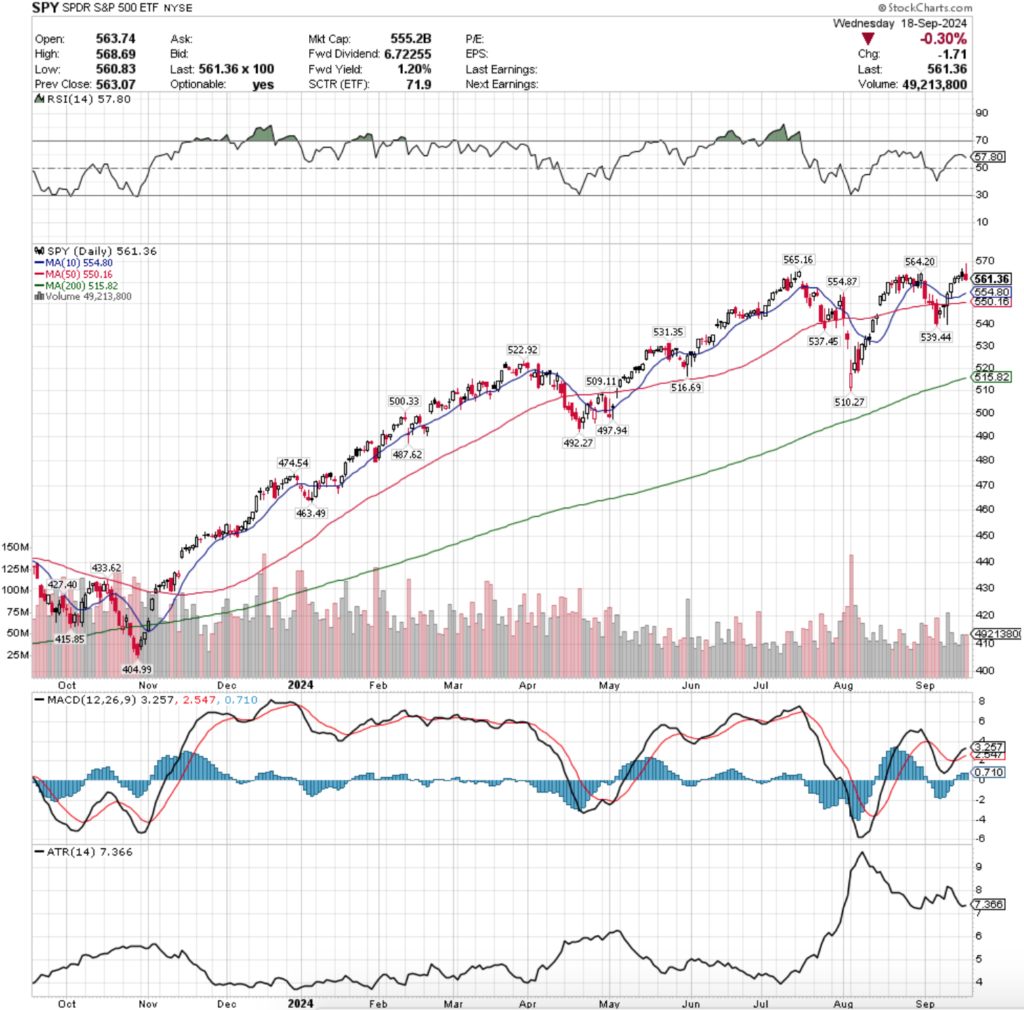
SPY, the SPDR S&P 500 ETF hit an fresh all-time high today despite closing -0.3% yesterday in the wake of the FOMC interest rate announcement.
While recent price movements have been more volatile over the past couple of months it has helped them establish more nearby support levels to their current price than what they had during July’s check-in.
Still though, with the low volumes that we are seeing there is not much reason to celebrate just yet & as a result it is worth having an understanding of the strength of their support levels.
This is especially true as in the event of a 10% correction for SPY their price enters a Seller dominated zone which may possibly lead to further downside movements as support levels are weak in these price zones.
Below is a list of the volume sentiments at each price level SPY has traded at over the past 2-3 years.
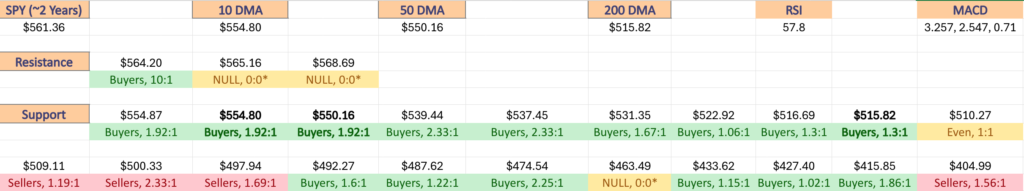
$570 – NULL – 0:0*, +1.54% From Current Price
$565 – NULL – 0:0*, +0.65% From Current Price
$560 – Buyers – 10:1, -0.24% From Current Price – Current Price Level*
$555 – Sellers – 1.25:1, -1.13% From Current Price
$550 – Buyers – 1.92:1, -2.02% From Current Price – 10 & 50 Day Moving Averages**
$545 – Buyers – 1.67:1, -2.91% From Current Price
$540 – Sellers – 1.4:1, -3.81% From Current Price
$535 – Buyers – 2.33:1, -4.7% From Current Price
$530 – Buyers – 1.67:1, -5.59% From Current Price
$525 – Buyers – 5.6:1, -6.48% From Current Price
$520 – Buyers – 1.06:1, -7.37% From Current Price
$515 – Buyers – 1.3:1, -8.26% From Current Price – 200 Day Moving Average*
$510 – Even – 1:1, -9.15% From Current Price
$505 – Sellers – 1.19:1, -10.04% From Current Price
$500 – Sellers – 2.33:1, -11.64% From Current Price
$496 – Sellers – 1.69:1, -12.36% From Current Price
$492 – Buyers – 1.6:1, -12.36% From Current Price
$488 – Buyers – 1.27:1, -13.07% From Current Price
$484 – Buyers – 1.22:1, -13.78% From Current Price
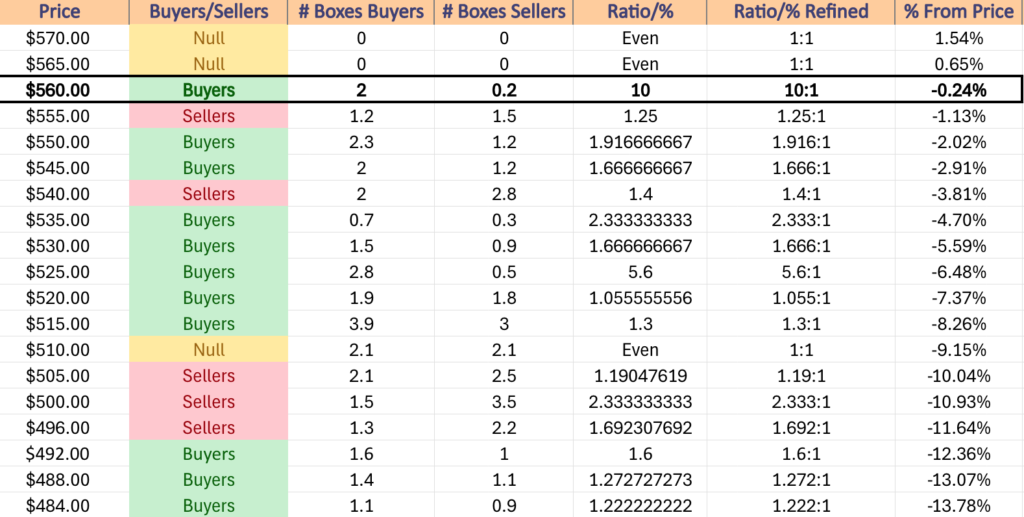
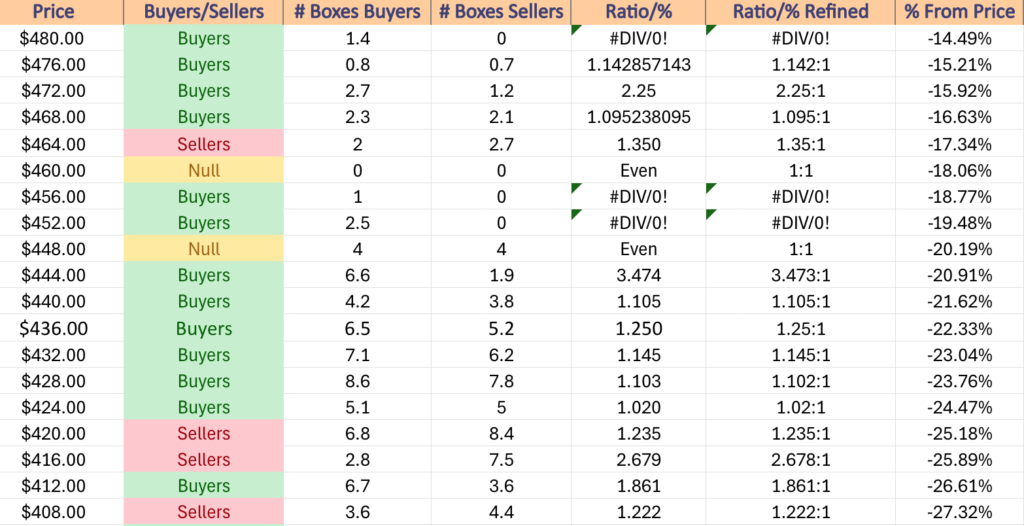
$480 – Buyers – 1.4:0*, -14.49% From Current Price
$476 – Buyers – 1.14:1, -15.21% From Current Price
$472 – Buyers – 2.25:1, -15.92% From Current Price
$468 – Buyers – 1.1:1, -16.63% From Current Price
$464 – Sellers – 1.35:1, -17.34% From Current Price
$460 – NULL – 0:0*, -18.06% From Current Price
$456 – Buyers – 1:0*, -18.77% From Current Price
$452 – Buyers – 2.5:0*, -19.48% From Current Price
$448 – Even – 1:1, -20.19% From Current Price
$444 – Buyers – 3.47:1, -20.91% From Current Price
$440 – Buyers – 1.11:1, -21.62% From Current Price
$436 – Buyers – 1.25:1, -22.33% From Current Price
$432 – Buyers – 1.15:1. -23.04% From Current Price
$428 – Buyers – 1.1:1, -23.76% From Current Price
$424 – Buyers – 1.02:1, -24.47% From Current Price
$420 – Sellers – 1.24:1, -25.18% From Current Price
$416 – Sellers – 2.68:1, -25.89% From Current Price
$412 – Buyers – 1.86:1, -26.61% From Current Price
$408 – Sellers – 1.22:1, -27.32% From Current Price
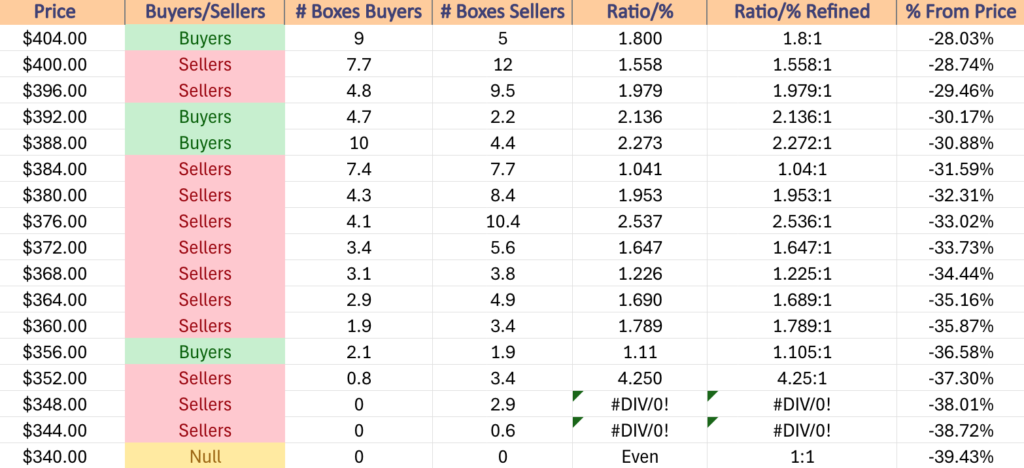
$404 – Buyers – 1.8:1, -28.03% From Current Price
$400 – Sellers – 1.56:1, -28.74% From Current Price
$396 – Sellers – 1.98:1, -29.46% From Current Price
$392 – Buyers – 2.14:1, -30.17% From Current Price
$388 – Buyers – 2.27:1, -30.88% From Current Price
$384 – Sellers – 1.04:1, -31.59% From Current Price
$380 – Sellers – 1.95:1, -32.31% From Current Price
$376 – Sellers – 2.54:1, -33.02% From Current Price
$372 – Sellers – 1.65:1, -33.73% From Current Price
$368 – Sellers – 1.23:1, -34.44% From Current Price
$364 – Sellers – 1.69:1, -35.16% From Current Price
$360 – Sellers – 1.79:1, -35.87% From Current Price
$356 – Buyers – 1.11:1, -36.58% From Current Price
$352 – Sellers – 4.25:1, -37.3% From Current Price
$348 – Sellers – 2.9:0*, -38.01% From Current Price
$344 – Sellers – 0.6:0*, -38.72% From Current Price
$340 – NULL – 0:0*, -39.43% From Current Price
Price Level:Volume Sentiment Analysis For QQQ (NASDAQ 100) ETF
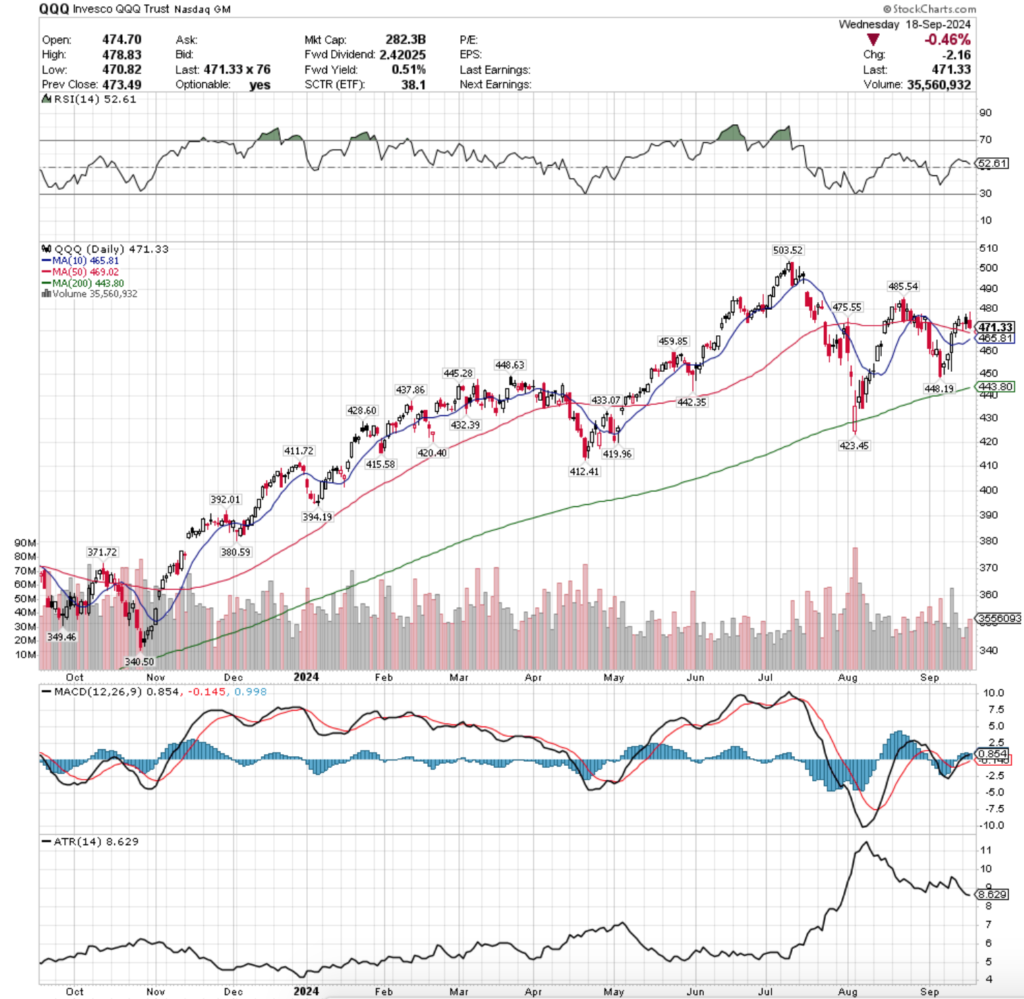
QQQ, the Invesco QQQ Trust ETF that tracks the NASDAQ 100 has begun to show more weakness than SPY after months of trading in similar manners.
While lower interest rates are more beneficial to this tech-heavy index, the size of yesterday’s cut indicates that there may be more weakness in the QQQ index components that in the medium-term may become more apparent compared to their SPY counterparts.
QQQ’s current price level is a seller dominated zone, as is the one directly below it & it is faced with a similar set up in the event of a 10% decline as SPY was noted to have.
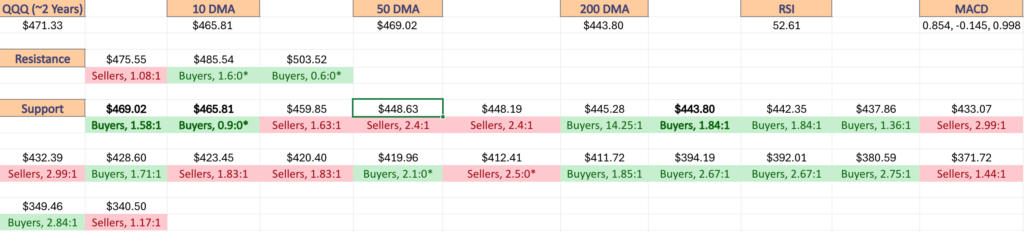
Another item to note on QQQ’s chart is the proximity of price to the three moving averages shown, as a sudden movement downward would cause the price to become wedged in between all three, with the 10 & 50 day moving averages providing resistance from above & moving downwards, while the support of the 200 DMA would be pushing upwards, which may cause increased volatility.
There will be more on that in this weekend’s market review note; below is QQQ’s volume sentiment at each price level it has traded at for the past 2-3 years, as well as their support & resistance levels with the sentiments noted.
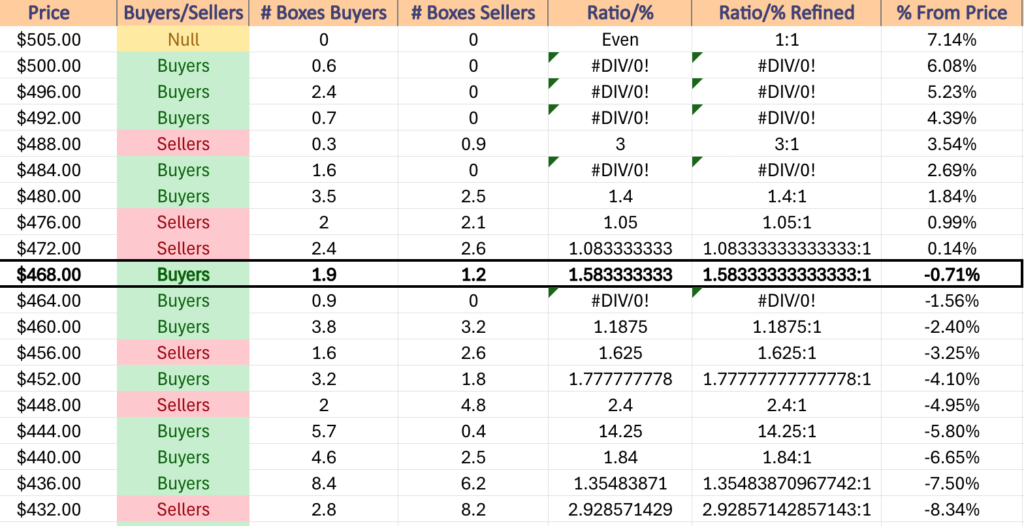
$505 – NULL – 0:0*, +7.14% From Current Price
$500 – Buyers – 0.6:0*, +6.08% From Current Price
$496 – Buyers – 2.4:0*, +5.23% From Current Price
$492 – Buyers – 0.7:0*, +4.39% From Current Price
$488 – Sellers – 3:1, +3.54% From Current Price
$484 – Buyers – 1.6:0*, +2.69% From Current Price
$480 – Buyers – 1.4:1, +1.84% From Current Price
$476 – Sellers – 1.05:1, +0.99% From Current Price
$472 – Sellers – 1.08:1, +0.14% From Current Price
$468 – Buyers – 1.58:1, -0.71% From Current Price – 50 Day Moving Average & Current Price Level**
$464 – Buyers – 0.9:0*, -1.56% From Current Price – 10 day Moving Average*
$460 – Buyers – 1.19:1, -2.4% From Current Price
$456 – Sellers – 1.63:1, -3.25% From Current Price
$452 – Buyers – 1.78:1, -4.1% From Current Price
$448 – Sellers – 2.4:1, -4.95% From Current Price
$444 – Buyers – 14.25:1, -5.8% From Current Price
$440 – Buyers – 1.84:1, -6.65% From Current Price – 200 Day Moving Average*
$436 – Buyers – 1.36:1, -7.5% From Current Price
$432 – Sellers – 2.93:1, -8.34% From Current Price
$428 – Buyers – 1.71:1, -9.19% From Current Price
$424 – Sellers – 1.04:1, -10.04% From Current Price
$420 – Sellers – 1.83:1, -10.89% From Current Price
$416 – Buyers – 2.1:0*, -11.74% From Current Price
$412 – Sellers – 2.5:0*, -12.59% From Current Price
$408 – Buyers – 1.85:1, -13.44% From Current Price
$404 – Buyers – 4.1:1, -14.29% From Current Price
$400 – Sellers – 1.03:1, -15.13% From Current Price
$396 – Buyers – 1.14:1, -15.98% From Current Price
$392 – Buyers – 2.67:1, -16.83% From Current Price
$388 – Buyers – 3.1:0*, -17.68% From Current Price
$384 – Sellers – 1.83:1, -18.53% From Current Price
$380 – Buyers – 2.75:1, -19.38% From Current Price
$376 – Buyers – 3.67:1, -20.23% From Current Price
$372 – Sellers – 1.08:1, -21.07% From Current Price
$368 – Sellers – 1.44:1, -21.92% From Current Price
$364 – Buyers – 1.52:1, -22.77% From Current Price
$360 – Buyers – 1.17:1, -23.62% From Current Price
$356 – Buyers – 1.21:1, -24.47% From Current Price
$352 – Sellers – 1.65:1, -25.32% From Current Price
$348 – Buyers – 2.84:1, -26.17% From Current Price
$344 – Buyers – 1.42:1, -27.02% From Current Price
$340 – Sellers – 1.17:1, -27.86% From Current Price
$336 – Buyers – 1.2:0*, -28.71% From Current Price
$332 – Buyers – 2:1, -29.56% From Current Price
$328 – Sellers – 1.19:1, -30.41% From Current Price
$324 – Buyers – 4.83:1, -31.26% From Current Price
$320 – Buyers – 2.59:1, -32.11% From Current Price
$316 – Buyers – 1.01:1, -32.96% From Current Price
$312 – Sellers – 2.7:1, -33.8% From Current Price
$308 – Buyers – 1.41:1, -34.65% From Current Price
$304 – Buyers – 2.14:1, -35.5% From Current Price
$300 – Sellers – 1.17:1, -36.35% From Current Price
$296 – Buyers – 1.25:1, -37.2% From Current Price
$292 – Buyers – 3.52:1, -38.05% From Current Price
$288 – Sellers – 1.39:1, -38.9% From Current Price
$284 – Even – 1:1, -39.74% From Current Price
$280 – Sellers – 1.3:1, -40.59% From Current Price
$276 – Buyers – 1.18:1, -41.44% From Current Price
$272 – Sellers – 1.85:1, -42.29% From Current Price
$268 – Sellers – 1.14:1, -42.14% From Current Price
$264 – Buyers – 1.04:1, -43.14% From Current Price
$260 – Sellers – 1.9:1, -44.84% From Current Price
$256 – Sellers – 6.4:0*, -45.69% From Current Price
$252 – NULL – 0:0*, -46.53% From Current Price
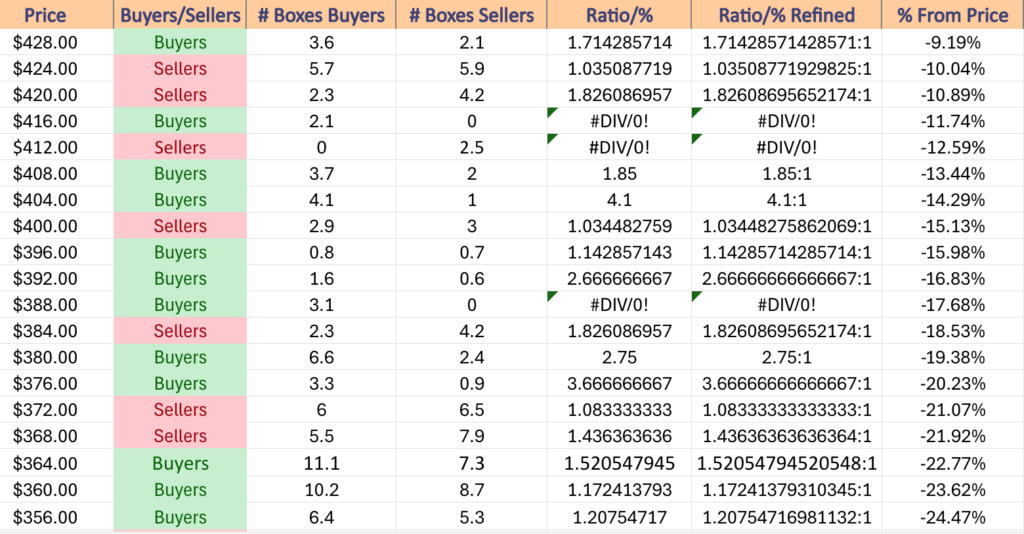
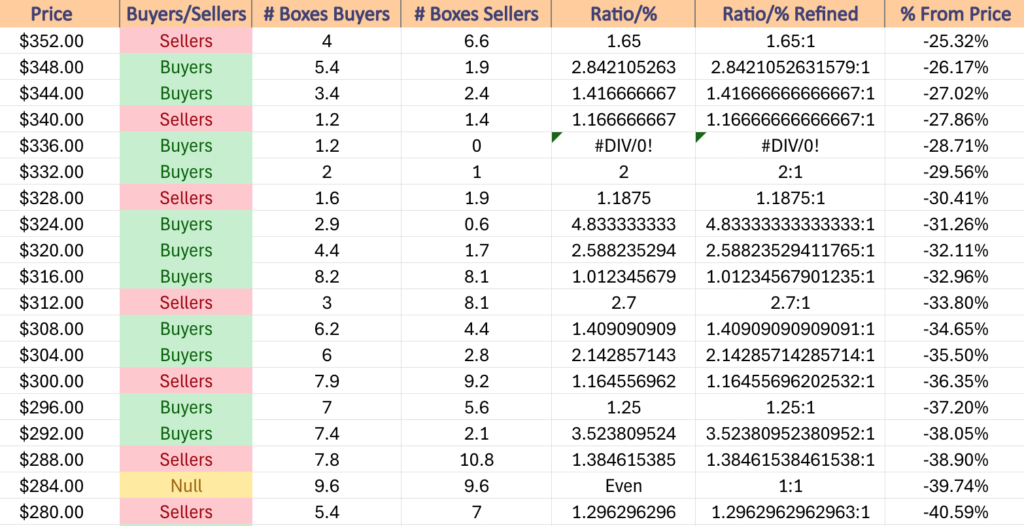
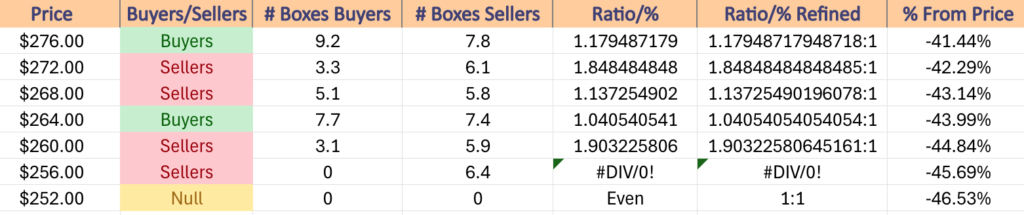
Price Level:Volume Sentiment Analysis For IWM (Russell 2000) ETF
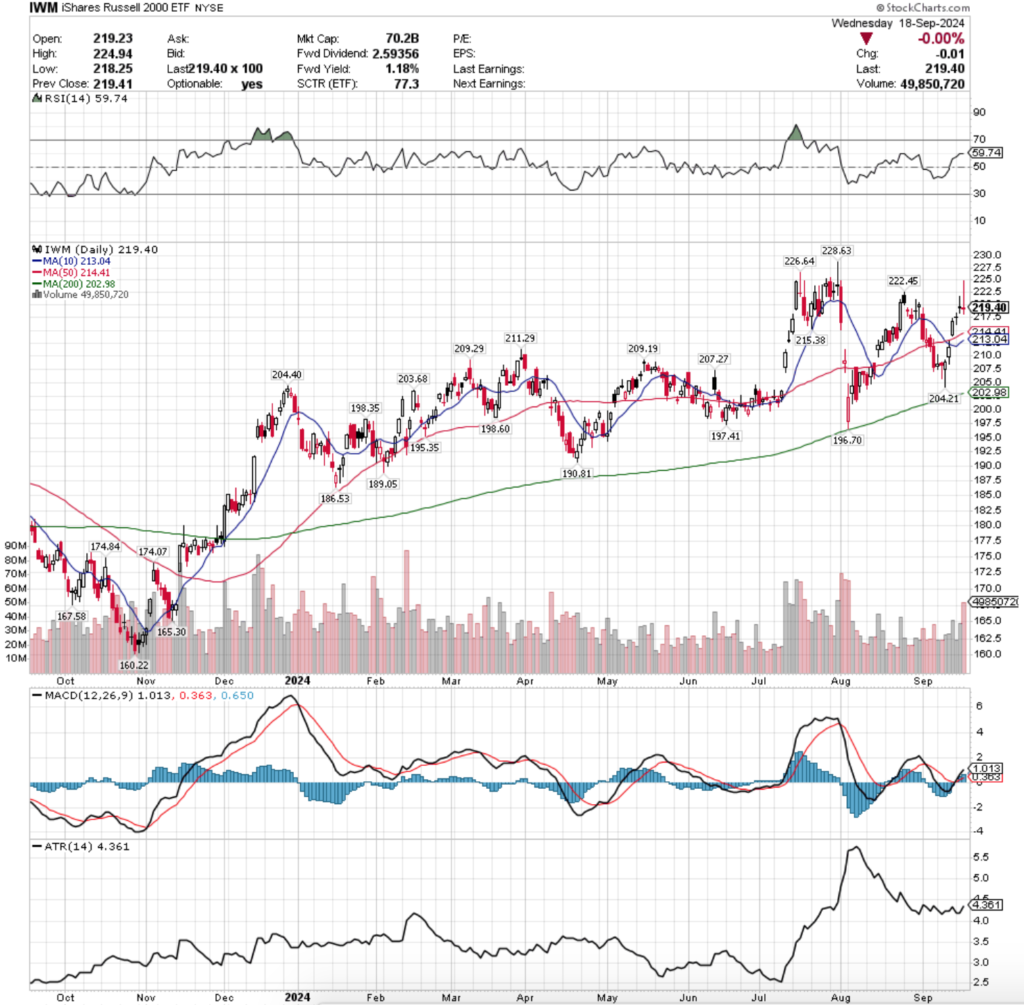
IWM, the iShares Russell 2000 ETF has been unable to retest their 52-week high set just before our last check in in July, but their recent volume levels have jumped compared to the previous handful of months.
This index trades in a much more consolidated range-bound fashion & slowly advances while oscillating around a price range compared to how SPY & QQQ trade, so their list of price levels for the past 2-3 years is shorter than the previous two ETFs.
This is beneficial for them though, as it provides them with more local support levels, which are outlined in the data below.
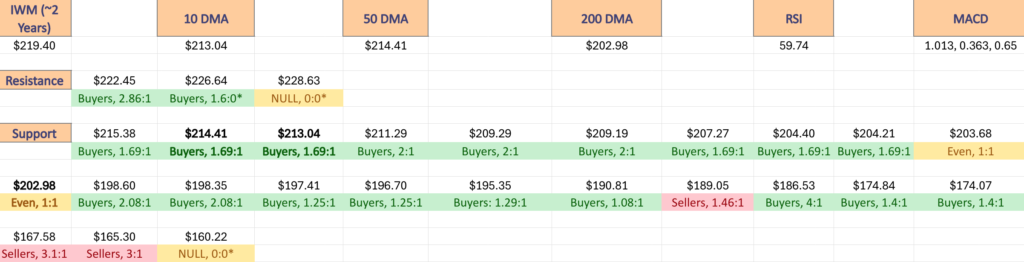
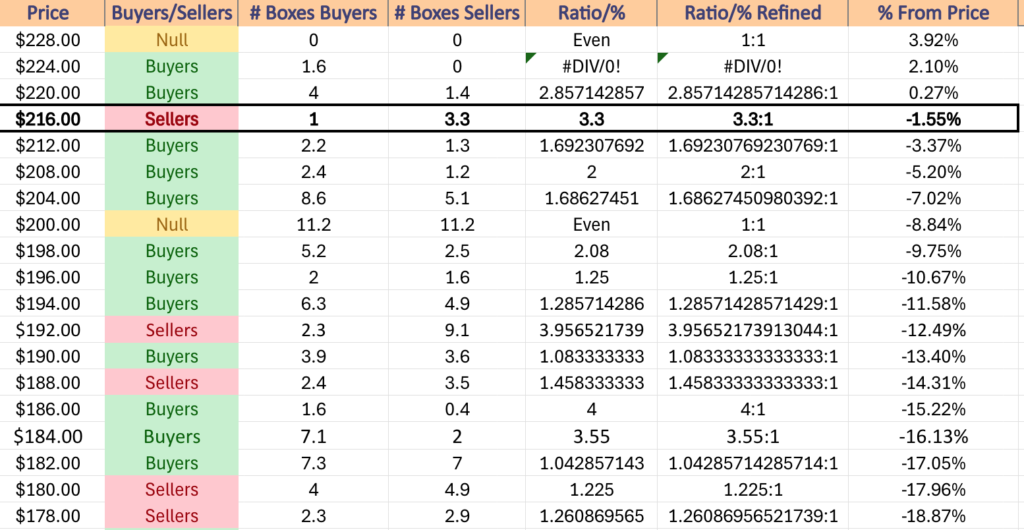
$228 – NULL – 0:0*, +3.92% From Current Price
$224 – Buyers – 1.6:0*, +2.1% From Current Price
$220 – Buyers – 2.86:1, +0.27% From Current Price
$216 – Sellers – 3.3:1, -1.55% From Current Price – Current Price Level*
$212 – Buyers – 1.69:1, -3.37% From Current Price – 10 & 50 Day Moving Averages**
$208 – Buyers – 2:1, -5.2% From Current Price
$204 – Buyers – 1.69:1, -7.02% From Current Price
$200 – Even – 1:1, -8.84% From Current Price – 200 Day Moving Average*
$198 – Buyers – 2.08:1, -9.75% From Current Price
$196 – Buyers – 1.25:1, -10.67% From Current Price
$194 – Buyers – 1.29:1, -11.58% From Current Price
$192 – Sellers – 3.96:1, -12.49% From Current Price
$190 – Buyers – 1.08:1, -13.4% From Current Price
$188 – Sellers – 1.46:1, -14.31% From Current Price
$186 – Buyer – 4:1, -15.22% From Current Price
$184 – Buyers – 3.55:1, -16.13% From Current Price
$182 – Buyers – 1.04:1, -17.05% From Current Price
$180 – Sellers – 1.23:1, -17.96% From Current Price
$178 – Sellers – 1.26:1, -18.87% From Current Price
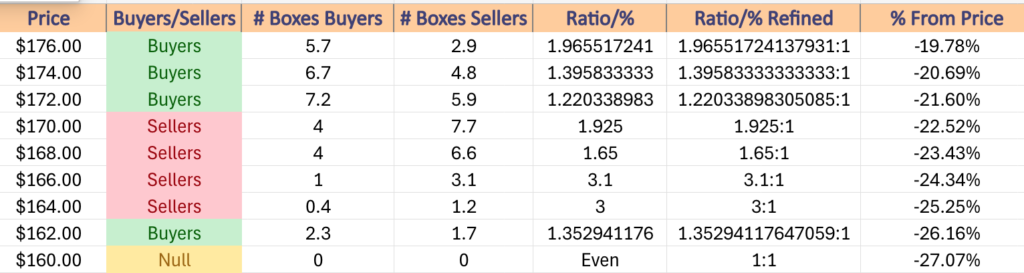
$176 – Buyers – 1.97:1, -19.78% From Current Price
$174 – Buyers – 1.4:1, -20.69% From Current Price
$172 – Buyers – 1.22:1, -21.6% From Current Price
$170 – Sellers – 1.93:1, -22.52% From Current Price
$168 – Sellers – 1.65:1, -23.43% From Current Price
$166 – Sellers – 3.1:1, -24.34% From Current Price
$164 – Sellers – 3:1, -25.25% From Current Price
$162 – Buyers – 1.36:1, -26.16% From Current Price
$160 – NULL – 0:0*, -27.07% From Current Price
Price Level:Volume Sentiment Analysis For DIA (Dow Jones Industrial Average) ETF
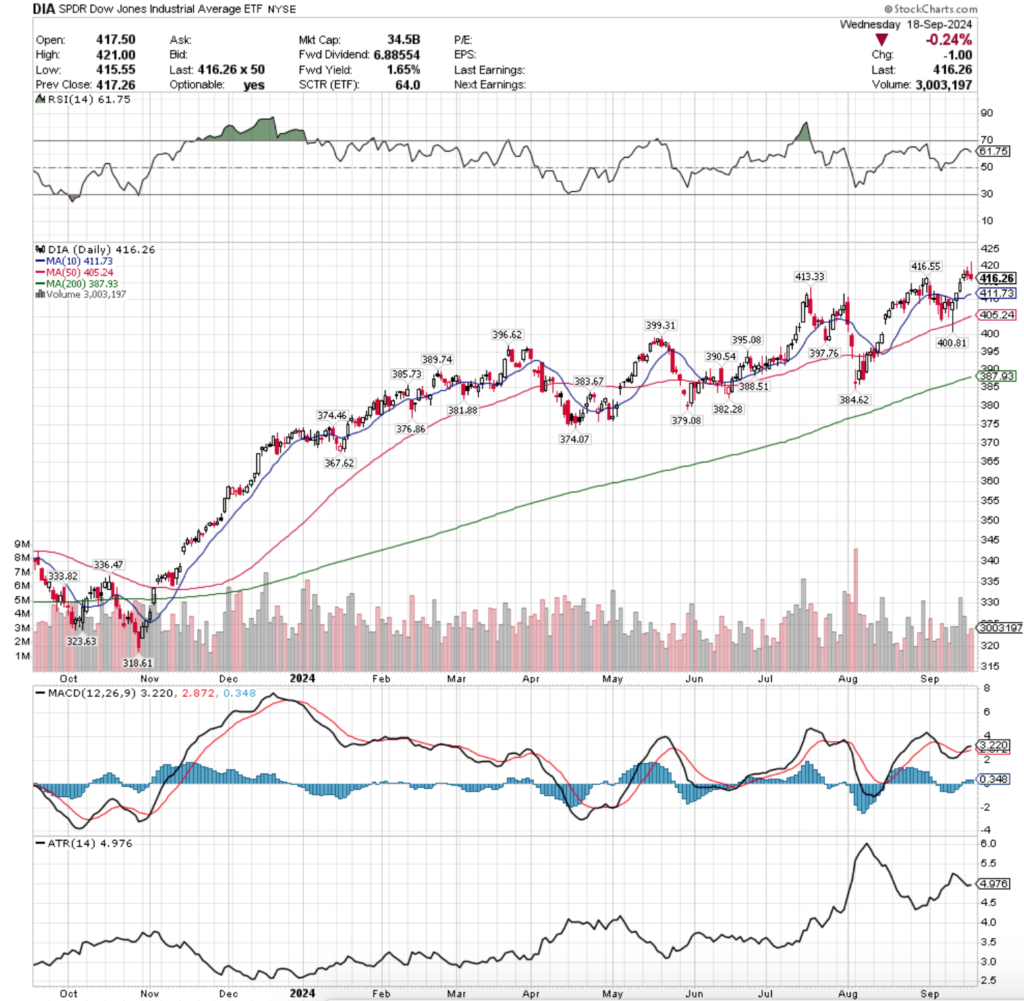
DIA, the SPDR Dow Jones Industrial Average ETF trades in a manner that is more similar to IWM than to SPY or QQQ.
As a result, they too have more local support levels than SPY or QQQ, as the blue chip index tends to be an investor favorite.
This leads them to have a great deal of Buyer support, which in the event of a decline we will see their ratios become more diluted than they are currently in the data below from the past 3-4 years.
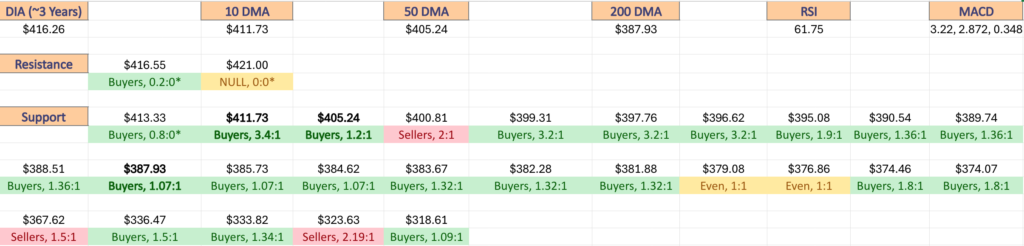
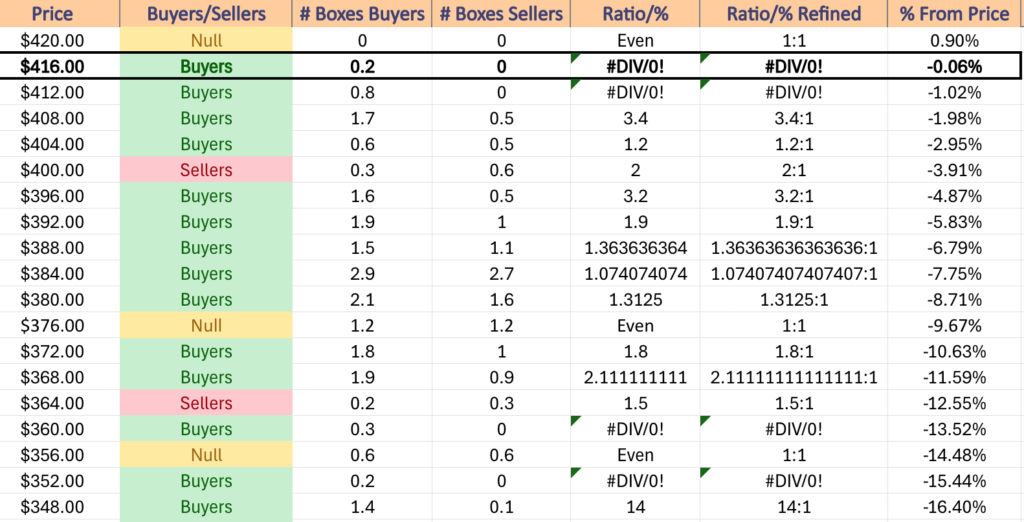
$420 – NULL – 0:0*, +0.9% From Current Price
$416 – Buyers – 0.2:0*, -0.06% From Current Price – Current Price Level*
$412 – Buyers – 0.8:0*, -1.02% From Current Price
$408 – Buyers – 3.4:1, -1.98% From Current Price – 10 Day Moving Average*
$404 – Buyers – 1.2:1, -2.95% From Current Price – 50 Day Moving Average*
$400 – Sellers – 2:1, -3.91% From Current Price
$396 – Buyers – 3.2:1, -4.87% From Current Price
$392 – Buyers – 1.9:1, -5.83% From Current Price
$388 – Buyers – 1.36:1, -6.79% From Current Price
$384 – Buyers – 1.07:1, -7.75% From Current Price – 200 Day Moving Average*
$380 – Buyers – 1.31:1, -8.71% From Current Price
$376 – Even – 1:1, -9.67% From Current Price
$372 – Buyers – 1.8:1, -10.63% From Current Price
$368 – Buyers – 2.11:1, -11.59% From Current Price
$364 – Sellers – 1.5:1, -12.55% From Current Price
$360 – Buyers – 0.3:0*, -13.52% From Current Price
$356 – Even – 1:1, -14.48% From Current Price
$352 – Buyers – 0.2:0*, -15.44% From Current Price
$348 – Buyers – 14:1, -16.4% From Current Price
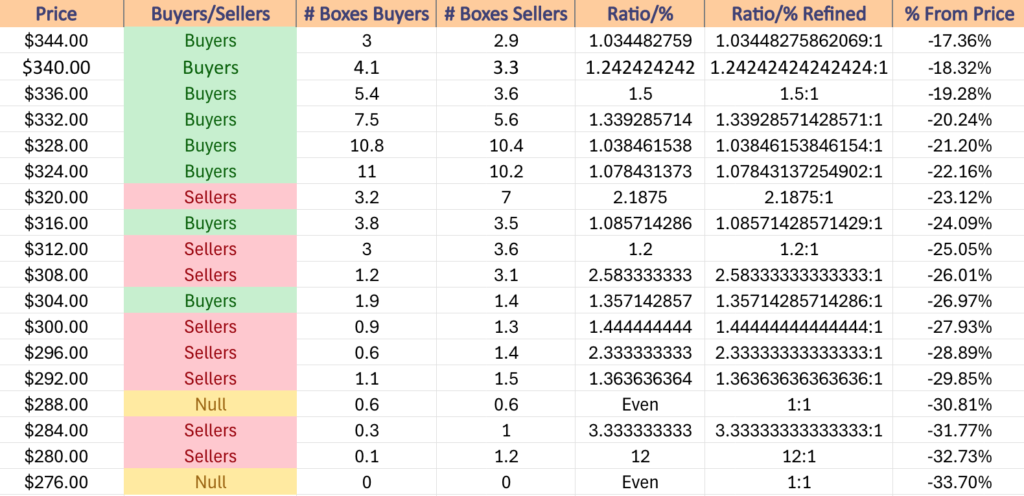
$344 – Buyers – 1.03:1, -17.36% From Current Price
$340 – Buyers – 1.24:1, -18.32% From Current Price
$336 – Buyers – 1.5:1, -19.28% From Current Price
$332 – Buyers – 1.34:1, -20.24% From Current Price
$328 – Buyers – 1.04:1, -21.2% From Current Price
$324 – Buyers – 1.08:1, -22.16% From Current Price
$320 – Sellers – 2.19:1, -23.12% From Current Price
$316 – Buyers – 1.09:1, -24.09% From Current Price
$312 – Sellers – 1.2:1, -25.05% From Current Price
$308 – Sellers – 2.58:1, -26.01% From Current Price
$304 – Buyers – 1.36:1, -26.97% From Current Price
$300 – Sellers – 1.44:1, -27.93% From Current Price
$296 – Sellers – 2.33:1, -28.89% From Current Price
$292 – Sellers – 1.36:1, -29.85% From Current Price
$288 – Even – 1:1, -30.81% From Current Price
$284 – Sellers – 3.33:1, -31.77% From Current Price
$280 – Sellers – 12:1, -32.73% From Current Price
$276 – NULL – 0:0*, -33.7% From Current Price
*** I DO NOT OWN SHARES OR OPTIONS CONTRACT POSITIONS IN SPY, QQQ, IWM OR DIA AT THE TIME OF PUBLISHING THIS ARTICLE ***