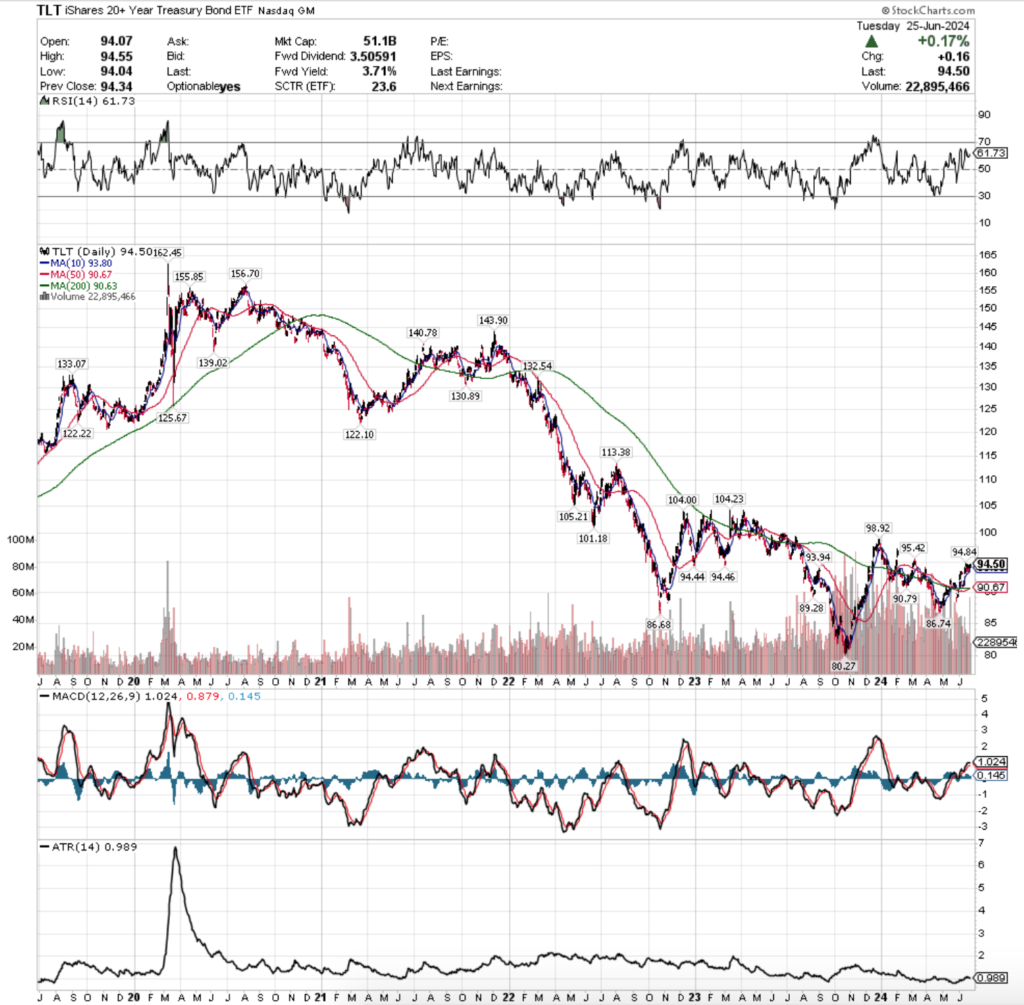
TLT, the iShares 20+ Year Treasury Bond ETF has fallen -6.19% over the past year, declining -10.13% from their 52-week high in June of 2023, but has advanced +13.35% since their 52-week low in October of 2023.
Much like the major index ETFs, TLT has recently experienced weak volumes, with the past week’s volume coming in -31.52% below average compared to the year prior (27,273,649 vs. 39,832,402.55).
With markets near all-time highs but looking set to cool off there has been a lot of talk recently about bonds, making it worth diving into the strength of TLT’s support & resistance levels.
This will provide an understanding about how investors have previously behaved when TLT was at these pivotal price points & may shed insight into how their future behavior may play out if these levels are revisited.
Below is a brief review of TLT’s recent technical performance, followed by the volume sentiments for each of the price levels that they have traded at over the past 4-5 years.
It is not intended to serve as financial advice, but rather as an additional tool to reference while performing your own due diligence into TLT.
Technical Analysis Of TLT, the iShares 20+ Year Treasury Bond ETF
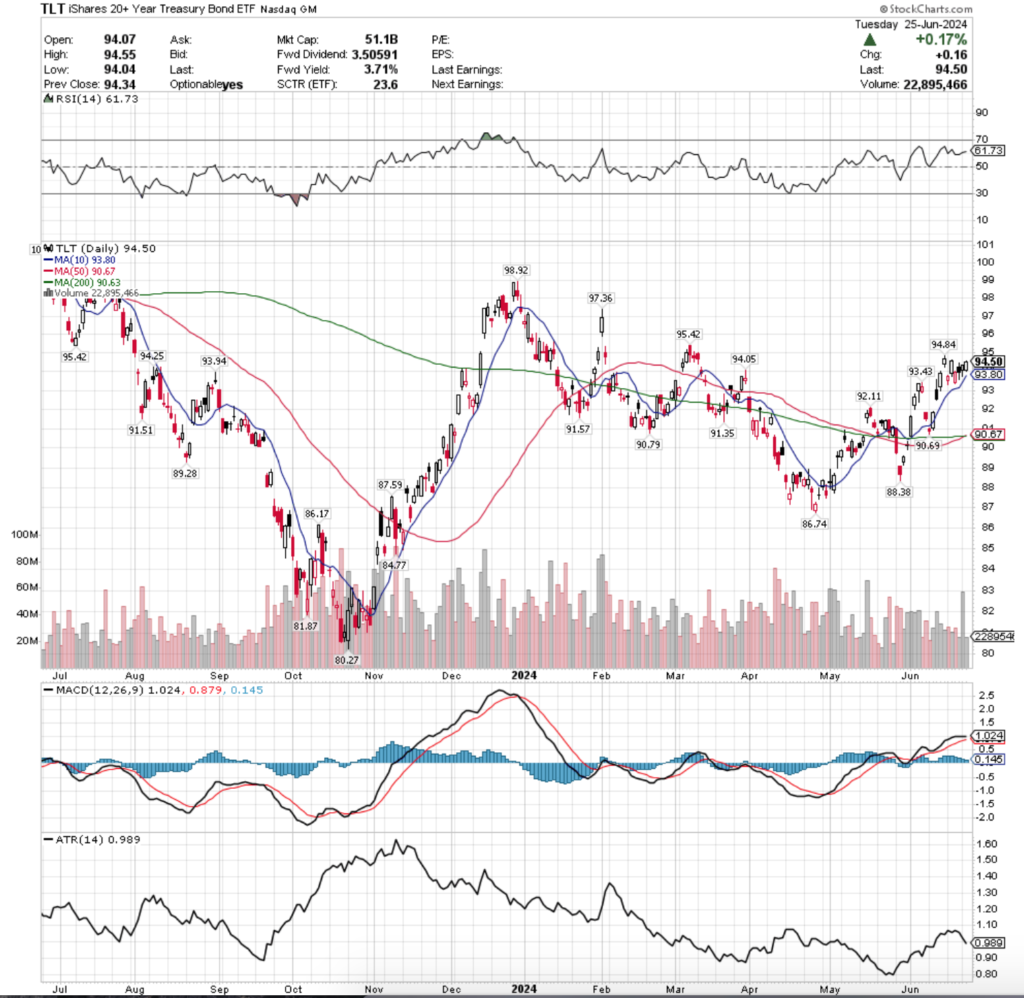
Their RSI is currently above neutral & trending towards overbought levels at 61.73, while their MACD is signaling a near-term cooling off as it looks to cross over bearishly in the next day or two.
As highlighted above, volumes recently have been lacking compared to the previous year, particularly yesterday’s & much of May’s as well.
Their share price has been attempting to rebound following a decline from the end of 2023, which is concerning given that the primary reversal of that downtrend occurred at the end of April, meaning that much of the recovery attempt has happened on the weak volume mentioned above.
Last Monday’s session resulted in a gap down that set up the resulting consolidation range that TLT has been trading in for the past week & a half, with last Tuesday’s session’s high price still being the high water mark that has yet to be broken (using last night’s closing price).
Thursday’s session signaled that there is still a great deal of excess supply, as it declined on a gap down open, but was able to recover to around Tuesday’s opening price.
It should be noted that the two declining sessions had the second & third highest volumes of the past week & a half, with only this past Monday’s being higher.
Friday kicked off on a gap higher & showed that there was some interest to the upside, but ultimately the bears came out stronger & forced prices down towards the 10 day moving average & ultimately settled lower than the open & at $93.96, where it also closed the previous day.
Monday’s open was slightly above Friday’s close, dipped lower, but the 10 DMA’s support proved to be stable & was able to prop prices higher to close the day as an advancing session.
Monday’s high volume indicate that there is still strong belief in the 10 DMA, but given that it occurred in the wake of a somewhat risk-off Friday to kick off a new week it should be viewed skeptically, particularly as it occurred as a golden cross was forming, as the 50 DMA crossed the 200 DMA bullishly.
Yesterday’s session advanced, but the light volume is not convincing in terms of near-term strength, particularly when you factor in that it was unable to break above the recent high set on Tuesday of the week before.
Their Average True Range has been declining over the past couple of weeks, but should be expected to uptick in the near-term as other indicators are signaling that there is volatility on the horizon.
Fortunately for TLT there are many support touch-points nearby due to the consolidation of H1 2024 & August of 2023 which should help in declines, but there still looks to be some near-term declines on the horizon.
Below is a list of the price levels that TLT has traded at over the past 4-5 years, as well as the ratios of Buyers:Sellers (or Sellers:Buyers) from that time period, as well as a 5 year chart of their price action to reference while reviewing the data.
Pairing the two resources, as well as the near-term outlook just described may prove beneficial in assessing TLT’s price behavior as it encounters support & resistance levels in the near-term, but it should not replace your existing due diligence strategy.
TLT, The iShares 20+ Year Treasury Bond ETF’s Price Level:Volume Sentiment Broken Down
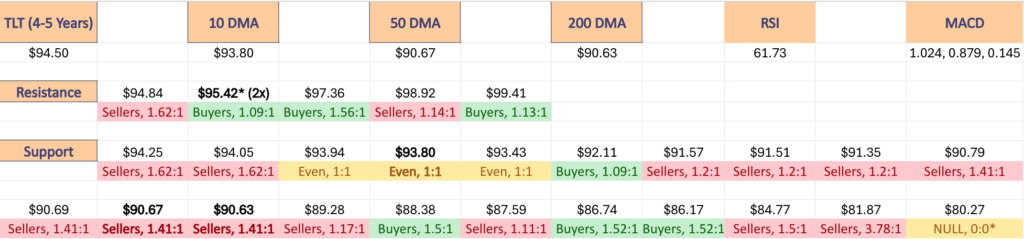
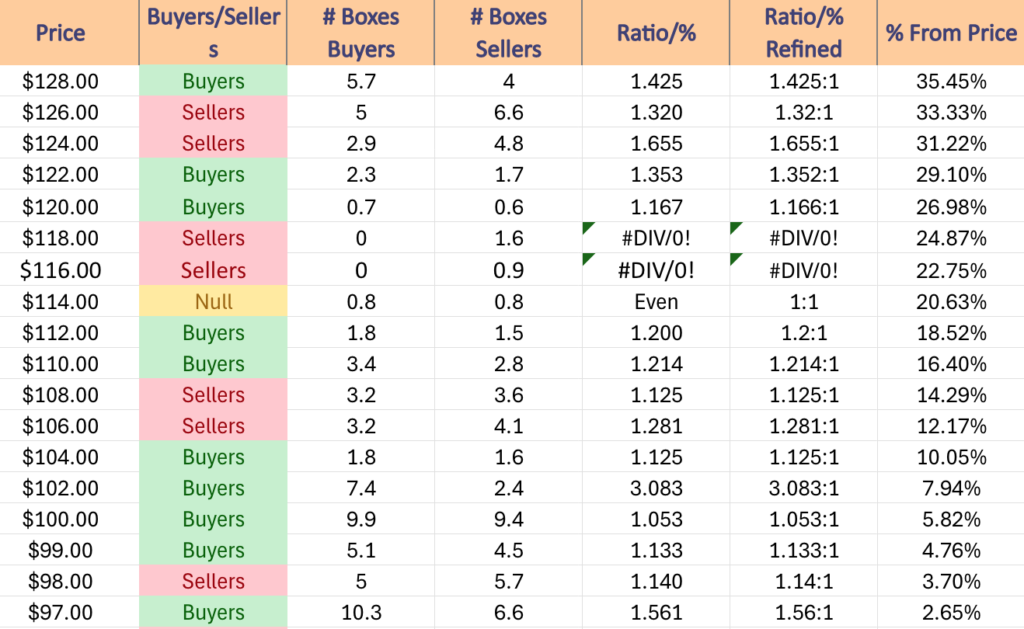
The top table below shows the support & resistance levels of TLT stock from the past year’s chart, as well as their price level:volume sentiment at each, using Friday’s closing price.
The moving averages are denoted with bold.
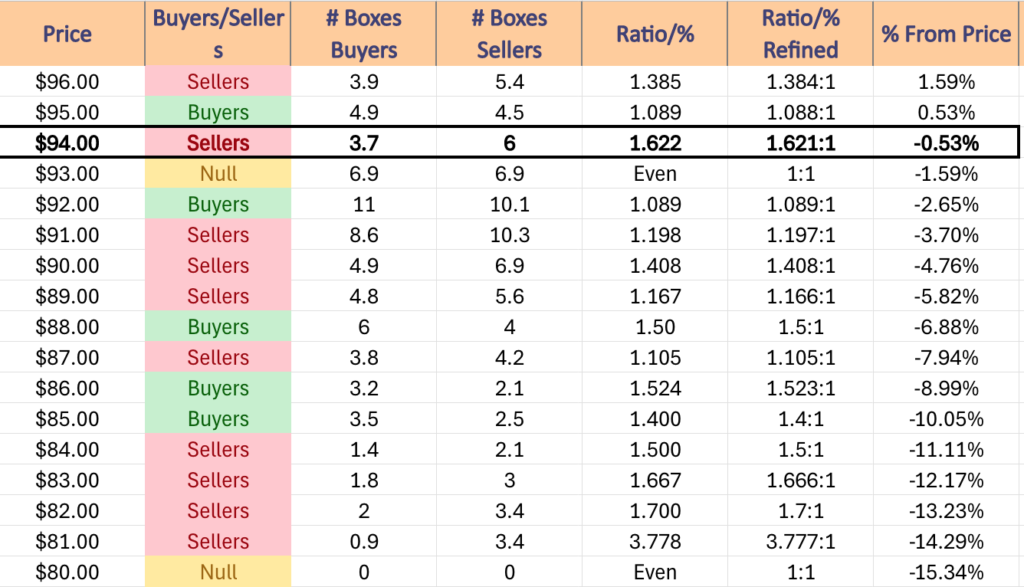
The next charts show the volume sentiment at each individual price level TLT has traded at over the past ~4-5 years.
Beneath them is a copy & pasteable list of the same data, where the support/resistance levels are denoted in bold.
All ratios with “0” in the denominator are denoted with a “*”.
NULL values are price levels that had limited trading volume, whether it be due to gaps, quick advances or they are at price extremes; in the event that they are retested & there is more data they would have a distinct “Buyers”, “Sellers” or “Even” title.
This is not intended as financial advice, but rather another tool to consider when performing your own research & due diligence on TLT stock.
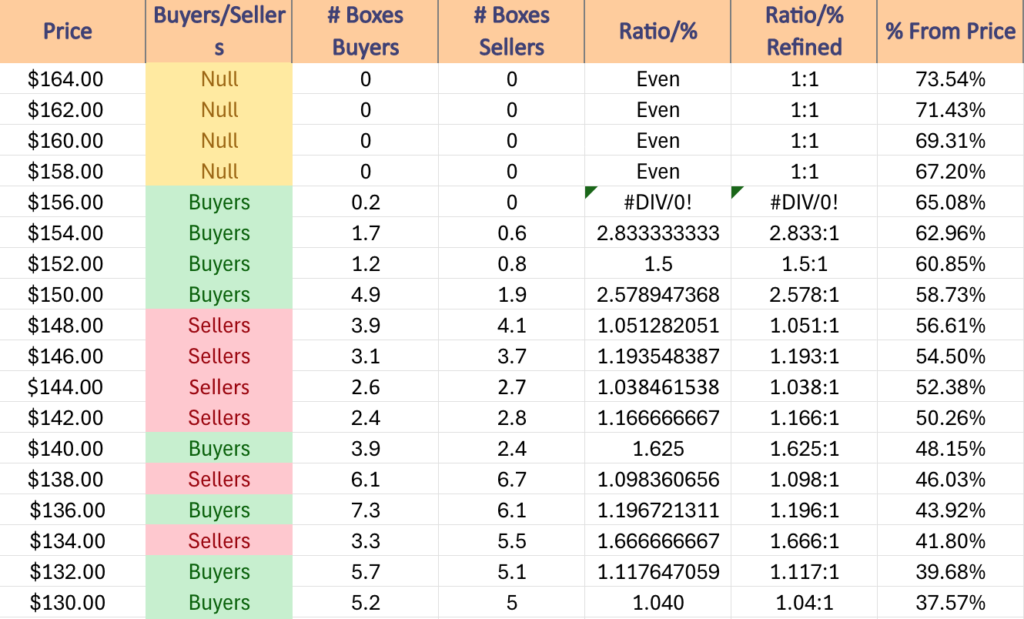
$164 – NULL – 0:0*, +73.54% From Current Price
$162 – NULL – 0:0*, +71.43% From Current Price
$160 – NULL – 0:0*, +69.31% From Current Price
$158 – NULL – 0:0*, +67.2% From Current Price
$156 – Buyers – 0.2:0*, +65.08% From Current Price
$154 – Buyers – 2.83:1, +62.96% From Current Price
$152 – Buyers – 1.5:1, +60.85% From Current Price
$150 – Buyers – 2.58:1, +58.73% From Current Price
$148 – Sellers – 1.05:1, +56.61% From Current Price
$146 – Sellers – 1.19:1, +54.5% From Current Price
$144 – Sellers – 1.04:1, +52.38% From Current Price
$142 – Sellers – 1.17:1, +50.26% From Current Price
$140 – Buyers – 1.63:1, +48.15% From Current Price
$138 – Sellers – 1.1:1, +46.03% From Current Price
$136 – Buyer s- 1.2:1, +43.92% From Current Price
$134 – Sellers – 1.67:1, +41.8% From Current Price
$132 – Buyers – 1.12:1, +39.68% From Current Price
$130 – Buyers – 1.04:1, +37.57% From Current Price
$128 – Buyers – 1.43:1, +35.45% From Current Price
$126 – Sellers – 1.32:1, +33.33% From Current Price
$124 – Sellers – 1.66:1, +31.22% From Current Price
$122 – Buyers – 1.35:1, +29.1% From Current Price
$120 – Buyers – 1.17:1, +26.98% From Current Price
$118 – Sellers – 1.6:0*, +24.87% From Current Price
$116 – Sellers – 0.9:0*, +22.75% From Current Price
$114 – Even – 1:1, +20.63% From Current Price
$112 – Buyers – 1.2:1, +18.52% From Current Price
$110 – Buyers – 1.21:1, +16.4% From Current Price
$108 – Sellers – 1.13:1, +14.29% From Current Price
$106 – Sellers – 1.28:1, +12.17% From Current Price
$104 – Buyers – 1.13:1, +10.05% From Current Price
$102 – Buyers – 3.08:1, +7.94% From Current Price
$100 – Buyers – 1.05:1, +5.82% From Current Price
$99 – Buyers – 1.13:1, +4.76% From Current Price
$98 – Sellers – 1.14:1, +3.7% From Current Price
$97 – Buyers – 1.56:1, +2.65% From Current Price
$96 – Sellers – 1.38:1, +1.59% From Current Price
$95 – Buyers – 1.09:1, +0.53% From Current Price – 2 Touch-Points At Same Price*
$94 – Sellers – 1.62:1, -0.53% From Current Price – Current Price Box*
$93 – Even – 1:1, -1.59% From Current Price – 10 Day Moving Average*
$92 – Buyers – 1.09:1, -2.65% From Current Price
$91 – Sellers – 1.2:1, -3.7% From Current Price
$90 – Sellers – 1.41:1, -4.76% From Current Price – 50 & 200 Day Moving Averages**
$89 – Sellers – 1.17:1, -5.82% From Current Price
$88 – Buyers – 1.5:1, -6.88% From Current Price
$87 – Sellers – 1.11:1, -7.94% From Current Price
$86 – Buyers – 1.52:1, -8.99% From Current Price
$85 – Buyers – 1.4:1, -10.05% From Current Price
$84 – Sellers – 1.5:1, -11.11% From Current Price
$83 – Sellers – 1.67:1, -12.17% From Current Price
$82 – Sellers – 1.7:1, -13.23% From Current Price
$81 – Sellers – 3.78:1, -14.29% From Current Price
$80 – NULL – 0:0*, -15.34% From Current Price
*** I DO NOT OWN SHARES OR OPTIONS CONTRACT POSITIONS IN TLT AT THE TIME OF PUBLISHING THIS ARTICLE ***