URA, the Global X Uranium ETF has had a strong past year, advancing +47.72% (ex-distributions & using Tuesday 7/16/2024’s closing price & the adjusted closing price of 7/17/2023*).
Though they’ve fallen -9.54% since their 52-week high set on 5/20/2024, they’ve gained +42.22% since their 52-week low which occurred on 8/2/2023*.
With the acknowledgement that data centers & artificial intelligence are going to require more energy than what the U.S. currently has the capabilities of supplying, the conversation has begun to shift towards nuclear power as a solution.
For comparison on the power needs, current estimates state that a single data center uses the electricity equivalent of 50,000 homes.
An article I was reading the other day mentioned that Alphabet, Amazon & Microsoft have ~5,400 data centers, of which 600 are in full use.
That energy requirement comes out to ~30M homes worth of electricity, which is ~8x the number of houses in New Jersey (3.7M units, per NJLM), and it’s still only using 11% of the total number of data centers listed for those three companies.
Should this force more nuclear power generation there will be a greater demand for Uranium, making URA a prime candidate for investors to look at.
In addition to the exposure to the nuclear play, URA also has great international diversification, with only one of its top ten holdings being a US listed company (UEC, Uranium Energy Corp.).
While markets hover near all-time & 52-week highs as earnings season kicks off & market participants await a September FOMC interest rate announcement, there may be some volatility to present a more favorable entry to a position in URA.
It should be noted that URA pays a 5.75% distribution yield which can serve as a cushion for long-term holders in the event of a decline.
Below is a brief technical analysis of URA’s recent performance, as well as a breakdown of URA’s volume sentiment at the price levels it has traded at over the past 3-4 years.
It is not intended to serve as financial advice, but rather as an additional tool to reference while performing your own due diligence into URA.
* On 7/17/2023 URA closed at $21.879, but their adjusted close for this day was $20.61, which is why their overall annual quoted growth figure is larger than their 52-week low comparison, which is using the lowest of their quoted Low prices for the past year
Technical Analysis Of URA, The Global X Uranium ETF
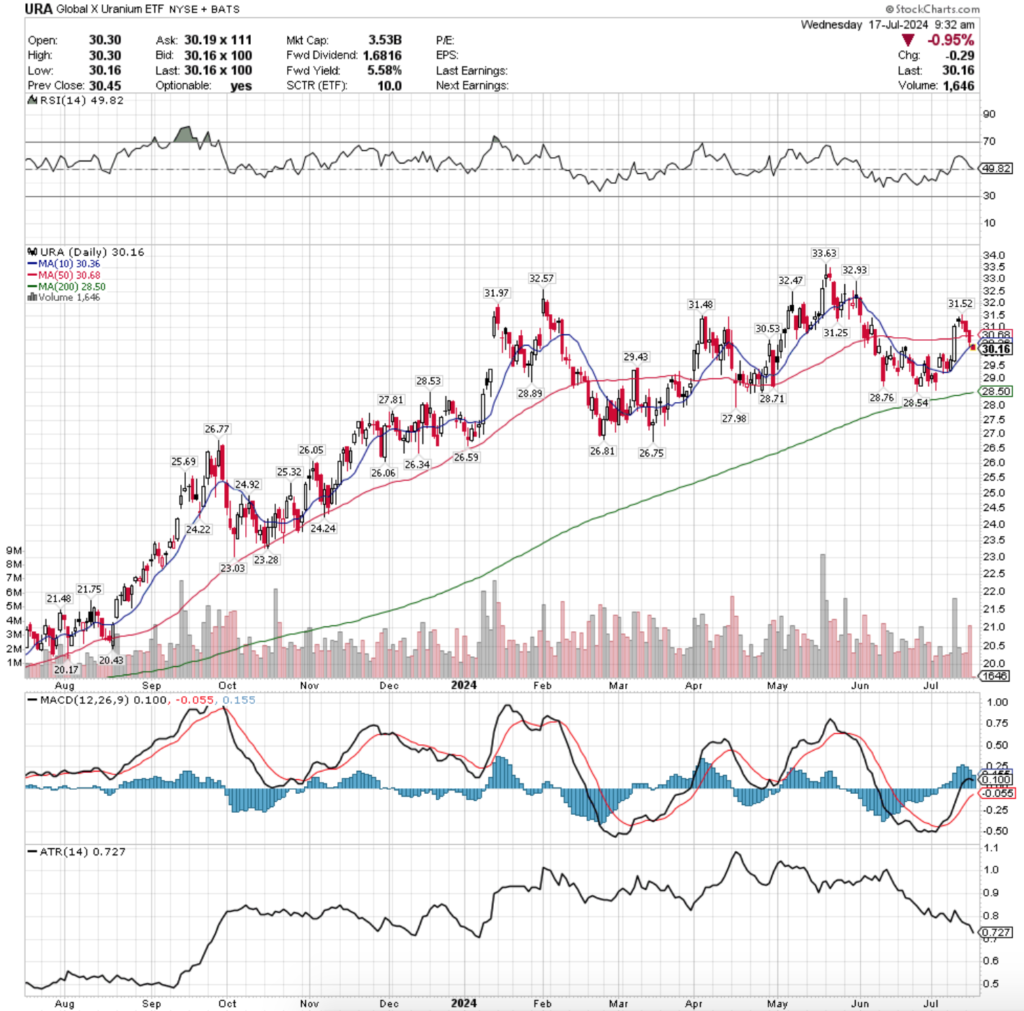
Their RSI is currently just below the neutral mark of 50 & sits currently at 49.82, while their MACD is bullish but signaling signs of weakness & like there is an impending bearish crossover in the coming days.
Over the past week & a half (excluding today, 7/17/2024) volumes have been -0.37% below the prior year’s average (2,642,300 vs. 2,652,048.81), most notably helped by a high volume bullish session on last Wednesday & yesterday’s above average bearish session.
Volumes as a whole have been lower than average for the better part of the last ten weeks as indicated by the major four index ETFs (SPY, QQQ, IWM & DIA).
Last week kicked off on a bearish note Monday, but the 10 day moving average was able to provide support & led to a bullish Tuesday & Wednesday.
Wednesday’s session advanced +4.4% day-over-day, breaking through the resistance of the 50 day moving average on the highest volume seen in two months, but things began to fall apart from there.
Thursday sent out an ominous message, as the session opened on a gap up, tested slightly higher, before resulting in a hanging man candle (bearish) that closed lower than it opened (also bearish).
As Thursday implied, the sentiment was risk off going into the weekend, with a touch of uncertainty as a high wave spinning top candle marked the close of the declining session with light volume.
This week opened up to profit taking on Monday, where there was slightly more volume than Friday but it was still subdued.
Yesterday (Tuesday, 7/16/2024) was where actual trouble began to show, as URA declined below the support of the 50 day moving average & continued lower to test the 10 DMA’s support with its lower shadow, closing just above it.
Yesterday’s volumes were the second highest of the past week & a half & show that there mood appears to have currently soured on URA for the near-term.
This morning that theme continued as prices opened around the 10 DMA & quickly drifted lower.
URA’s Average True Range has been declining since the beginning of July, but should begin to climb if this volatility continues into the near-term.
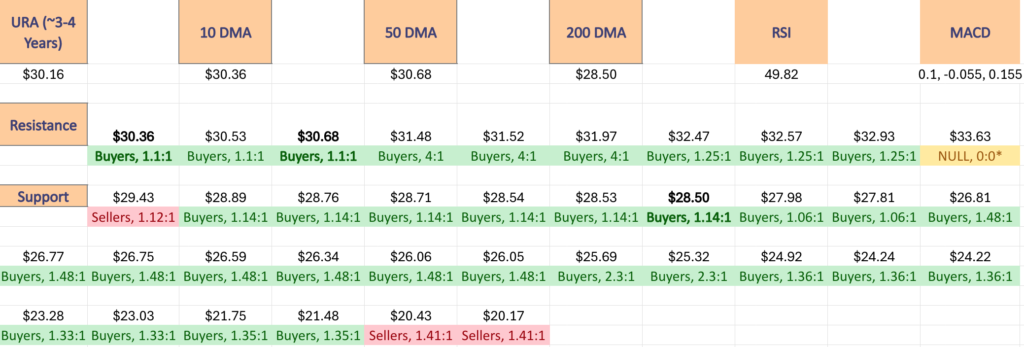
The good news is that in the event that the declines do continue on, URA has one support touch-point in the $29-29.99/share range, and a cluster of support from $28.50 (200 Day Moving Average) to $28.99/share.
The $29-29.99/share range is currently dominated by Sellers over the past 3-4 years at a ratio of 1.12:1, but the $28-28.99/share range has seen Buyers besting the sellers at a ratio of 1.14:1 in that time period, which should add strength to the support zone.
The data below can be used to help assess the strength of support & resistance levels for URA in the future, along with whatever other indicators, oscillators & market data that you prefer to use in your due diligence.
Price Level:Volume Sentiment Analysis Of URA, The Global X Uranium ETF
The top table below shows the support & resistance levels of XLK ETF from the past year’s chart, as well as their price level:volume sentiment at each, using Monday’s closing price.
The moving averages are denoted with bold.
The next charts show the volume sentiment at each individual price level URA has traded at over the past ~3-4 years.
Beneath them is a copy & pasteable list of the same data, where the support/resistance levels are denoted in bold.
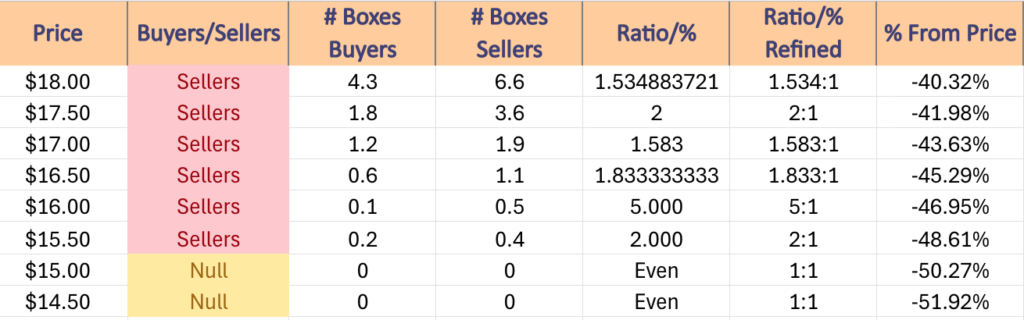
All ratios with “0” in the denominator are denoted with a “*”.
NULL values are price levels that had limited trading volume, whether it be due to gaps, quick advances or they are at price extremes; in the event that they are retested & there is more data they would have a distinct “Buyers”, “Sellers” or “Even” title.
This is not intended as financial advice, but rather another tool to consider when performing your own research & due diligence on URA ETF or any of its components.
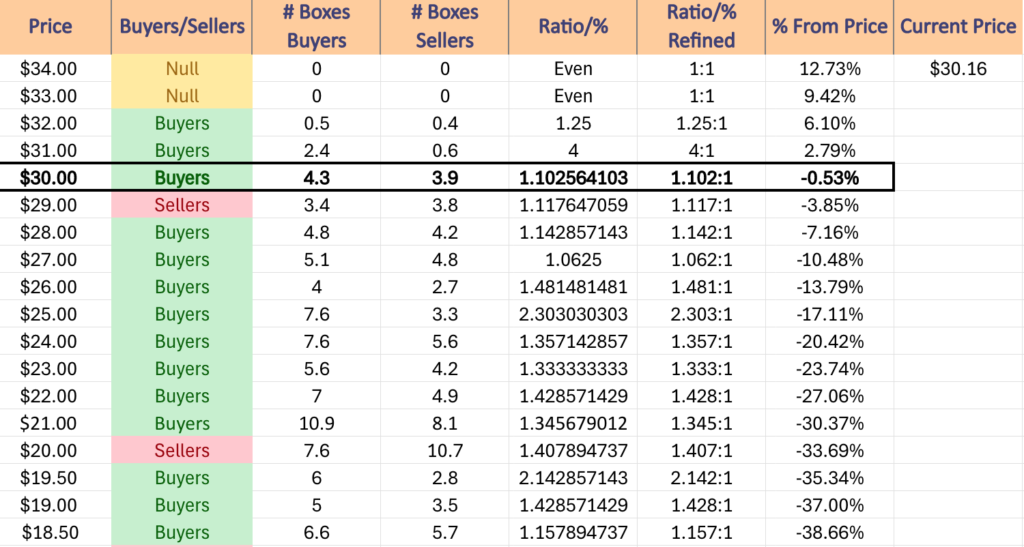
URA ETF’S Price Level:Volume Sentiment Over The Past 3-4 Years
$34 – NULL – 0:0*, +12.73% From Current Price Level
$33 – NULL – 0:0*, +9.42% From Current Price Level
$32 – Buyers – 1.25:1, +6.1% From Current Price Level
$31 – Buyers – 4:1, +2.79% From Current Price Level
$30 – Buyers – 1.1:1, -0.53% From Current Price Level – CURRENT PRICE BOX & 10 & 50 DAY MOVING AVERAGES**
$29 – Sellers – 1.12:1, -3.85% From Current Price Level
$28 – Buyers – 1.14:1, -7.16% From Current Price Level – 200 Day Moving Average*
$27 – Buyers – 1.06:1, -10.48% From Current Price Level
$26 – Buyers – 1.48:1, -13.79% From Current Price Level
$25 – Buyers – 2.3:1, -17.11% From Current Price Level
$24 – Buyers – 1.36:1, -20.42% From Current Price Level
$23 – Buyers – 1.33:1, -23.74% From Current Price Level
$22 – Buyers – 1.43:1, -27.06% From Current Price Level
$21 – Buyers – 1.35:1, -30.37% From Current Price Level
$20 – Sellers – 1.41:1, -33.69% From Current Price Level
$19.50 – Buyers – 2.14:1, -35.34% From Current Price Level
$19 – Buyers – 1.43:1, -37% From Current Price Level
$18.50 – Buyers – 1.16:1, -38.66% From Current Price Level
$18 – Sellers – 1.53:1, -40.32% From Current Price Level
$17.50 – Sellers – 2:1, -41.98% From Current Price Level
$17 – Sellers – 1.58:1, -43.63% From Current Price Level
$16.50 – Sellers – 1.83:1, -45.29% From Current Price Level
$16 – Sellers – 5:1, -46.95% From Current Price Level
$15.50 – Sellers – 2:1, -48.61% From Current Price Level
$15 – NULL – 0:0*, -50.27% From Current Price Level
$14.50 – NULL – 0:0*, -51.92% From Current Price Level
*** I DO NOT OWN SHARES OR OPTIONS CONTRACT POSITIONS IN URA AT THE TIME OF PUBLISHING THIS ARTICLE ***