XLF, the Financial Select Sector SPDR Fund ETF has had a solid year, gaining +27.24% over the past year & +30.83% since their 52-week low in January of 2024, while sitting -6.35% below their 52-week high set in November of 2024 (all figures ex-distributions).
This is attributed to the strong performance among the financial sector over the past year, as banks for the most part have had a great year up until the past month.
Some of their biggest holdings include Berkshire Hathaway Inc CL B (BRK/B), JP Morgan Chase & Co. (JPM), Visa Inc Class A Shares (V), Mastercard Inc Class A (MA), Bank of America Corp. (BAC), Wells Fargo & Co. (WFC), Goldman Sachs Group Inc. (GS), American Express Co (AMEX), Morgan Stanley (MS) & S&P Global Inc. (SPGI).
Since early December there has been a bit of weakness showing in the financial sector, and with earnings season kicking off next week for many of the banks it is worth examining how market participants have behaved previously at different price levels.
This can be beneficial for understanding & assessing the strength of support/resistance levels that may be tested in the coming weeks as these companies begin to report earnings, as well as for when other companies across other sectors report as well.
Below is a brief technical analysis of XLF, as well as a price level:volume sentiment analysis of the price levels XLF has traded at over the ~16 years.
Included in this data is also their recent support & resistance levels so that readers can gain insight into how strong/weak these support/resistance levels may be in the future, based on past investor behavior.
It is not intended to serve as financial advice, but rather as an additional tool to reference while performing your own due diligence on XLF.
XLF, The Financial Select Sector SPDR Fund ETF’s Technical Performance Broken Down
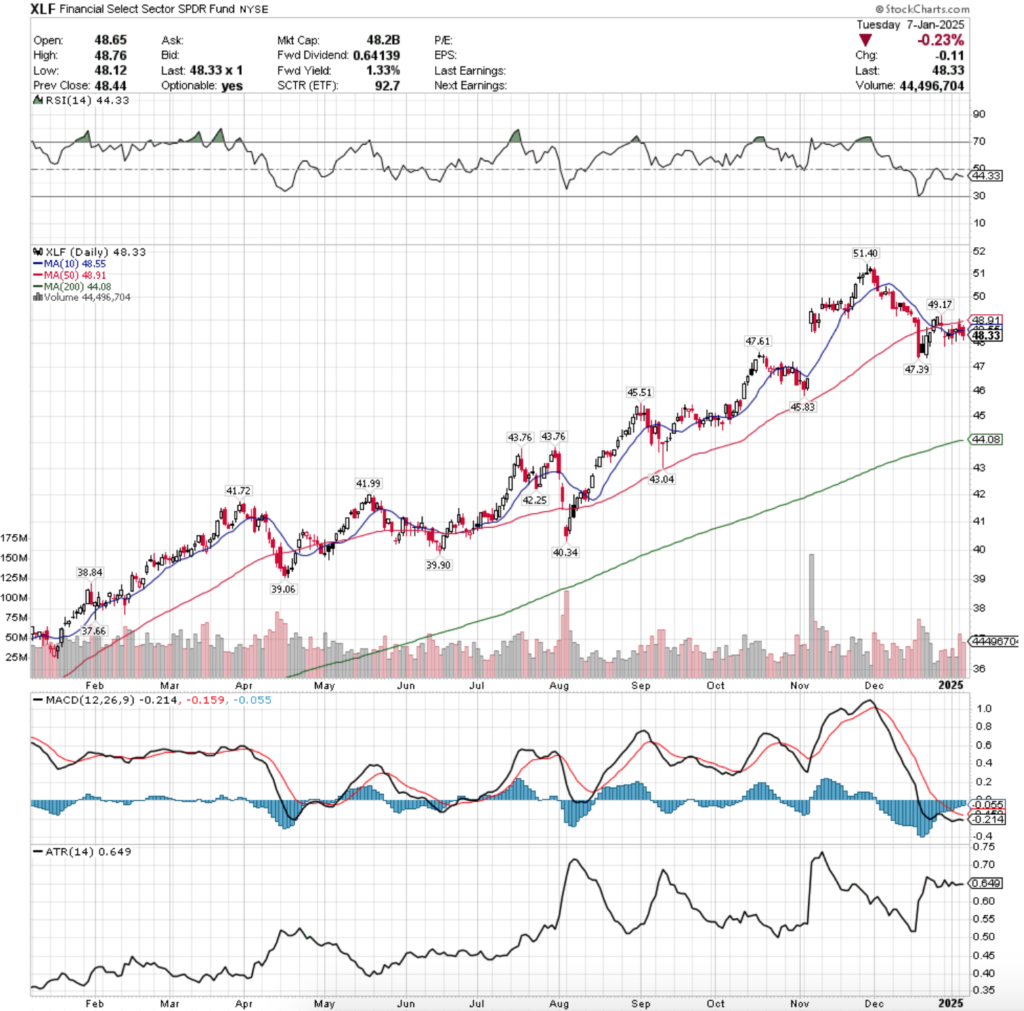
The RSI is trending lower just below the neutral 50 mark & sits currently at 44.33, while their MACD is bearish, but has flattened out & is moving towards the signal line with its histogram waning after their past week & a half’s consolidation.
Volumes over the past week & a half have been -8.83% lower than the previous year’s average level (37,200,000 vs. 40,804,007.94), which reflects caution given that they’ve been consolidating & that the past nine months have seen much lower volumes than the previous years’ average levels.
Another area to note about their recent volumes is that the declining volumes have been eclipsing the advancing volumes, as it appears that the bulls are either becoming exhausted or have been collecting their profits in the wake of the post-election gap up from early November that greatly benefitted XLF.
Last Monday XLF resembled the major four indexes (SPY, QQQ, IWM & DIA), as the week kicked off on a gap down below the support of the 10 day moving average & the session resulted in a high wave doji, setting the stage for the consolidation range that they’ve traded in since.
XLF was unable to break above the resistance of the 10 DMA & showed that market participants had the appetite to send it below $48/share briefly after the week prior’s brief rally higher.
Tuesday opened on a gap up to be in-line with the 10 DMA & was able to briefly break out above it, but the rest of the session resulted in tested lower, including to below the open/close of Monday’s session before ultimately closing above it, but below their opening price, indicating more bearish sentiment.
Thursday confirmed this, as the session opened higher above the 10 DMA & made a run at the 50 day moving average’s resistance, but came up short & wound up retreating down to below the $48/share level before settling just below the resistance of the 10 day moving average, forming a bearish engulfing candle pattern with Tuesday’s session.
The weak sentiment continued on Friday, when despite an advancing session there was bearish flags thrown all around, starting with the low volume of the day.
Additionally, while the session opened above the 10 DMA’s support, it drifted below it towards the $48/share price level, before rallying higher to close above its open, but in the process forming a hanging man candle (bearish).
Monday opened with a glimmer of hope on a gap up to just below the 50 DMA’s resistance, briefly broke above it, before the bears came back into control & forced prices back to close below the 10 DMA’s support & based on the small lower shadow & highest daily volume of the prior two (short) weeks showed that there was still a lot of uncertainty & hesitancy in the air.
Tuesday that narrative continued, when on slightly lower than Monday’s volume XLF opened midway between Monday’s range & broke down through the 10 DMA’s support to close lower, with their lower shadow showing that market participants were still eyeing that $48/share price level.
For the rest of this week & into next week market participants should have their eye on how XLF’s price behaves within the consolidation range that’s been set by the 50 DMA, $48/share price level & the 10 DMA which is oscillating around in between the two marks.
Prices have spent all of 2025 & the last two sessions of 2024 straddling the 10 DMA, while attempting to break out one way or the other from the 50 DMA to the upside & the $48 mark on the downside.
So far there seems to be more appetite for the downside breakout, but Monday’s session breaking the 50 DMA’s resistance briefly offers a glimmer of hope for investors hoping to see XLF break out to the upside.
The $48/share price level has been relatively even split between Buyers & Sellers, coming in at 1:1, while a breakout above the 50 DMA would place XLF into another Even price level, where Buyers & Sellers have met at a ratio of 1:1.
Should the $48 mark break down the $47-47.99 zone has been Buyer dominated at a rate of 0.2:0*, indicating that there has not been much downside testing compared to advancing volume & that it may be due for a test from the bears.
It is likely that barring any extreme news that the price will continue along in the manner mentioned above for the next week or so until we begin to see earnings reports for the financial companies, which will be where all eyes are watching on 1/15 & 1/16/2025.
Given that this recent consolidation looks set to continue before breaking out in either direction, it is imperative to understand how investors have behaved at the different price levels XLF has historically traded at in order to get a sense of how they may behave again.
The section below lays out how the buyers & sellers have met at each price level XLF has traded at over the past ~16 years.
While it is not indicative of future performance, history repeats itself & or rhymes & this can be used as a barometer to anticipate how market participants may behave when faced with these price levels again.
Price Level:Volume Sentiment Analysis For XLF, The Financial Select Sector SPDR Fund ETF
The top table below shows the support & resistance levels of XLF from the past year’s chart, as well as their price level:volume sentiment at each from data covering the past ~16 years, using Tuesday 1/7/2025’s closing data for their price & moving averages/other technicals.
The moving averages are denoted with bold.
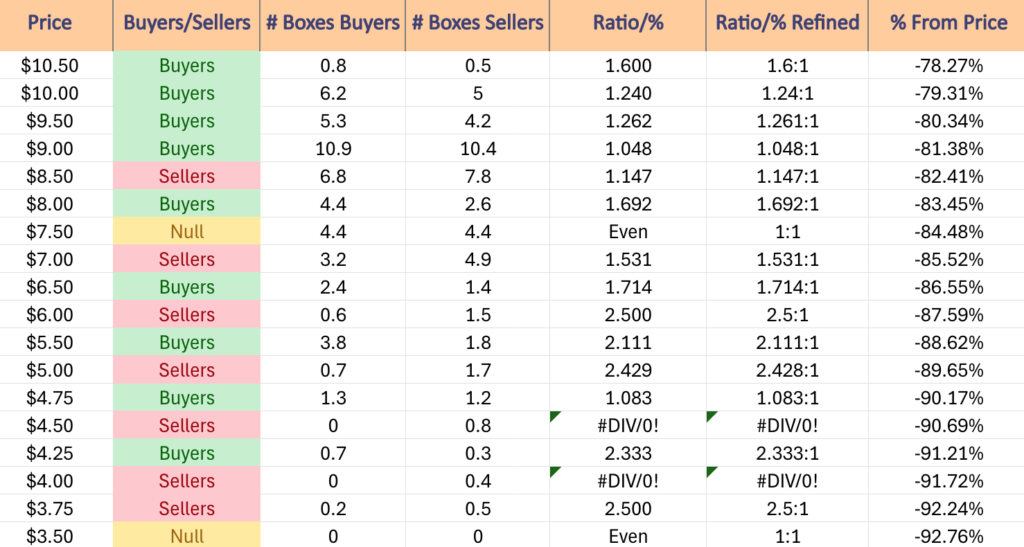
The next charts show the volume sentiment at each individual price level XLF has traded at over the past ~16 years.
Beneath them is a copy & pasteable list of the same data, where the support/resistance levels are denoted in bold.
All ratios with “0” in the denominator are denoted with a “*”.
NULL values are price levels that had limited trading volume, whether it be due to gaps, quick advances or they are at price extremes; in the event that they are retested & there is more data they would have a distinct “Buyers”, “Sellers” or “Even” title.
This is not intended as financial advice, but rather another tool to consider when performing your own research & due diligence on XLF.

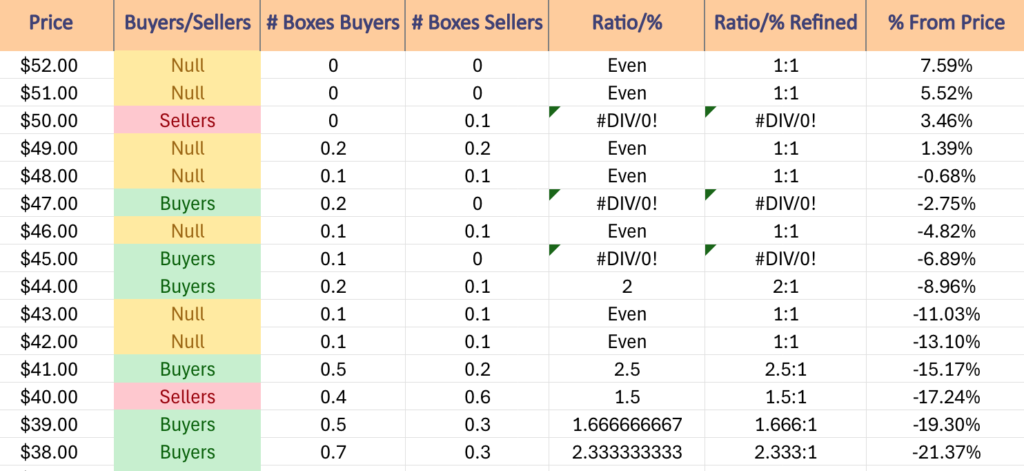
$52 – NULL – 0:0*, +7.59% From Current Price Level
$51 – NULL – 0:0*, +5.52% From Current Price Level
$50 – Sellers – 0.1:0*, +3.46% From Current Price Level
$49 – Even – 1:1, +1.39% From Current Price Level
$48 – Even – 1:1, -0.68% From Current Price Level – Current Price Level, 10 & 50 Day Moving Averages***
$47 – Buyers – 0.2:0*, -2.75% From Current Price Level
$46 – Even – 1:1, -4.82% From Current Price Level
$45 – Buyers – 01.:0*, -6.89% From Current Price Level
$44 – Buyers – 2:1, -8.96% From Current Price Level – 200 Day Moving Average*
$43 – Even – 1:1, -11.03% From Current Price Level
$42 – Even – 1:1, -13.1% From Current Price Level
$41 – Buyers – 2.5:1, -15.17% From Current Price Level
$40 – Sellers 1.5:1, -17.24% From Current Price Level
$39 – Buyers- 1.67:1, -19.3% From Current Price Level
$38 – Buyers – 2.33:1, -21.37% From Current Price Level
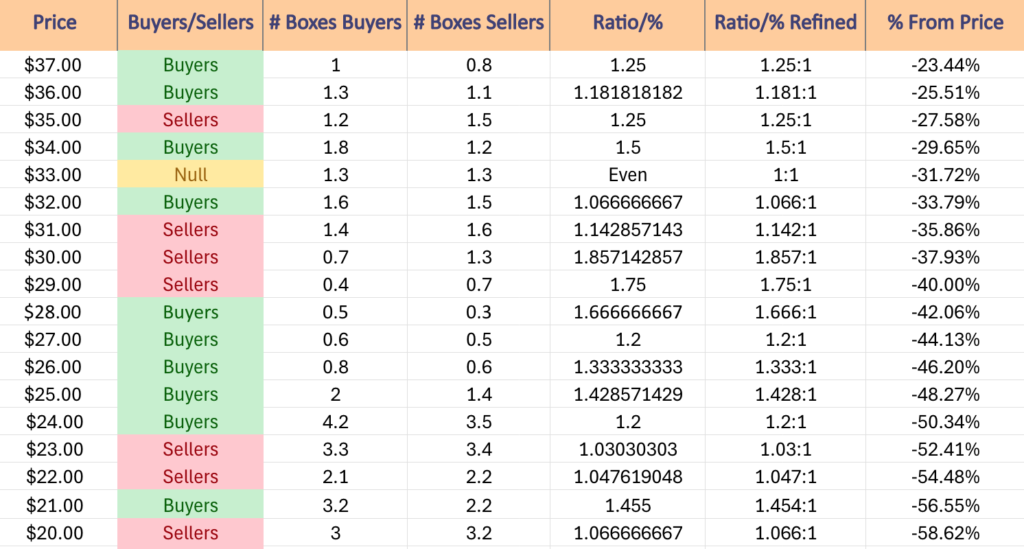
$37 – Buyers – 1.25:1, -23.44% From Current Price Level
$36 – Buyers – 1.18:1, -25.51% From Current Price Level
$35 – Sellers – 1.25:1, -27.58% From Current Price Level
$34 – Buyers – 1.5:1, -29.65% From Current Price Level
$33 – Even – 1:1, -31.72% From Current Price Level
$32 – Buyers – 1.07:1, -33.79% From Current Price Level
$31 – Sellers – 1.14:1, -35.86% From Current Price Level
$30 – Sellers – 1.86:1, -37.93% From Current Price Level
$29 – Sellers – 1.75:1, -40% From Current Price Level
$28 – Buyers – 1.67:1, -42.06% From Current Price Level
$27 – Buyers – 1.2:1, -44.13% From Current Price Level
$26 – Buyers – 1.33:1, -46.2% From Current Price Level
$25 – Buyers – 1.43:1, -48.27% From Current Price Level
$24 – Buyers – 1.2:1, -50.34% From Current Price Level
$23 – Sellers – 1.03:1, -52.41% From Current Price Level
$22 – Sellers – 1.05:1, -54.48% From Current Price Level
$21 – Buyers – 1.45:1, -56.55% From Current Price Level
$20 – Sellers – 1.07:1, -58.62% From Current Price Level
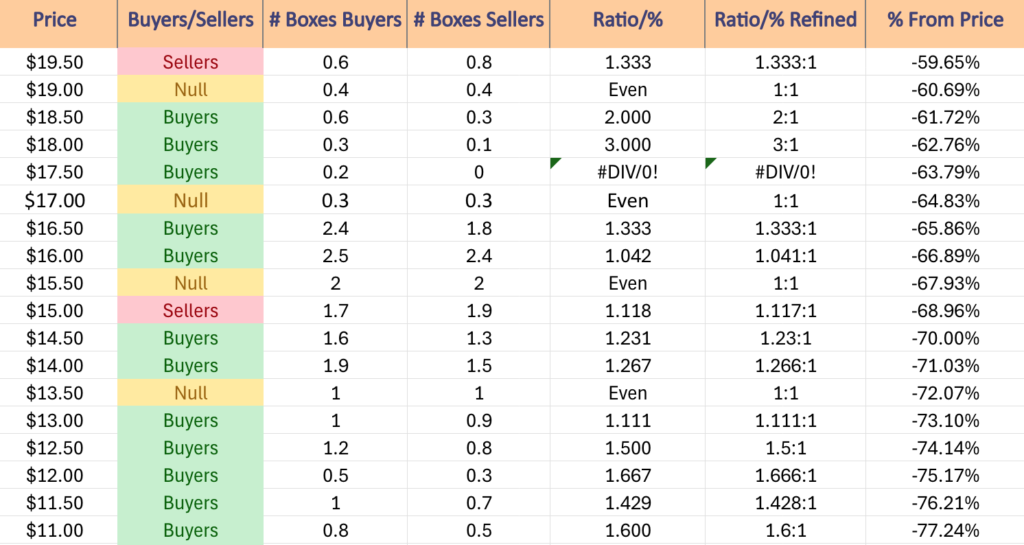
$19.50 – Sellers – 1.33:1, -59.65% From Current Price Level
$19 – Even – 1:1, -60.69% From Current Price Level
$18.50 – Buyers – 2:1, -61.72% From Current Price Level
$18 – Buyers – 3:1, -62.76% From Current Price Level
$17.50 – Buyers – 02:0*, -63.79% From Current Price Level
$17 – Even – 1:1, -64.83% From Current Price Level
$16.50 – Buyers – 1.33:1, -65.86% From Current Price Level
$16 – Buyers – 1.04:1, -66.89% From Current Price Level
$15.50 – Even – 1:1, -67.93% From Current Price Level
$15 – Sellers – 1.12:1, -68.96% From Current Price Level
$14.50 – Buyers – 1.23:1, -70% From Current Price Level
$14 – Buyers – 1.27:1, -71.03% From Current Price Level
$13.50 – Even – 1:1, -72.07% From Current Price Level
$13 – Buyers – 1.11:1, -73.1% From Current Price Level
$12.50 – Buyers – 1.5:1, -74.14% From Current Price Level
$12 – Buyers – 1.67:1, -75.17% From Current Price Level
$11.50 -Buyers – 1.43:1, -76.21% From Current Price Level
$11 – Buyers – 1.6:1, -77.24% From Current Price Level
$10.50 – Buyers – 1.6:1, -78.27% From Current Price Level
$10 – Buyers – 1.24:1, -79.31% From Current Price Level
$9.50 – Buyers – 1.26:1, -80.34% From Current Price Level
$9 – Buyers – 1.05:1, -81.38% From Current Price Level
$8.50 – Sellers – 1.15:1, -82.41% From Current Price Level
$8 – Buyers – 1.69:1, -83.45% From Current Price Level
$7.50 – Even – 1:1, -84.48% From Current Price Level
$7 – Sellers – 1.53:1, -85.52% From Current Price Level
$6.50 – Buyers – 1.71:1, -86.55% From Current Price Level
$6 – Sellers – 2.5:1, -87.59% From Current Price Level
$5.50 – Buyers – 2.11:1, -88.62% From Current Price Level
$5 – Sellers – 2.43:1, -89.65% From Current Price Level
$4.75 – Buyers – 1.08:1, -90.17% From Current Price Level
$4.50 – Sellers – 0.8:0*, -90.69% From Current Price Level
$4.25 – Buyers – 2.33:1, -91.21% From Current Price Level
$4 – Sellers – 0.4:0*, -91.72% From Current Price Level
$3.75 – Sellers – 2.5:1, -92.24% From Current Price Level
$3.50 – NULL – 0:0*, -92.76% From Current Price Level
*** I DO NOT OWN SHARES OR OPTIONS CONTRACT POSITIONS IN XLF AT THE TIME OF PUBLISHING THIS ARTICLE ***