XLK, the Technology Sector Select SPDR Fund ETF has had a strong year, advancing +32.41% since one year ago, including a 42.91% gain since its 52-week low in October of 2023 & it sits just 2% below its 52-week high set in June of 2024.
This great performance has been powered primarily by the boom in technology company names that we have seen over the past year, in particular ones associated with Artificial Intelligence.
XLK’s ten largest holdings include Microsoft Corp. NVIDIA Corp., Apple Inc., Broadcom Inc., Advanced Micro Devices, Adobe Inc., Salesforce Inc., Oracle Corp., Qualcomm Inc. & Applied Materials Inc.
While there has been a bit of a cool down period following the NVDA stock split recently many investors are still bullish on the space & given that the recent chart for NVDA & XLK look strikingly similar it is worth taking a closer look at volume sentiment at their recent price levels.
With markets near all-time highs but looking set to cool off there has been a lot of talk recently about bonds, making it worth diving into the strength of XLK’s support & resistance levels.
This will provide an understanding about how investors have previously behaved when XLK was at these pivotal price points & may shed insight into how their future behavior may play out if these levels are revisited.
Below is a brief review of XLK’s recent technical performance, followed by the volume sentiments for each of the price levels that they have traded at over the past 2-3 years.
It is not intended to serve as financial advice, but rather as an additional tool to reference while performing your own due diligence into XLK.
Technical Analysis Of XLK, The Technology Sector Select SPDR Fund ETF
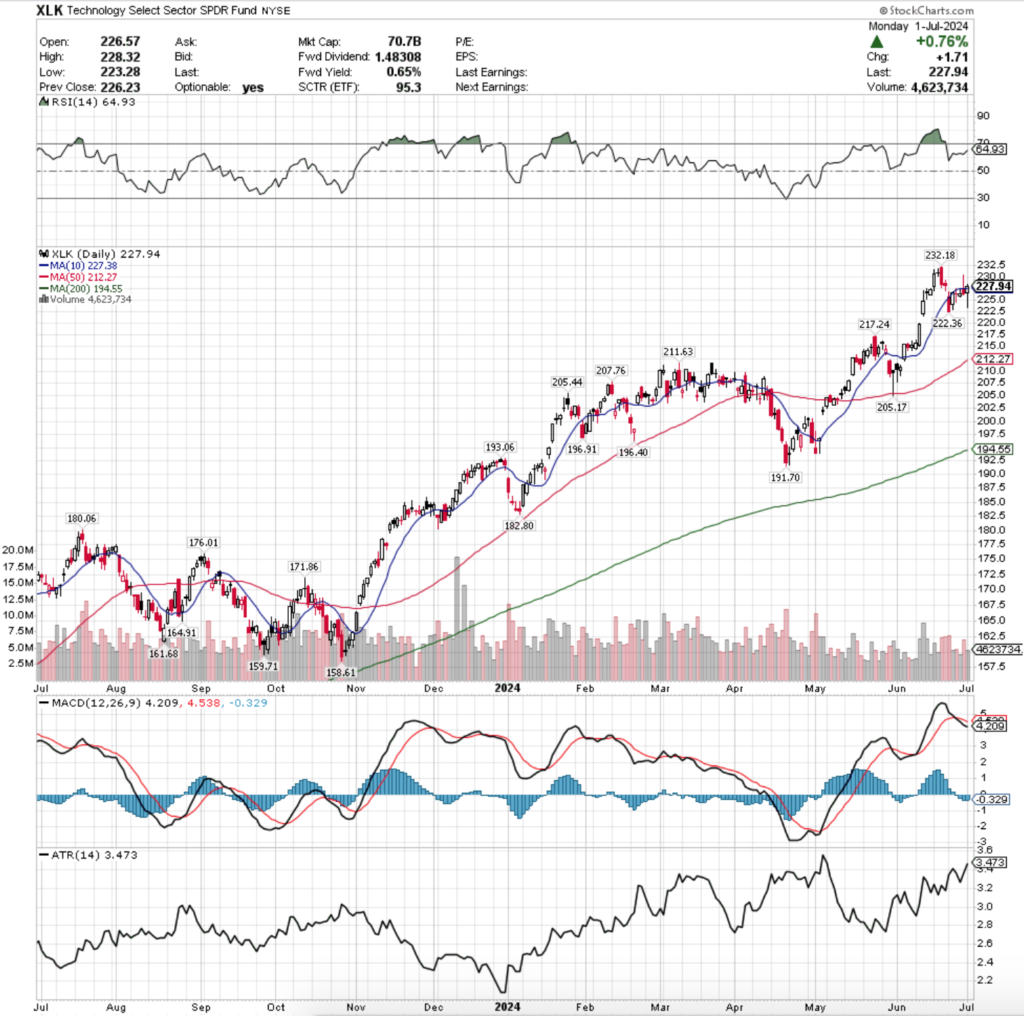
Their RSI is trending back towards overbought levels & sits currently at 64.93, while their MACD has been bearish since they began to fall from hitting a new all-time high in mid-June.
Volumes this past week were -24.51% below average compared to the year prior’s average (4,827,580 vs. 6,395,214.34) indicating that there is severe hesitancy on the part of market participants to dive into XLK at these high price levels.
Another troubling story that volume is telling currently is that most of the higher volume sessions of the past eight weeks have been declining sessions.
Last Monday was the biggest weakness signal for XLK, as just two sessions after hitting a new all-time high the week kicked off with a gap down that opened in line with the 10 day moving average, tried to stay afloat above it, but ultimately sank lower on the session & settled -4.23% below the all-time high on high declining volume.
The next day opened midway through Monday’s wide range candle, tested a bit lower but bulls didn’t allow prices to reach Monday’s closed & wound up driving prices higher to close around the 10 DMA’s resistance.
Wednesday showed that there was severe uncertainty in the market, but that the 10 DMA’s resistance was in tact, as a long-legged doji was the result of trading that day for XLK.
Thursday continued the same theme, as the session resulted in a spinning top whose real body is located on the lower end of the candle’s range & whose upper shadow was unable to break through the resistance of the 10 day moving average.
Last Friday & yesterday’s sessions are where things become really shaky however.
On Friday XLK opened on a gap up & prices were able to break above the 10 day moving average & they ran above $230/share before breaking down completely in a risk-off into the weekend play on the highest volumes of the week.
The resulting candle resembled a shooting star, with the exception of there being limited strength in the preceding uptrend.
Yesterday (Monday 7/1)’s candle looks almost identical but inverted, resembling a hanging man with a slight upper shadow.
Monday’s prices opened just above Friday’s close, tested far lower to the $223-range before recovering & closing the day just above the 10 day moving average’s resistance.
The troubling part of this is that while Monday was able to close above the 10 DMA, the day’s volume was rather weak for the extent of the price range covered for the day, which is not an indication of strength.
As to be expected, XLK’s Average True Range has been climbing in the wake of the declines from the all-time high, and should be set to continue higher in the near-term.
The price pressure is currently descending, which makes it a great time to review the strength of XLK’s support levels & to assess historic buyer & seller activity at them in an effort to understand what may happen if they’re tested again in the near-term.
XLK, The Technology Sector Select SPDR Fund ETF’s Price Level:Volume Sentiment Broken Down
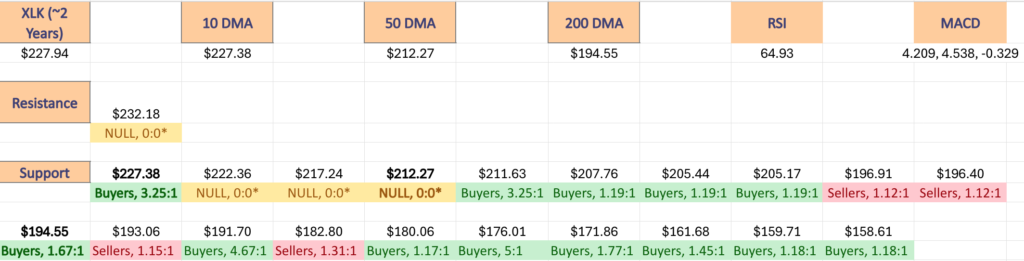
The top table below shows the support & resistance levels of XLK ETF from the past year’s chart, as well as their price level:volume sentiment at each, using Monday’s closing price.
The moving averages are denoted with bold.
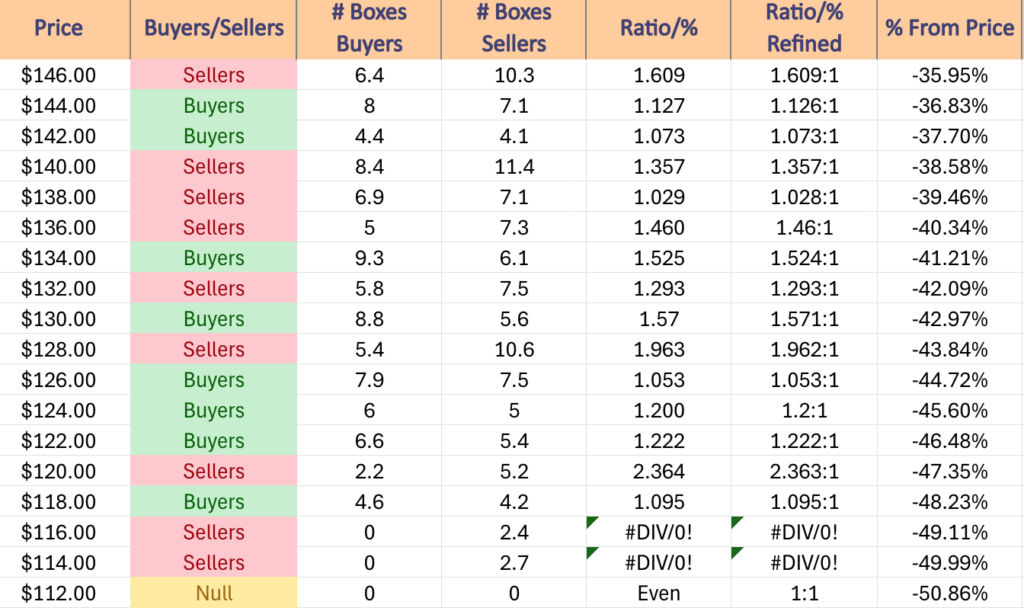
The next charts show the volume sentiment at each individual price level XLK has traded at over the past ~2-3 years.
Beneath them is a copy & pasteable list of the same data, where the support/resistance levels are denoted in bold.
All ratios with “0” in the denominator are denoted with a “*”.
NULL values are price levels that had limited trading volume, whether it be due to gaps, quick advances or they are at price extremes; in the event that they are retested & there is more data they would have a distinct “Buyers”, “Sellers” or “Even” title.
This is not intended as financial advice, but rather another tool to consider when performing your own research & due diligence on XLK ETF or any of its components.
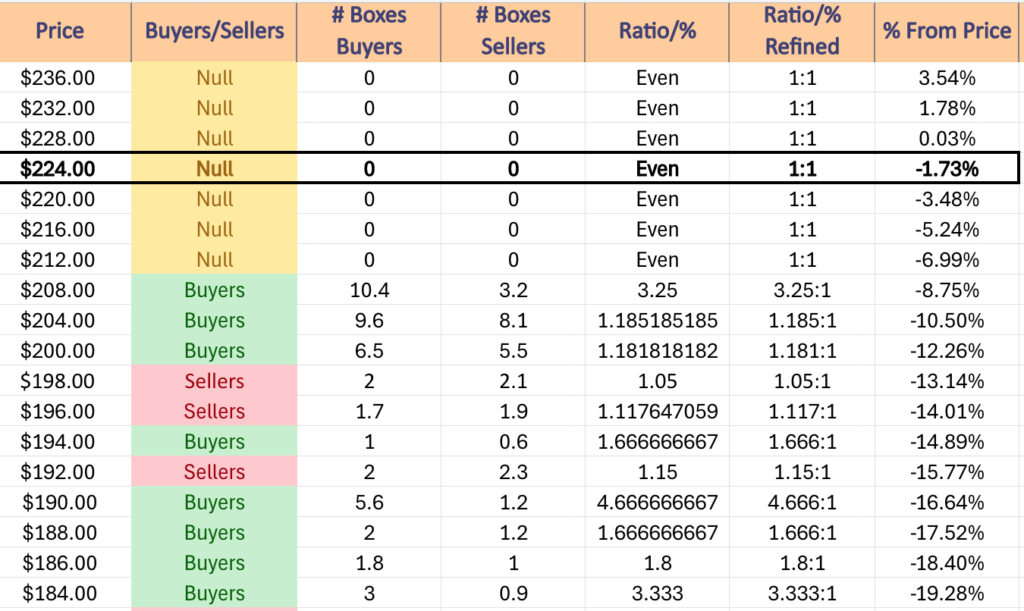
$236 – NULL – 0:0*, +3.54% From Current Price Level
$232 – NULL – 0:0*, +1.78% From Current Price Level
$228 – NULL – 0:0*, +0.03% From Current Price Level
$224 – NULL – 0:0*, -1.73% From Current Price Level – Current Price Box & 10 Day Moving Average**
$220 – NULL – 0:0*, -3.48% From Current Price Level
$216 – NULL – 0:0*, -5.24% From Current Price Level
$212 – NULL – 0:0*, -6.99% From Current Price Level – 50 Day Moving Average*
$208 – Buyers – 3.25:1., -8.75% From Current Price Level
$204 – Buyers – 1.19:1, -10.5% From Current Price Level
$200 – Buyers – 1.18:1, -12.26% From Current Price Level
$198 – Sellers – 1.05:1, -13.14% From Current Price Level
$196 – Sellers – 1.12:1, -14.01% From Current Price Level
$194 – Buyers – 1.67:1, -14.89% From Current Price Level – 200 Day Moving Average*
$192 – Sellers – 1.15:1, -15.77% From Current Price Level
$190 – Buyers – 4.67:1, -16.64% From Current Price Level
$188 – Buyers – 1.67:1, -17.52% From Current Price Level
$186 – Buyers – 1.8:1, -18.4% From Current Price Level
$184 – Buyers – 3.33:1, -19.28% From Current Price Level
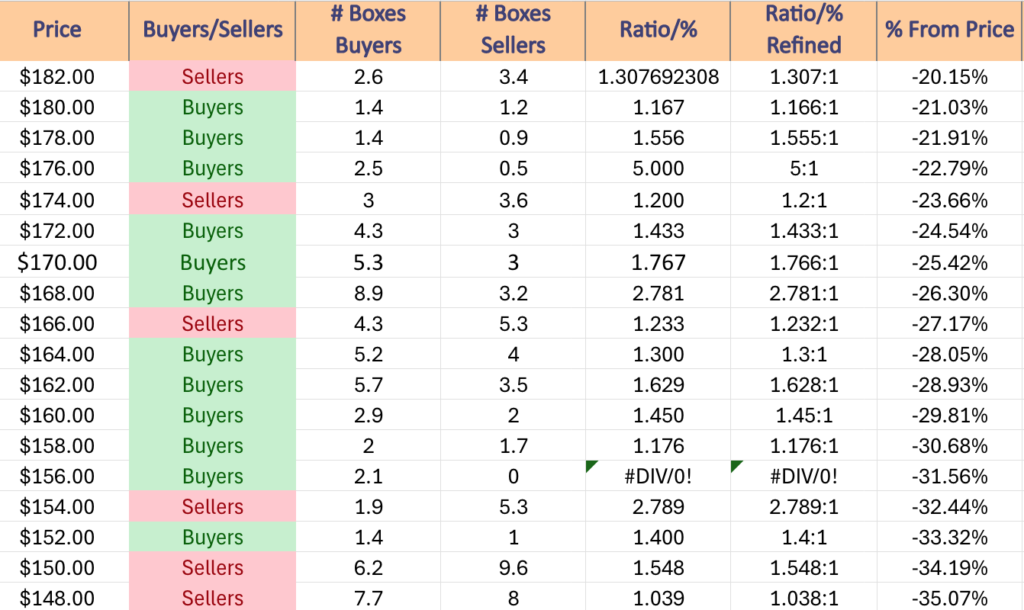
$182 – Sellers – 1.31:1, -20.15% From Current Price Level
$180 – Buyers – 1.17:1, -21.03% From Current Price Level
$178 – Buyers – 1.56:1, -21.91% From Current Price Level
$176 – Buyers – 5:1, -22.79% From Current Price Level
$174 – Sellers – 1.2:1. -23.66% From Current Price Level
$172 – Buyers – 1.43:1, -24.54% From Current Price Level
$170 – Buyers – 1.77:1, -25.42% From Current Price Level
$168 – Buyers – 2.78:1, -26.3% From Current Price Level
$166 – Sellers – 1.23:1, -27.17% From Current Price Level
$164 – Buyers – 1.3:1, -28.05% From Current Price Level
$162 – Buyers – 1.63:1, -28.93% From Current Price Level
$160 – Buyers – 1.45:1, -29.81% From Current Price Level
$158 – Buyers – 1.18:1, -30.68% From Current Price Level
$156 – Buyers – 2.1:0*, -31.56% From Current Price Level
$154 – Sellers – 2.79:1, -32.44% From Current Price Level
$152 – Buyers – 1.4:1, -33.32% From Current Price Level
$150 – Sellers – 1.55:1, -34.19% From Current Price Level
$148 – Sellers – 1.04:1, -35.07% From Current Price Level
$146 – Sellers – 1.61:1, -35.95% From Current Price Level
$144 – Buyers – 1.13:1, -36.83% From Current Price Level
$142 – Buyers – 1.07:1, -37.7% From Current Price Level
$140 – Sellers – 1.36:1, -38.58% From Current Price Level
$138 – Sellers – 1.03:1, -39.46% From Current Price Level
$136 – Sellers – 1.46:1, -40.34% From Current Price Level
$134 – Buyers – 1.52:1, -41.21% From Current Price Level
$132 – Sellers – 1.29:1, -42.09% From Current Price Level
$130 – Buyers – 1.57:1, -42.97% From Current Price Level
$128 – Sellers – 1.96:1, -43.84% From Current Price Level
$126 – Buyers – 1.05:1, -44.72% From Current Price Level
$124 – Buyers – 1.2:1, -45.6% From Current Price Level
$122 – Buyers – 1.22:1, -46.48% From Current Price Level
$120 – Sellers – 2.36:1, -47.35% From Current Price Level
$118 – Buyers – 1.1:1, -48.23% From Current Price Level
$116 – Sellers – 2.4:0*, -49.11% From Current Price Level
$114 – Sellers – 2.7:0*, -49.99% From Current Price Level
$112 – NULL – 0:0*, -50.86% From Current Price Level
$110 – NULL – 0:0*, -51.74% From Current Price Level
*** I DO NOT OWN SHARES OR OPTIONS CONTRACT POSITIONS IN XLK AT THE TIME OF PUBLISHING THIS ARTICLE ***