XLY, the Consumer Discretionary Select Sector SPDR ETF has advanced +7.89% over the past year, having fallen -22.52% from their 52-week high in December of 2024, but having gained 11.82% since their 52-week low in August of 2024.
While some members of the sector have fared better than others, there has been doubts about the strength of the US consumers, which is evident based on XLY being back to less than 10% from where they were one year ago.
Some of their top holdings include Amazon.com Inc. (AMZN), Tesla Inc. (TSLA), Home Depot Inc. (HD), McDonald’s Corp (MCD), Booking Holdings Inc. (BKNG), TJX Companies Inc. (TJX), Lowe’s Cos. Inc. (LOW), Starbucks Corp. (SBUX), O’Reilly Automotive Inc. (ORLY) & Nike Inc. (NKE).
While earnings calls continue to provide us insight into the current & future strength of consumers & broader markets remain volatile it is important to have an understanding of how market participants have behaved in the past at each of XLY’s price levels.
This will be especially valuable in instances of support/resistance retests, as understanding how historically strong/weak each level is lends clues into the market’s broader sentiment about these price levels & how they may behave again at them.
Below is a brief technical analysis of XLY, as well as a price level:volume sentiment analysis of the price levels XLY has traded at over the past ~3 years.
Included in this data is also their recent support & resistance levels so that readers can gain insight into how strong/weak these support/resistance levels may be in the future, based on past investor behavior.
It is not intended to serve as financial advice, but rather as an additional tool to reference while performing your own due diligence on XLY.
Technical Analysis Of XLY, The Consumer Discretionary Select Sector SPDR Fund ETF
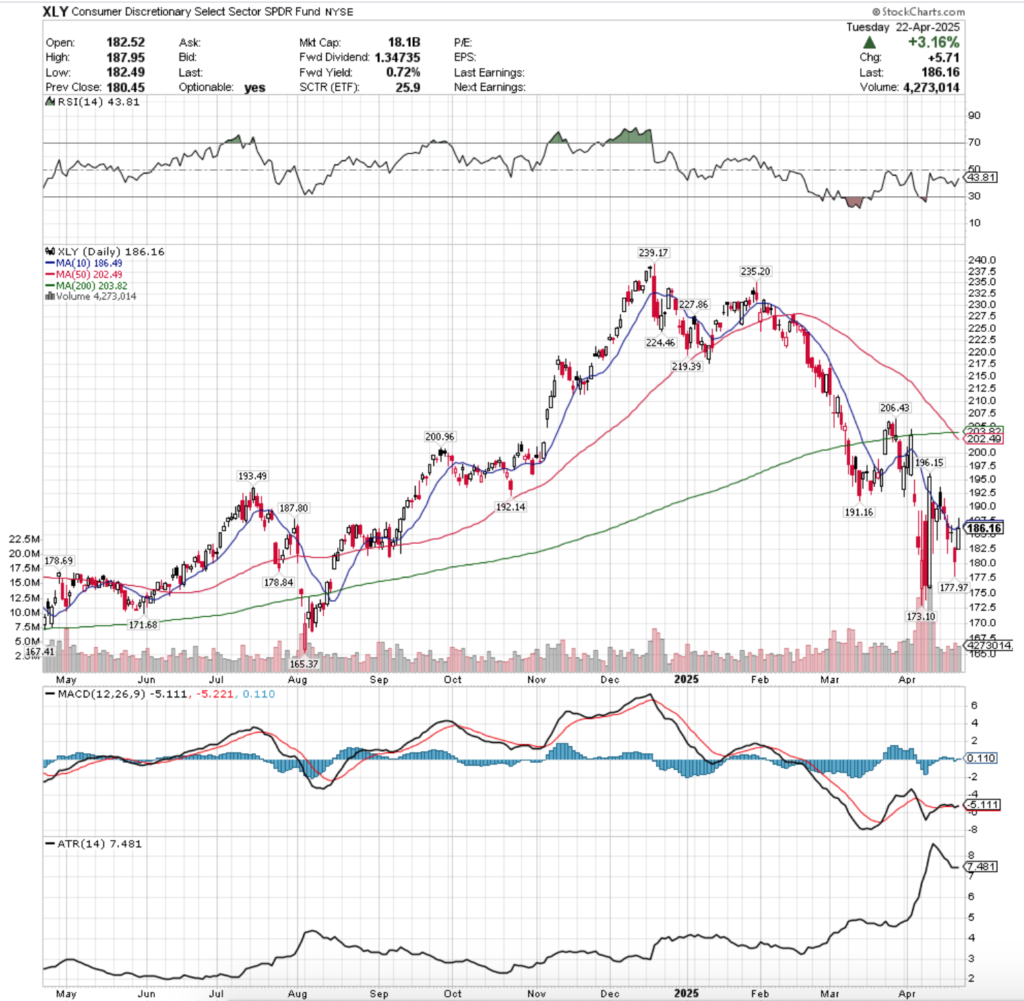
Their RSI is advancing back towards the neutral 50-level & currently sits at 43.81, while their MACD crossed over the signal line bullishly yesterday morning, but currently looks more set to dolphin & dip back below it in the short-term than actually lead to a meaningful advance.
Volumes have been +18.11% higher than the prior year’s average over the past six sessions (4,078,333.33 vs. 3,453,132.53), as while the heightened volume amid the volatility of the previous week has diluted significantly, there is still elevated participation levels.
Last Monday XLY opened on a gap up, tested a little higher, before ultimately plummeting to test below the $190/share level in a bearish session that closed below its opening price.
Tuesday opened on a gap lower, retraced about halfway through Monday’s real-body, but was unable to find enough traction & sunk lower on the day, with the day’s low touching $187.83, signaling that there was further downside appetite.
The 10 day moving average’s support managed to keep XLY afloat above it, but the day’s low range showed that it was not sturdy.
Wednesday proved this when a gap down open was unable to retrace back to Tuesday’s closing price & XLY declined below the $182.50/share level temporarily, before clawing back up to close at $184.24/share, below the 10 DMA’s support.
Thursday the holiday week wound down with a harami cross that was about midway between Wednesday’s daily range, indicating that there was a degree of uncertainty heading into the weekend, but market participants thought XLY was fairly valued within the prior day’s range & below the resistance of the 10 day moving average.
This week kicked off on a bearish note, as the highest volume session of the past six days occurred on a gap down that went as low as $177.97/share before recovering to close lower on the day at $180.45.
Yesterday showed the second highest volume of that window on an advancing session that closed just beneath the 10 DMA’s resistance, after briefly breaking above it intraday.
Taking a step back & looking at XLY’s chart it is also worth noting the death cross that occurred last week when their 50 day moving average crossed bearishly through their 200 day moving average, meaning that now price is furthest from their long-term trend line, but below it.
This likely means that there are more declines on the near-to-mid-term horizon for XLY, particularly as it fills the window created by today’s gap up open in the coming week(s).
Much like our weekly market review note has been saying for weeks, unless there is a sustainable uptick in advancing volume, any gains such as those seen so far this morning should be viewed with skepticism.
This is made even more true now that the long-term trend line has been death crossed.
Price will likely oscillate around the 10 day moving average while the 50 DMA approaches it & the market waits for a catalyst to the up or downside, likely to come as a result of earnings reports over the next couple of weeks & tariff negotiation results.
Another area to consider is the wide-range advancing session from 4/9/2025, which has not proven to be a reversal point just yet, but that has played host to XLY’s consolidation range within it’s real body.
If today’s candle does not manage to break above that high & the window remains open, that may trigger a loss of confidence & some profit taking that drives XLY’s price down to test the low of 4/7/2025 at $173.10.
While there are other support levels in that range, particularly the new ones that were resistance before this morning’s open, sentiment is not particularly strong currently, given XLY’s recent performance.
The section below outlines the volume sentiment at each price level XLY has traded at over the past ~3 years & can be used to assess the strength/weakness of the support/resistance levels & price levels that XLY retests in the coming weeks.
This can aid in understanding how market participants may behave again at each level.
Price Level:Volume Sentiment Analysis For XLY, The Consumer Discretionary Select Sector SPDR Fund ETF
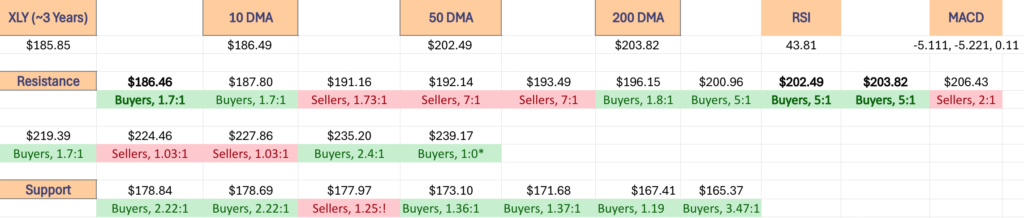
The top table below shows the support & resistance levels of XLY from the past year’s chart, as well as their price level:volume sentiment at each from data covering the past ~3 years, using Tuesday 4/22/2025’s closing data for their price & moving averages/other technicals.
The moving averages are denoted with bold.
The next charts show the volume sentiment at each individual price level XLY has traded at over the past ~3 years.
Beneath them is a copy & pasteable list of the same data, where the support/resistance levels are denoted in bold.
All ratios with “0” in the denominator are denoted with a “*”.
NULL values are price levels that had limited trading volume, whether it be due to gaps, quick advances or they are at price extremes; in the event that they are retested & there is more data they would have a distinct “Buyers”, “Sellers” or “Even” title.
This is not intended as financial advice, but rather another tool to consider when performing your own research & due diligence on XLY.
The following section lays out XLY’s one year support/resistance levels, as well as their Buyer:Seller (Seller:Buyer) ratios at each price level that they’ve traded at over the past ~3 years, which can be used as a barometer for estimating the expected strength/weakness of each of the support/resistance levels.
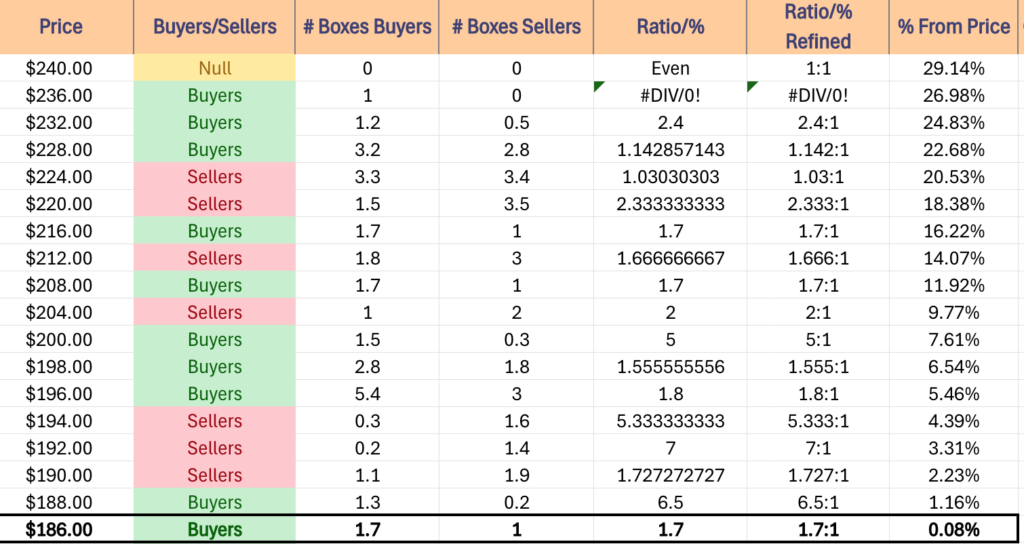
$240 – NULL – 0:0*, +29.14% From Current Price Level
$236 – Buyers – 1:0*, +26.98% From Current Price Level
$232 – Buyers – 2.4:1, +24.83% From Current Price Level
$228 – Buyers – 1.14:1, +22.68% From Current Price Level
$224 – Sellers – 1.03:1, +20.53% From Current Price Level
$220 – Sellers – 2.33:1, +18.38% From Current Price Level
$216 – Buyers – 1.7:1, +16.22% From Current Price Level
$212 – Sellers – 1.67:1, +14.07% From Current Price Level
$208 – Buyers – 1.7:1, +11.92% From Current Price Level
$204 – Sellers – 2:1, +9.77% From Current Price Level
$200 – Buyers – 5:1, +7.61% From Current Price Level – 50 & 200 Day Moving Averages**
$198 – Buyers – 1.56:1, +6.54% From Current Price Level
$196 – Buyers – 1.8:1, +5.46% From Current Price Level
$194 – Sellers – 5.33:1, +4.39% From Current Price Level
$192 – Sellers – 7:1, +3.31% From Current Price Level
$190 – Sellers – 1.73:1, +2.23% From Current Price Level
$188 – Buyers – 6.5:1, +1.16% From Current Price Level
$186 – Buyers – 1.7:1, +0.08% From Current Price Level – Current Price Level & 10 Day Moving Average**
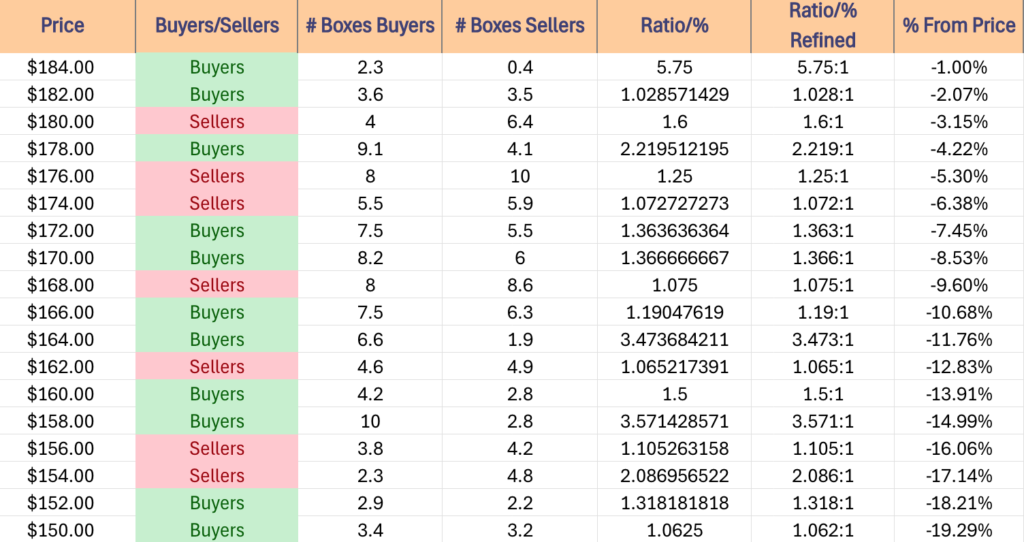
$184 – Buyers – 5.75:1, -1% From Current Price Level
$182 – Buyers – 1.03:1, -2.07% From Current Price Level
$180 – Sellers – 1.6:1, -3.15% From Current Price Level
$178 – Buyers – 2.22:1, -4.22% From Current Price Level
$176 – Sellers – 1.25:1, -5.3% From Current Price Level
$174 – Sellers – 1.07:1, -6.38% From Current Price Level
$172 – Buyers – 1.36:1, -7.45% From Current Price Level
$170 – Buyers – 1.37:1, -8.53% From Current Price Level
$168 – Sellers – 1.08:1, -9.6% From Current Price Level
$166 – Buyers – 1.19:1, -10.68% From Current Price Level
$164 – Buyers – 3.47:1, -11.76% From Current Price Level
$162 – Sellers – 1.07:1, -12.83% From Current Price Level
$160 – Buyers – 1.5:1, -13.91% From Current Price Level
$158 – Buyers – 3.57:1, -14.99% From Current Price Level
$156 – Sellers – 1.11:1, -16.06% From Current Price Level
$154 – Sellers – 2.09:1, -17.14% From Current Price Level
$152 – Buyers – 1.32:1, -18.21% From Current Price Level
$150 – Buyers – 1.06:1, -19.29% From Current Price Level
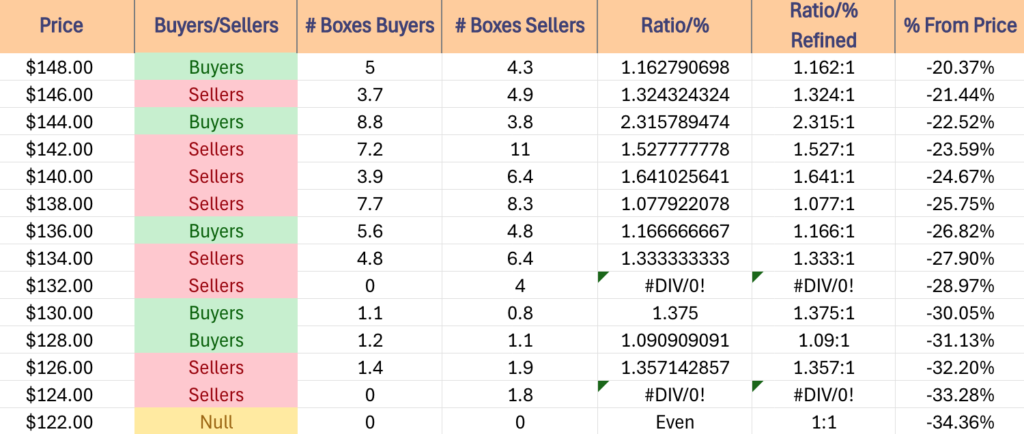
$148 – Buyers – 1.16:1, -20.37% From Current Price Level
$146 – Sellers – 1.32:1, -21.44% From Current Price Level
$144 – Buyers – 2.32:1, -22.52% From Current Price Level
$142 – Sellers – 1.53:1, -23.59% From Current Price Level
$140 – Sellers – 1.64:1, -24.67% From Current Price Level
$138 – Sellers – 1.08:1, -25.75% From Current Price Level
$136 – Buyers – 1.17:1, -26.82% From Current Price Level
$134 – Sellers – 1.33:1, -27.9% From Current Price Level
$132 – Sellers – 4:0*, -28.97% From Current Price Level
$130 – Buyers – 1.38:1, -30.05% From Current Price Level
$128 – Buyers – 1.09:1, -31.13% From Current Price Level
$126 – Sellers – 1.36:1, -32.2% From Current Price Level
$124 – Sellers – 1.8:0*, -33.28% From Current Price Level
$122 – NULL – 0:0*, -34.36% From Current Price Level
*** I DO NOT OWN SHARES OR OPTIONS CONTRACT POSITIONS IN XLY AT THE TIME OF PUBLISHING THIS ARTICLE ***