NVIDIA Corp. stock trades under the ticker NVDA & has had an astounding year, advancing +191.63%, gaining +226.62% since their 52-week low in December of 2023 & sitting just -1.84% below their 52-week high from 11/8/2024 (all figures ex-dividends).
NVDA has been no stranger to our posts here this past year due to their high flying performance & the AI/Data Center Boom, which makes today’s earnings report very important as it will dictate if the major market indexes that are near all-time highs can maintain their current explosive performance.
In the event of disappointment there may be broader corrections & a pivot from the technology names & into more “concrete” names, such as the companies that build their data centers & supply the builders, as well as the utilities companies as a flight to safety & for their better dividend yields, while maintaining a focus on the future data center needs (see this post from April 2024 for some names that might make up a Synthetic A.I. ETF that excludes the technology sector).
Below is a brief technical analysis of NVDA, as well as a price level:volume sentiment analysis of the price levels NVDA has traded at over the ~8 months.
Included in this data is also their recent support & resistance levels so that readers can gain insight into how strong/weak these support/resistance levels may be in the future, based on past investor behavior.
It is not intended to serve as financial advice, but rather as an additional tool to reference while performing your own due diligence on NVDA.
NVIDIA Corp. NVDA Stock’s Technical Performance Broken Down

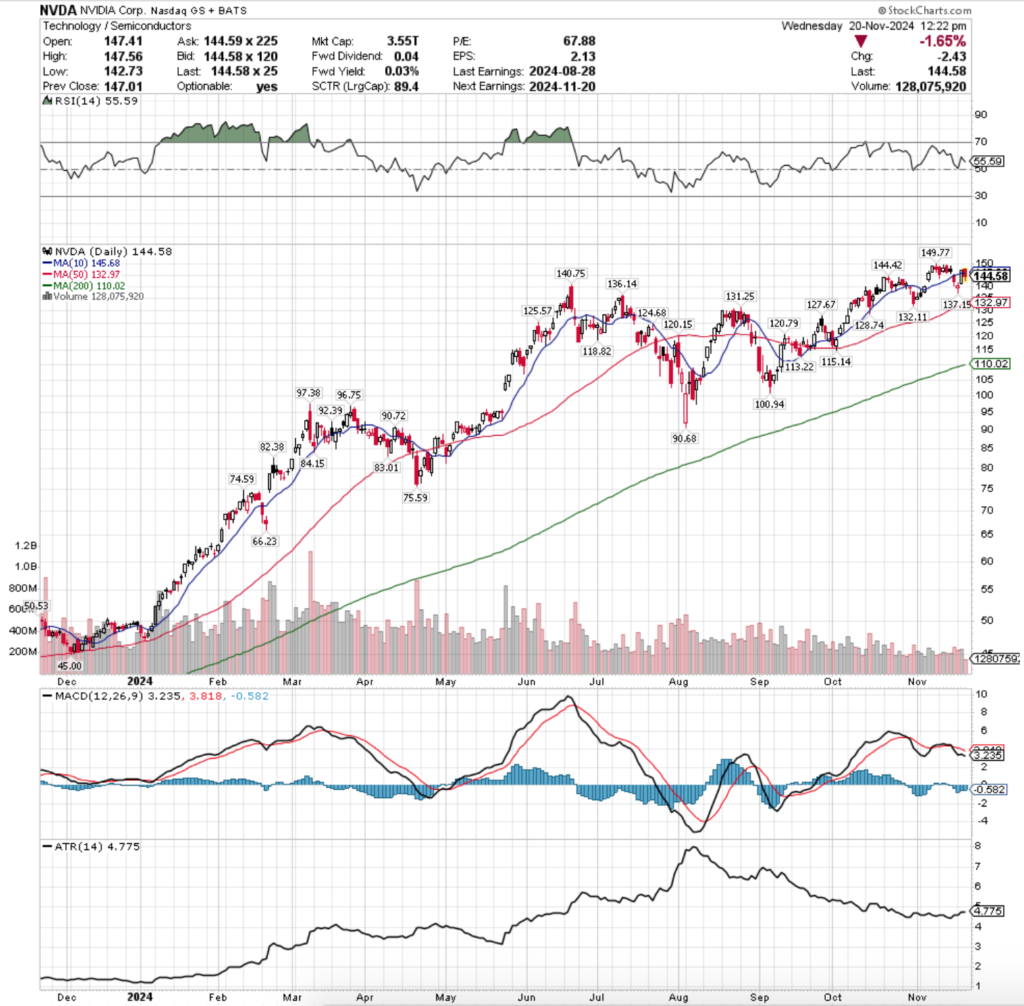
Their RSI is currently trending down & approaching the neutral level of 50 & currently sits at 55.59, while their MACD crossed over bearishly last week & continues to trend lower & further from the signal line.
Volumes have been -47.42% below the previous year’s average levels over the past week & a half (209,592,857.14 vs. 398,617,103.17) as market participants eagerly await to see if they can continue their steep ascent or if the AI-mania may be taking a breather/coming to an end.
From a high level it seems at least by volume that many folks are remaining content to wait & see, as there has not been much outsized declining volume in relation to advancing volume.
However, the fact that the participation rate has been effectively cut in half vs. the prior year in the last week & a half should raise an eyebrow of skepticism as it shows that either folks are sensing danger on the horizon & or are realizing that they’re near a perfect valuation & have become content, neither of which tend to be good things, especially near an earnings report.
On the same high level track note that the tops & bottoms of their price charts have been contracting (bearish) since mid-October & prices stalled out at the all-time high only 3.7% higher than the prior ATH from mid-October.
The past two weeks have also been flashing mixed signals, but the brake lights have remained on for seven of the last eleven sessions.
Two weeks ago on Wednesday NVDA gapped up along with the rest of the markets in the wake of the U.S. Presidential Election results & continued higher Thursday.
It should be noted that these volumes were muted compared to the rest of the prior year though, not indicating as much enthusiasm as most other indexes/securities.
That Friday’s declining session on a spinning top set the stage for the next week of declines, as it showed market participants were taking profits on the day of the all-time high, and there was clear uncertainty as to where the price should be.
Volume was low that day, but the seller sentiment carried on into Monday of the new week, when a bearish engulfing candle set up a three-day consolidation that took place mostly within the range of its candle’s real body.
Tuesday’s candle would constitute as a shooting star had it followed an uptrend (bearish), Wednesday’s candle formed a bearish engulfing pattern on Tuesday’s & a bearish harami was formed when Thursday’s candle advanced, but closed lower than it opened & the entire day’s range was contained within Wednesday’s real body.
None of this inspired enthusiasm among market participants, as Friday opened on a gap down in-line with the 10 day moving average’s support, before continuing lower & the lower shadow of the day’s range flirted with the $140/share level.
Monday opened lower & below the $140 mark, tested lower, but was able to close above its open, but still for a loss.
Those two days also featured some of the strongest volume of November, indicating that there was a bit of a switch in sentiment.
Yesterday featured an advancing session that was able to close above the resistance of the 10 DMA, but today has featured an open higher than yesterday that has fallen apart quickly as prices have only continued lower throughout the day since the open.
As of this writing (1:45pm) volume is roughly half of yesterday’s low level, so market participants are still sitting in anticipation of tonight’s results.
After NVDA’s aggressive gap ups in May 2024 they have somewhat traded in a consolidated range & gradually shifted higher in a similar manner to how IWM trades, which is peculiar given their market cap vs. the highest market cap in the Russell 2000.
This will be one of the most anticipated earnings reports of the past few years & there are lots of warning signs/brake lights flashing as we approach it.
I won’t get into the upside potential given how close we are to their ATH, but the downside is where more focus should be given it is relatively measurable.
The section below lays out how the buyers & sellers have met at each price level NVDA has traded at over the past ~8 months.
While it is not indicative of future performance, history repeats itself & or rhymes & this can be used as a barometer to anticipate how market participants may behave when faced with these price levels again.
Price Level:Volume Sentiment Analysis For NVIDIA Corp. NVDA Stock
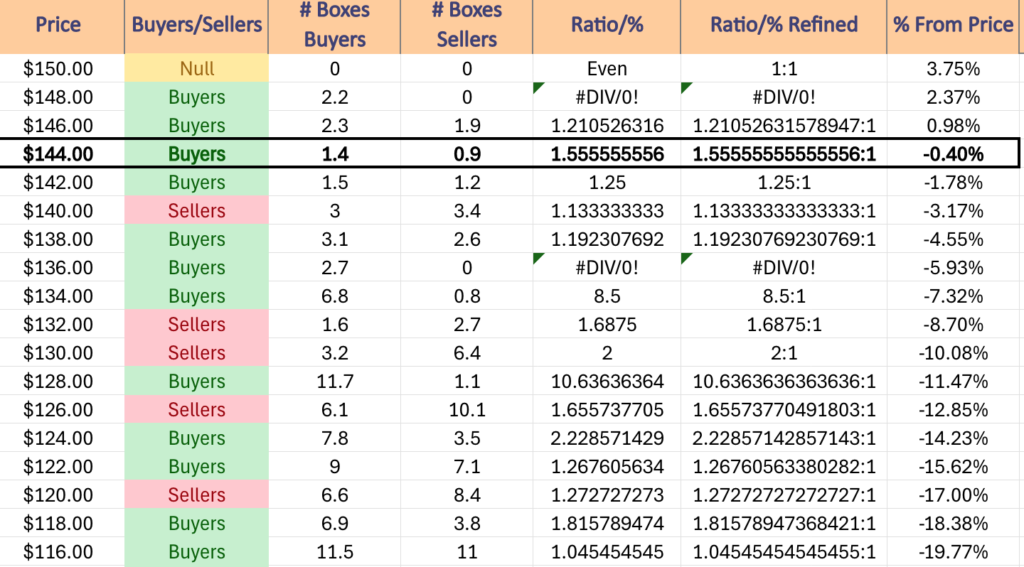
The top table below shows the support & resistance levels of NVDA from the past year’s chart, as well as their price level:volume sentiment at each from data covering the past ~8 months, using Wednesday 11/20/24’s mid-session price for their price & moving averages/other technicals.
The moving averages are denoted with bold.
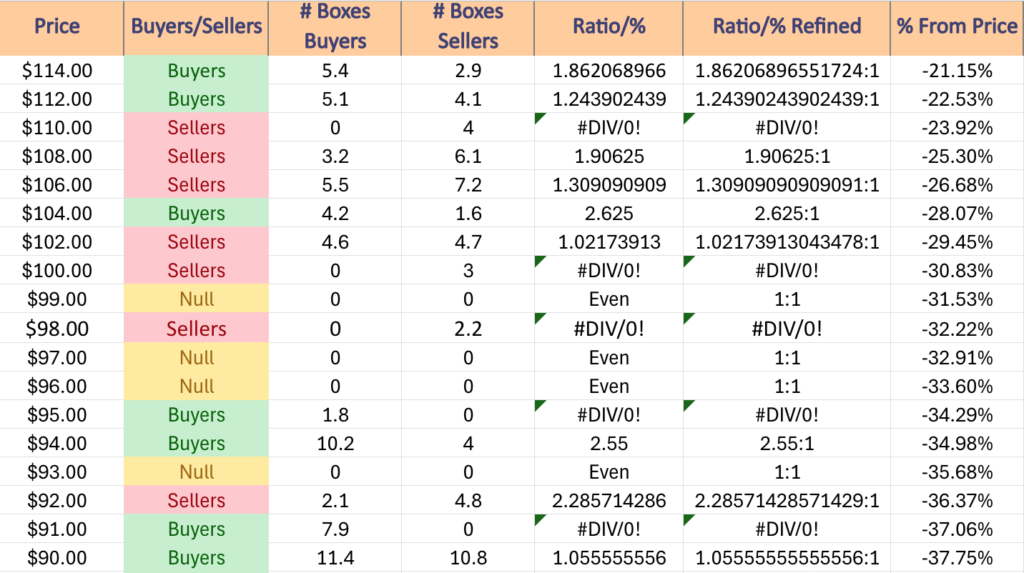
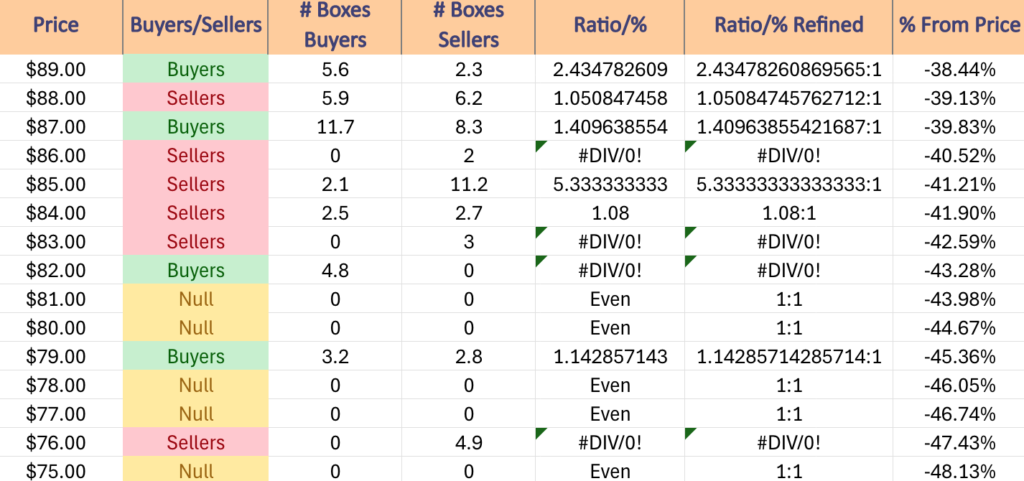
The next charts show the volume sentiment at each individual price level NVDA has traded at over the past ~8 months.
Beneath them is a copy & pasteable list of the same data, where the support/resistance levels are denoted in bold.
All ratios with “0” in the denominator are denoted with a “*”.
NULL values are price levels that had limited trading volume, whether it be due to gaps, quick advances or they are at price extremes; in the event that they are retested & there is more data they would have a distinct “Buyers”, “Sellers” or “Even” title.
This is not intended as financial advice, but rather another tool to consider when performing your own research & due diligence on NVDA.


$150 – NULL – 0:0*, +3.75% From Current Price Level
$148 – Buyers – 2.2:0*, +2.37% From Current Price Level – All Time High*
$146 – Buyers – 1.21:1, +0.98% From Current Price Level
$144 – Buyers – 1.56:1, -0.4% From Current Price Level – Current Price Level & 10 Day Moving Average**
$142 – Buyers, 1.25:1, -1.78% From Current Price Level
$140 – Sellers – 1.13:1. -3.17% From Current Price Level
$138 – Buyers – 1.19:1, -4.55% From Current Price Level
$136 – Buyers – 2.7:0*, -5.93% From Current Price Level
$134 – Buyers – 8.5:1, -7.32% From Current Price Level
$132 – Sellers – 1.69:1, -8.7% From Current Price Level – 50 Day Moving Average*
$130 – Sellers – 2:1, -8.7% From Current Price Level
$128 – Buyers – 10.64:1, -10.08% From Current Price Level
$126 – Sellers – 1.66:1, -11.47% From Current Price Level
$124 – Buyers – 2.23:1, -12.85% From Current Price Level
$122 – Buyers – 1.27:1, -14.23% From Current Price Level
$120 – Sellers – 1.27:1, -15.62% From Current Price Level
$118 – Buyers – 1.82:1, -17% From Current Price Level
$116 – Buyers – 1.05:1, -18.38% From Current Price Level
$114 – Buyers – 1.86:1, -21.15% From Current Price Level
$112 – Buyers – 1.24:1, -22.53% From Current Price Level
$110 – Sellers – 0.4:0*, -23.92% From Current Price Level – 200 Day Moving Average*
$108 – Sellers – 1.91:1, -25.3% From Current Price Level
$106 – Sellers – 1.31:1, -26.68% From Current Price Level
$104 – Buyers – 2.63:1, -28.07% From Current Price Level
$102 – Sellers – 1.02:1, -29.45% From Current Price Level
$100 – Sellers – 3:0*, -30.83% From Current Price Level
$99 – NULL – 0:0*, -31.53% From Current Price Level
$98 – Sellers – 2.2:0*, -32.22% From Current Price Level
$97 – NULL – 0:0*, -32.91% From Current Price Level
$96 – NULL – 0:0*, -33.6% From Current Price Level
$95 – Buyers – 1.8:0*, -34.29% From Current Price Level
$94 – Buyers – 2.55:1, -34.98% From Current Price Level
$93 – NULL – 0:0*, -35.68% From Current Price Level
$92 – Sellers – 2.29:1, -36.37% From Current Price Level
$91 – Buyers – 7.9:0*, -37.06% From Current Price Level
$90 – Buyers – 1.06:1, -37.75% From Current Price Level
$89 – Buyers – 2.43:1, -38.44% From Current Price Level
$88 – Sellers – 1.05:1, -39.13% From Current Price Level
$87 – Buyers – 1.41:1, -39.83% From Current Price Level
$86 – Sellers – 2:0*, -40.52% From Current Price Level
$85 – Sellers – 5.33:1, -41.21% From Current Price Level
$84 – Sellers – 1.08:1, -41.9% From Current Price Level
$83 – Sellers – 3:0*, -42.59% From Current Price Level
$82 – Buyers – 4.8:0*, -43.28% From Current Price Level
$81 – NULL – 0:0*, -43.98% From Current Price Level
$80 – NULL – 0:0*, -44.67% From Current Price Level
$79 – Buyers – 1.14:1, -45.36% From Current Price Level
$78 – NULL – 0:0*, -46.05% From Current Price Level
$77 – NULL – 0:0*, -46.74% From Current Price Level
$76 – Sellers – 4.9:0*, -47.43% From Current Price Level
$75 – NULL – 0:0*, -48.13% From Current Price Level
*** I DO NOT OWN SHARES OR OPTIONS CONTRACTS IN NVDA AT THE TIME OF PUBLISHING THIS ARTICLE ***