This week I took a look at United Guardian Inc., a micro-cap stock whose ticker is $UG. UG closed for trading on 4/24/20 at $14.70/share, with a Price/Earnings (ttm) of 14.1.
United Guardian Inc. UG’s Stock Fundamentals
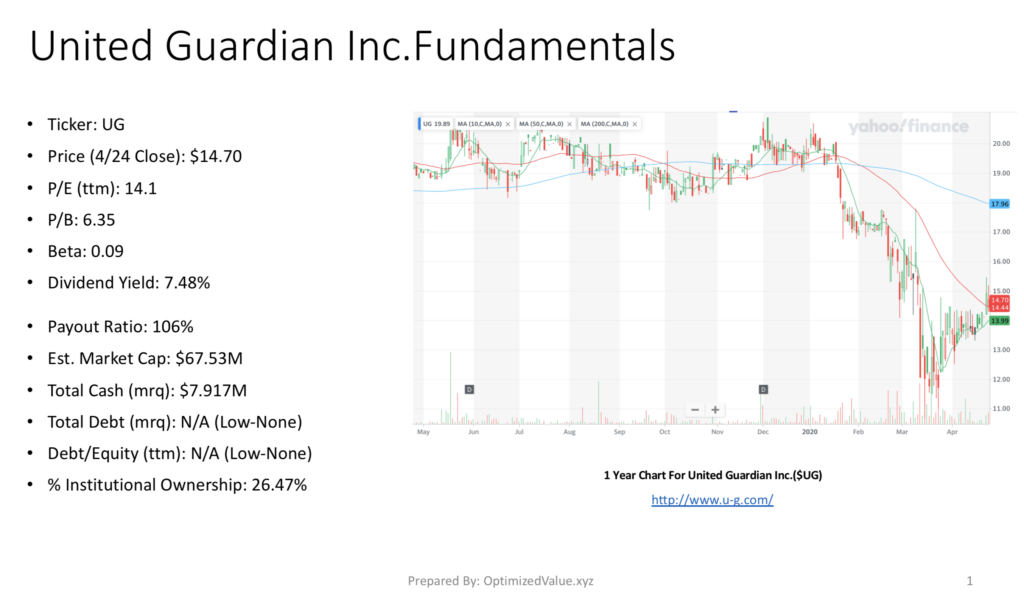
UG’s P/B (ttm) is 6.35, and they offer an attractive 7.48% Dividend Yield. Their Beta is low, at 0.09, which is to be expected as their Market Cap is ~$67.53M, so they most likely move on their own news, with some sector momentum included.
An interesting observation I made here is that they have little-to-no debt, and while they only have $7.92M Total Cash (mrq), their higher-than-average Dividend Payout Ratio of 106% may have more options than other companies who face similarly high Payout Ratios.
They have 26.47% Institutional Ownership, which also makes sense given their small size does not enable larger investors to make as large of a profit based on their limited lot size.
Comparing United Guardian Inc. UG’s Stock With The Consumer Staples Sector
United Guardian Inc.’s Stock Fundamentals are very attractive when compared to the Consumer Staples Sector averages.
UG’s Price/Share is 66% less than the sector average, with a 49.8% lower P/E (ttm) & 92.6% lower P/B than the average for the sector.
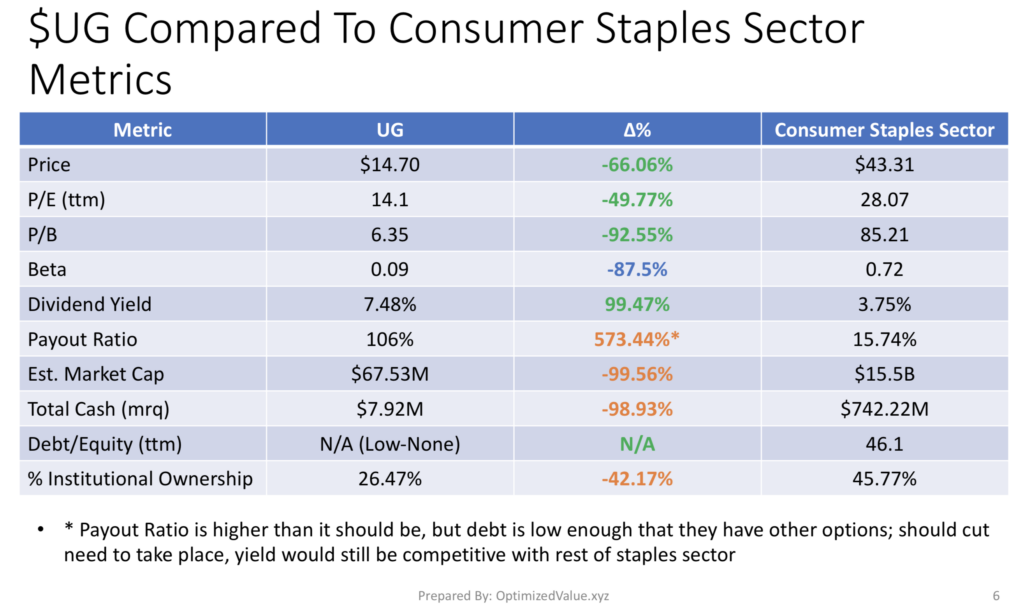
Their Dividend Yield is 99.5% higher than the sector average, and although their Payout Ratio is 573% above average, it’s limited debt offer more flexibility in how they can approach fixing this should the problem persist long-term.
As a very small micro-cap stock, their Estimated Market Cap is 99.6% lower than average, and their Total Cash (mrq) is 98.9% lower than the averages.
As a result, UG’s stock % Institutional Ownership is 42% lower than the Consumer Staples Sector average, and their Beta is 87.5% lower than average.
United Guardian Inc. UG’s Stock Fundamentals Compared To The Personal Products Industry
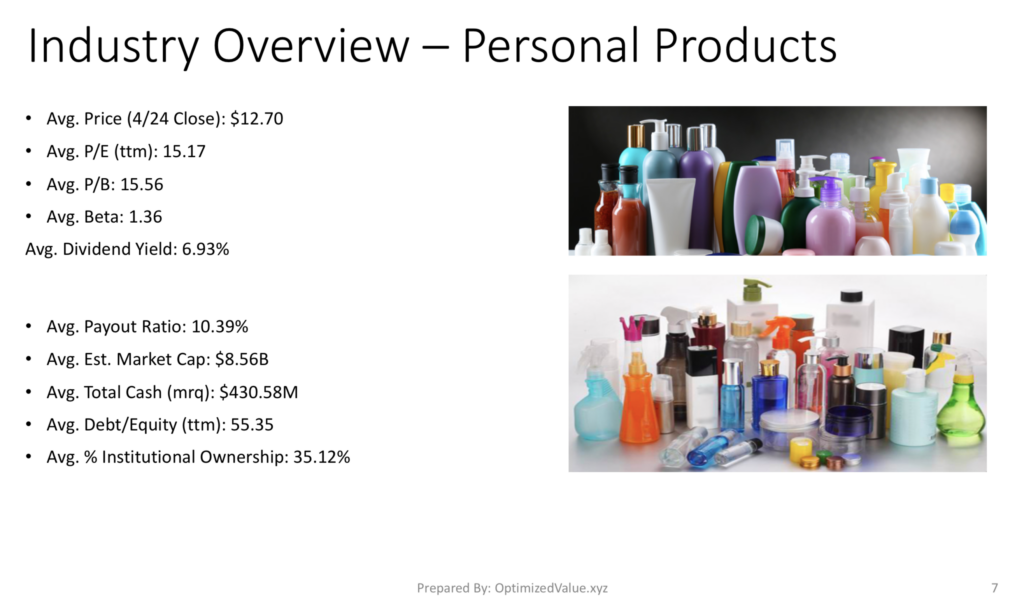
United Guardian Inc. offers many advantageous fundamentals when compared to the Personal Products Industry averages.
Their Price/Share is 15.8% lower than average, with a 20.2% lower P/E (ttm) & 59.2% P/B.
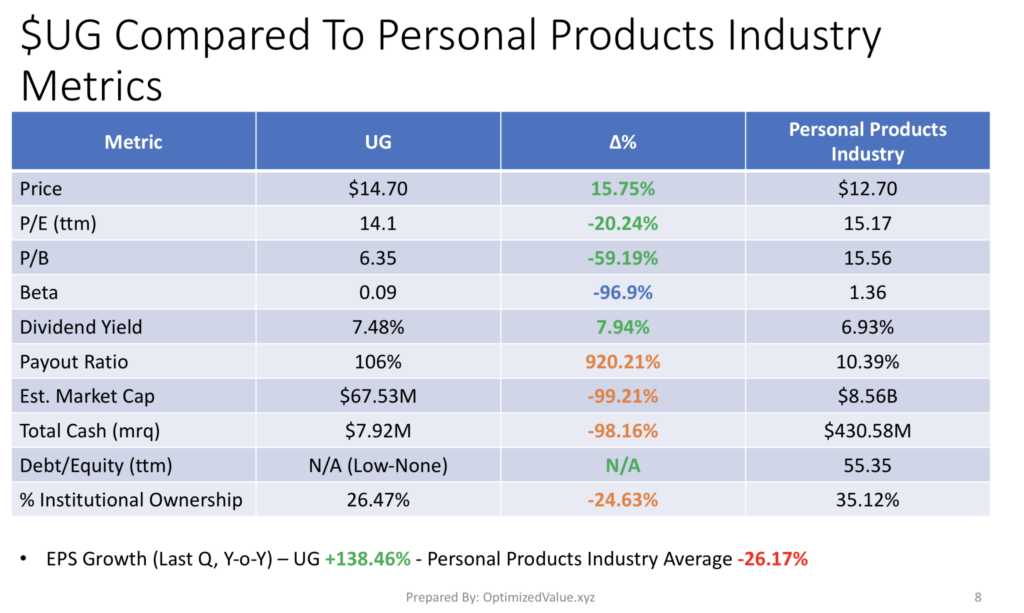
An interesting stat I came across while looking at these numbers was that UG’s EPS Growth for last quarter is +138.46% Y-o-Y, while the rest of the sector declined 26.2%.
UG’s Dividend Yield is 7.94% higher than the Industry average, with their % Institutional Ownership 24.6% lower.
Much like when compared to their sector averages, UG’s Dividend Payout Ratio is 920% higher than the Personal Products Industry average, and their Market Cap is 99% less than average, with a 98% less than average Total Cash amount.
United Guardian Inc. UG’s Technicals & Chart
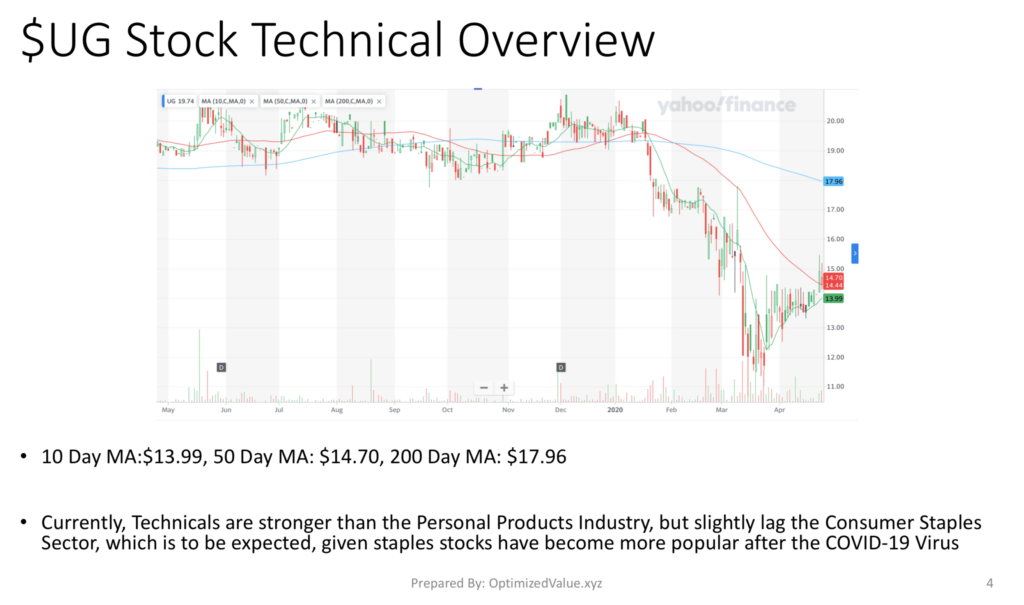
UG’s stock 10-Day Moving Average is 13.99, with their 50-Day MA at 14.70 & their 200-Day MA at 17.96.
While I’m not involved in the stock, it may become interesting once it gets between $12-12.50/share.
United Guardian Inc.’s Stock Growth Story
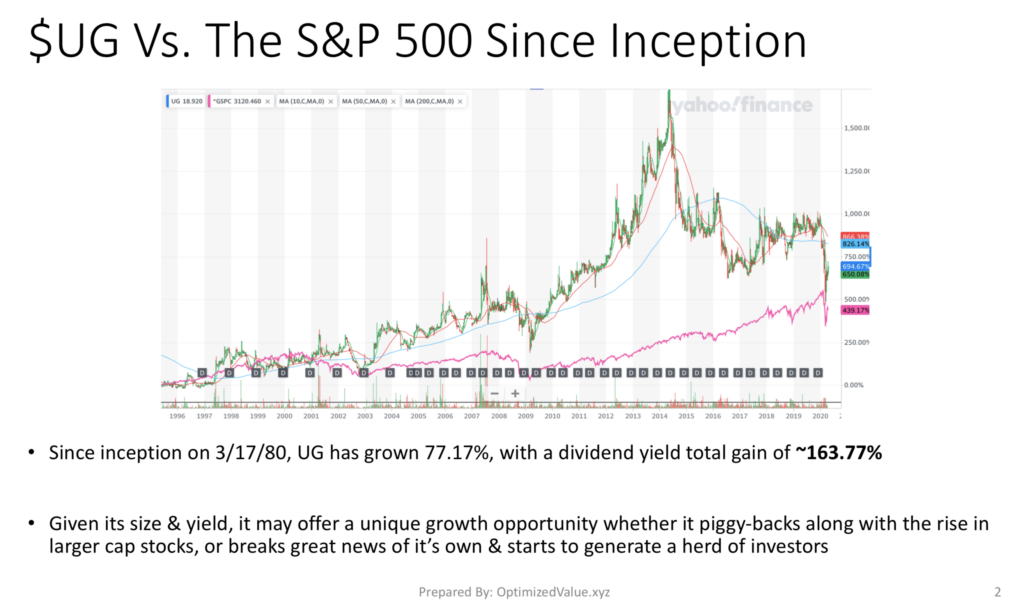
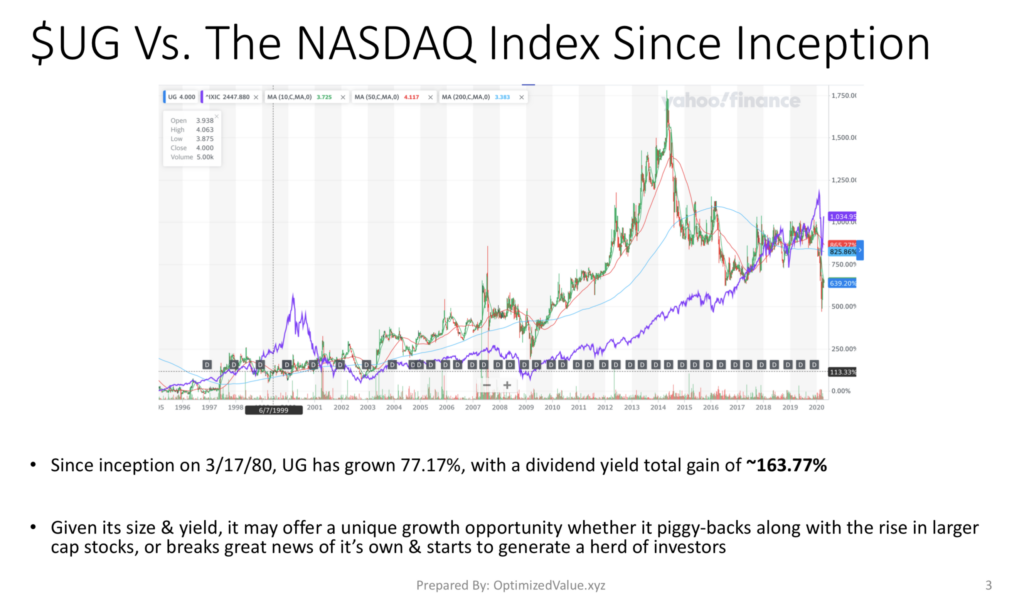
Since they became publicly traded on 3/17/1980, UG has grown by 163.77% including dividends collected, but not including the value of their three historic stock splits.
They do not explicitly outperform the S&P 500 or NASDAQ Indexes as they are a much smaller company than most, however, they do offer positive growth & a good return for a small sized position.
They also continue to return value to their shareholders by paying out their dividend twice per year.
Tying It All Together
UG’s stock offers a lot of interesting fundamental growth opportunities. When compared to their sector & industry they are below almost all of the averages that we examined.
Another excellent point that is becoming even more important in economic times like these is their low-level/lack of debt.
This is increasingly rare, and if they’re able to provide a 7%+ cushion via yield, they are strategically ready to weather more storms than most other companies.
As mentioned before, I am not in this name, but would consider building a position once they re-enter the $12-12.50/share range.
United Guardian Inc. Stock may be worth looking at pending additional research.
For More Notes:
*** I Do not own any shares of UG Stock ***