VIS, the Vanguard Industrials ETF has advanced +20.48% over the past year, climbing +33.23% from their 52-week low in October of 2023 & currently sits only -3.44% below their 52-week high from August of 2024 (ex-distributions).
While they haven’t taken off the same as the high flying semiconductor & A.I. names, they provide key products & services that will be used during the infrastructure build up to support data centers, as well as a number of other every day items that are important.
Some of VIS’s top holdings include GE (3.57%), CAT (3.31%), RTX (2.99%), UNP (2.88%), HON (2.56%), ETN (2.34%), UBER (2.32%), LMT (2.25%), BA (2.12%) & ADP (2.07%).
However, when the Federal Reserve announces that they’ll begin cutting interest rates next week there is risk that VIS & its component stocks will begin to go down, making it important to understand the strength of their support & resistance levels.
Below is a brief review of VIS’s recent technical performance, followed by the volume sentiments for each of the price levels that they have traded at over the past 2-3 years, in order to have an idea as to how they may behave again at these levels.
It is not intended to serve as financial advice, but rather as an additional tool to reference while performing your own due diligence on VIS.
Technical Analysis Of VIS, The Vanguard Industrials ETF
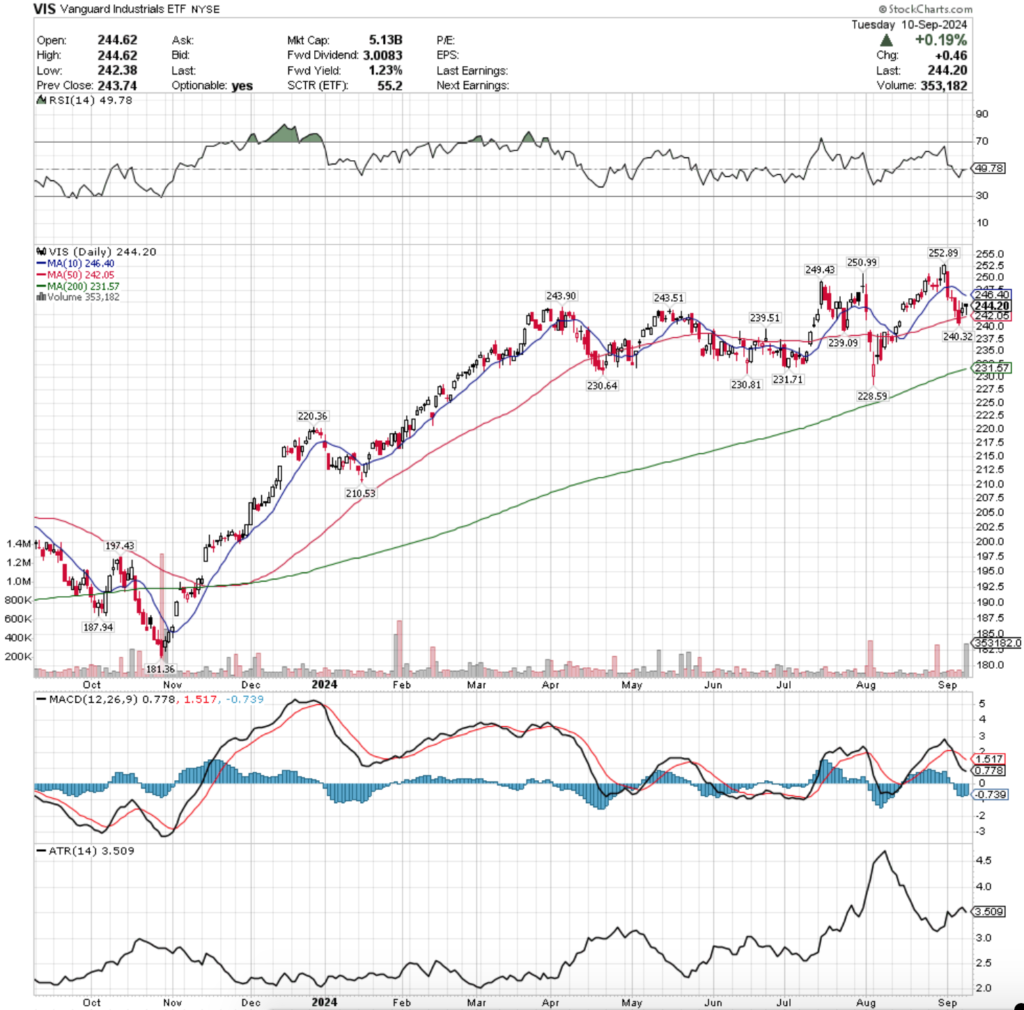
Their RSI is just below the neutral mark of 50 & sits at 49.78, while their MACD is bearish, but curling towards the signal line.
Volumes were +32.35% above average this past week compared to the year prior’s average (118,640 vs. 89,641.55), most due to yesterday’s heavy advancing volume session.
Last week began on the same sour note for VIS as it did for the major market indexes (see: this week’s weekly market review note), as prices broke down & through the support of the 10 day moving average setting up their bearish MACD crossover.
Wednesday the bearishness continued, as the day’s session ended with a gravestone doji, indicating that there was indecision in the air, but still a largely bearish sentiment.
Bleeding for VIS continued into Thursday, as prices continued to decline, but were supported by the 50 day moving average.
Friday he beating continued, as VIS opened lower, was able to test higher through most of Thursday’s range, but ultimately it was a risk-off into the weekend day & the support of the 50 day moving average was broken & the session closed beneath it.
Monday of this week saw a change of fate as bulls rushed back into the market & saw an advancing session for VIS, but the length of the candle’s upper shadow should be a cause for concern as it shows that there was not much confidence to the upside.
The 50 DMA’s support was not tested on Monday, but the candle’s lower shadow came close.
Yesterday resulted in an advancing session for +0.19%, but it came with caution lights flashing, as they day ended with a hanging man candle that closed lower than it opened (bearish implications), both of which negate the bullish implications of the heavy advancing volume.
Heading into this week it will be interesting to see how long the support of the 50 DMA holds up & is able to keep prices moving forward into the closing dome cover of resistance formed by the 10 DMA.
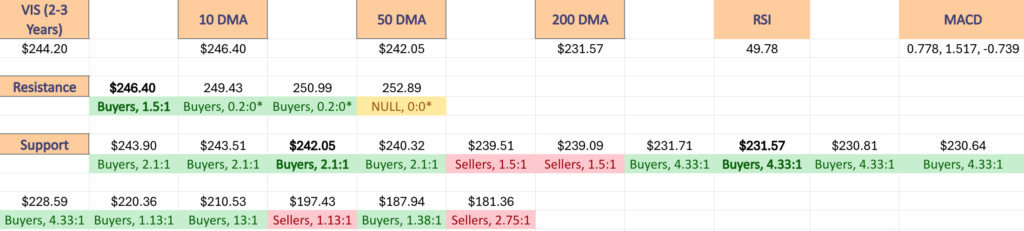
It should be anticipated that prices will not remain above it in the coming days & that the support zone between $239.09-240.32 will then be tested upon the 50 DMA breaking down.
Should this happen it will be cause for concern, as the price levels from $232-239.99 are Seller dominated over the past 2-3 years (1.5:1 & 1.03:1).
This would lead to a test of the 200 day moving average’s support & the support zone from $230.64-231.71, which has been dominated by Buyers 4.33:1 in that same time period.
With that in mind, the next section outlines the volume sentiments for each price level VIS has traded at over the past 2-3 years & the current price level, moving averages & support/resistance levels are also noted.
Price Level:Volume Sentiment Analysis Of VIS, The Vanguard Industrials ETF
The top table below shows the support & resistance levels of VIS from the past year’s chart, as well as their price level:volume sentiment at each, using Tuesday 9/10/24’s closing price.
The moving averages are denoted with bold.
The next charts show the volume sentiment at each individual price level VIS has traded at over the past 2-3 years.
Beneath them is a copy & pasteable list of the same data, where the support/resistance levels are denoted in bold.
All ratios with “0” in the denominator are denoted with a “*”.
NULL values are price levels that had limited trading volume, whether it be due to gaps, quick advances or they are at price extremes; in the event that they are retested & there is more data they would have a distinct “Buyers”, “Sellers” or “Even” title.
This is not intended as financial advice, but rather another tool to consider when performing your own research & due diligence on VIS ETF.
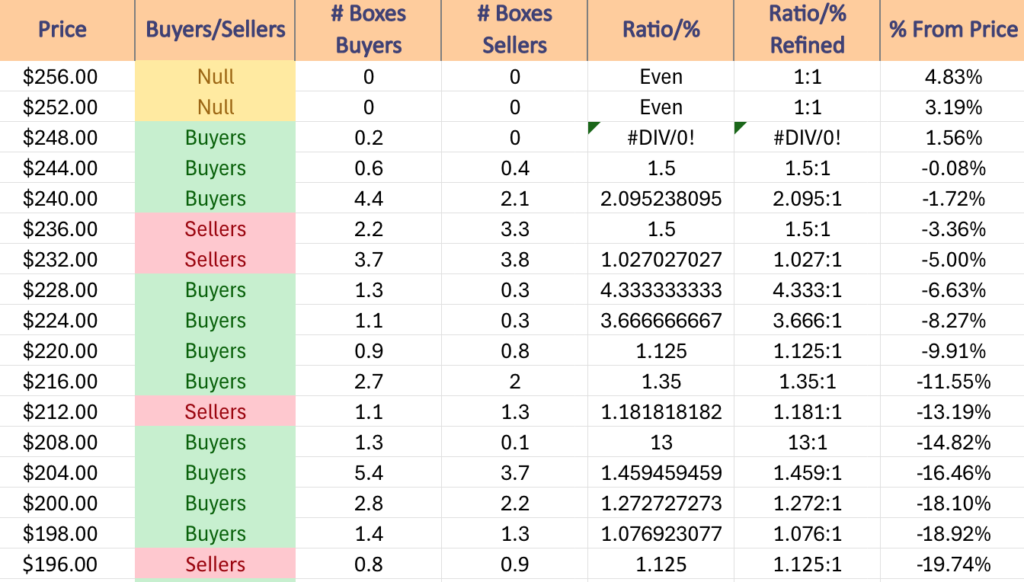
$256 – NULL – 0:0*, +4.83% From Current Price Level
$252 – NULL – 0:0*, +3.19% From Current Price Level
$248 – Buyers – 0.2:0*, +1.56% From Current Price Level
$244 – Buyers – 1.5:1, -0.08% From Current Price Level – Current Price Level & 10 Day Moving Average**
$240 – Buyers – 2.1:1, -1.72% From Current Price Level – 50 Day Moving Average*
$236 – Sellers – 1.5:1, -3.36% From Current Price Level
$232 – Sellers – 1.03:1, -5% From Current Price Level
$228 – Buyers – 4.33:1, -6.63% From Current Price Level – 200 Day Moving Average*
$224 – Buyers – 3.67:1, -8.27% From Current Price Level
$220 – Buyers – 1.13:1, -9.91% From Current Price Level
$216 – Buyers – 1.35:1, -11.55% From Current Price Level
$212 – Sellers – 1.18:1, -13.19% From Current Price Level
$208 – Buyers – 13:1, -14.82% From Current Price Level
$204 – Buyers – 1.46:1, -16.46% From Current Price Level
$200 – Buyers – 1.27:1, -18.1% From Current Price Level
$198 – Buyers – 1.08:1, -18.92% From Current Price Level
$196 – Sellers – 1.13:1, -19.74% From Current Price Level
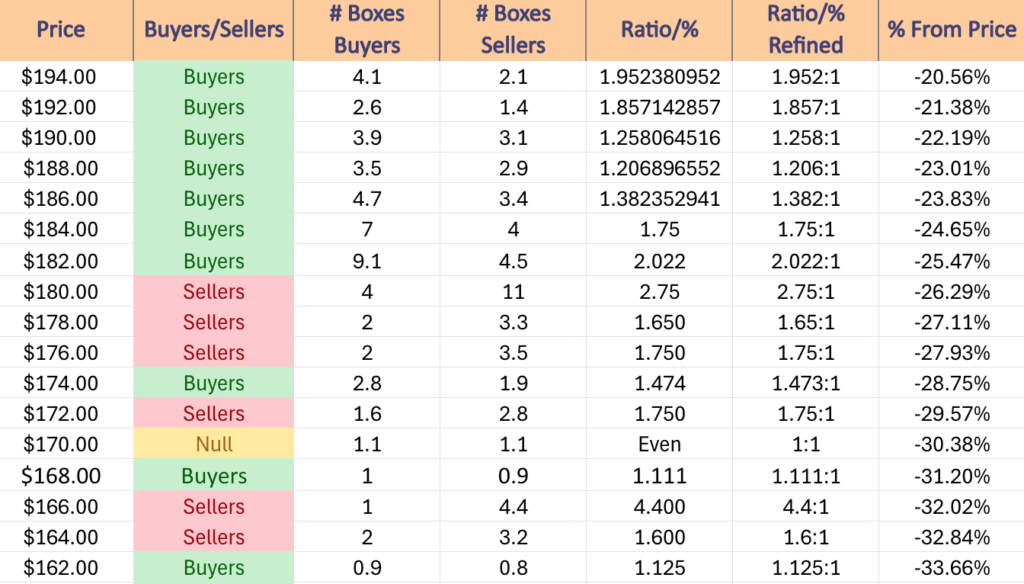
$194 – Buyers – 1.95:1, -20.56% From Current Price Level
$192 – Buyers – 1.86:1, -21.38% From Current Price Level
$190 – Buyers – 1.26:1, -22.19% From Current Price Level
$188 – Buyers – 1.21:1, -23.01% From Current Price Level
$186 – Buyers – 1.38:1, -23.83% From Current Price Level
$184 – Buyers – 1.75:1, -24.65% From Current Price Level
$182 – Buyers – 2.02:1, -25.47% From Current Price Level
$180 – Sellers – 2.75:1, -26.29% From Current Price Level
$178 – Sellers – 1.65:1, -27.11% From Current Price Level
$176 – Sellers – 1.75:1, -27.93% From Current Price Level
$174 – Buyers – 1.47:1, -28.75% From Current Price Level
$172 – Sellers – 1.75:1, -29.57% From Current Price Level
$170 – Even – 1:1, -30.38% From Current Price Level
$168 – Buyers – 1.11:1, -31.2% From Current Price Level
$166 – Sellers – 4.4:1, -32.02% From Current Price Level
$164 – Sellers – 1.6:1, -32.84% From Current Price Level
$162 – Buyers – 1.13:1, -33.66% From Current Price Level
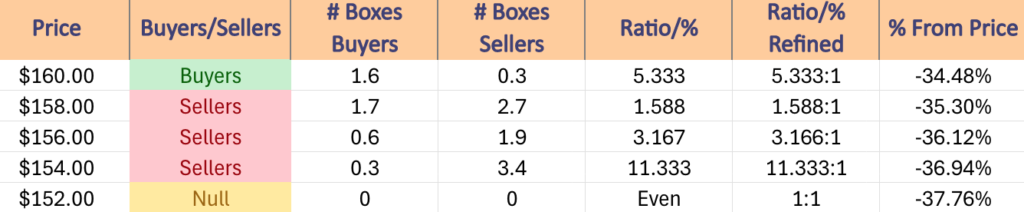
$160 – Buyers – 5.33:1, -34.48% From Current Price Level
$158 – Sellers – 1.59:1, -35.3% From Current Price Level
$156 – Sellers – 3.17:1, -36.12% From Current Price Level
$154 – Sellers – 11.33:1, -36.94% From Current Price Level
$152 – NULL – 0:0*, -37.76% From Current Price Level
*** I DO NOT OWN SHARES OR OPTIONS CONTRACT POSITIONS IN VIS AT THE TIME OF PUBLISHING THIS ARTICLE ***