SPY, the SPDR S&P 500 ETF finished the third consecutive four day shortened week -1.94%, while the VIX closed at 19.54, indicating an implied one day move of +/-1.23% & an implied one month move of +/-5.65%.
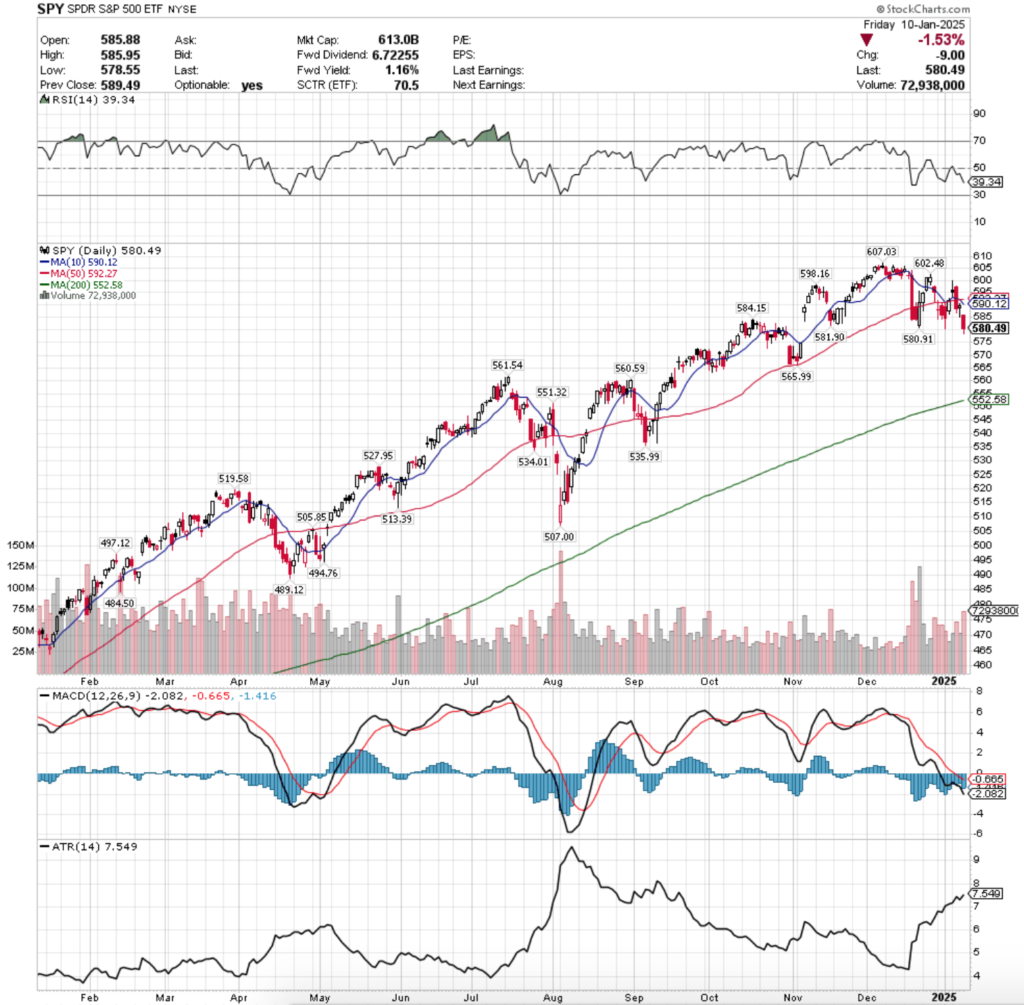
Their RSI is trending down closer to oversold territory & sits currently at 39.34, while their MACD continues bearishly lower as it has been since early December.
Volumes were +1.03% above the previous year’s average level (57,120,000 vs. 56,537,421), which should cause concern for market participants, given that most of the volume was declining & it was in a short week.
Also, as has been noted over the past nine months, volumes as a whole for all of the major index ETFs for the most part have been markedly lower since April 19,2024, so the fact that this week was slightly above average SPY volume is really not a great sign.
Monday set the tone for a week of continued weakness for SPY, as a light volume session opened on a gap up above the 10 & 50 day moving averages’ resistance, only to result in a spinning top candle, who closed lower than it opened, in a move that does not inspire confidence.
It’s upper shadow showed that there was some interest in the $600/share mark at one point during the day, but that profits were quickly taken & there was a test of the 10 DMA’s support that held up for the day.
There was quite a bit of uncertainty floating around in SPY & its components in a shortened week before earnings season begins again.
Tuesday the floor fell out, as SPY opened higher, but proceeded to sink below both the 10 & 50 day moving averages’ support & continue lower, with the lower shadow indicating that there was still some appetite to push prices lower than where they wound up closing at, which occurred on the second highest volume of the week.
People were clearly deciding it time to cash in their chips & take their profits given the higher than normal volume of the week noted above.
Wednesday has similar low volumes as Monday, and the day’s candle continued painting the grim outlook for SPY, as while the day opened higher, it quickly showed that investors had their eyes set on the $585/share level & temporarily dropped that low before being squeezed higher to close the day with a slight advance.
It should be noted that the 10 DMA crossed bearishly through the 50 DMA on Wednesday as well, signaling that there will be a rocky couple of weeks ahead of us for SPY.
Friday confirmed that, when the week’s highest volume session came on a declining day that opened above $585, but barreled down to close at $580.49 by the end of the day, with the lower shadow indicating that there was appetite for SPY <$580/share.
In terms of what to watch for this week, much of last week’s same themes continue, as there are little upside catalysts, unless earnings reports mid-week from the big banks stun investors positively, which seems increasingly less likely.
Even should we get a pleasant surprise, the current upside view is hinged upon the 10 & 50 DMAs’ resistance, which are now both bearing down on price as investors have already signaled that they don’t mind pushing SPY into the $575 price block.
Another thing to be mindful of is that over the past ~2 years SPY when trading between $580-584.99/share has been dominated by Sellers at the rate of 2.1:1 & that is the price block they closed in on Friday.
As was alluded on last week, there are now no support levels until $565.99/share, which presents a new problem for SPY.
In the table below you can see that the $570-574.99/share zone is Buyer dominated 5.33:1, but there are no support levels in that zone, leading SPY into a Seller dominated zone where the ratio is 1.53:1.
Should that support level break down the next is $561.54, which occurs in a Buyer dominated zone where the ratio is 0.8:0*, indicating that sellers have not historically been active in this price zone.
Typically these zones get retested & there will be more declining volume, which suddenly leaves SPY with the $560.59/share support level & then the 200 day moving average, which represents the long-term trend.
While the decline from Friday’s closing price to hit the 200 DMA is -4.81%, it is something to keep an eye out for as we descend into an anticipated earnings season.
Unless there is a major change in advancing volume levels it seems unlikely that there will be any sturdy upside move in the coming week, and should there be one the 10 & 50 DMAs’ resistance will also need to be broken through, which seems unlikely after the past few weeks.
At best, perhaps price will straddle/oscillate around the 10 DMA.
SPY has support at the $565.99 (Volume Sentiment: Sellers, 1.53:1), $561.54 (Volume Sentiment: Buyers, 0.8:0*), $560.59 (Volume Sentiment: Buyers, 0.8:0*) & $552.58/share (200-Day Moving Average, Volume Sentiment: Buyers, 1.25:1) price levels, with resistance at the $580.91 (Volume Sentiment: Sellers, 2.1:1), $581.90 (Volume Sentiment: Sellers, 2.1:1), $584.15 (Volume Sentiment: Sellers, 2.1:1) & $590.12/share (10 Day Moving Average, Volume Sentiment: Buyers, 4.2:1) price levels.

QQQ, the Invesco QQQ Trust ETF finished the week down -2.2%, as the tech-heavy NASDAQ index saw even more selling than SPY.
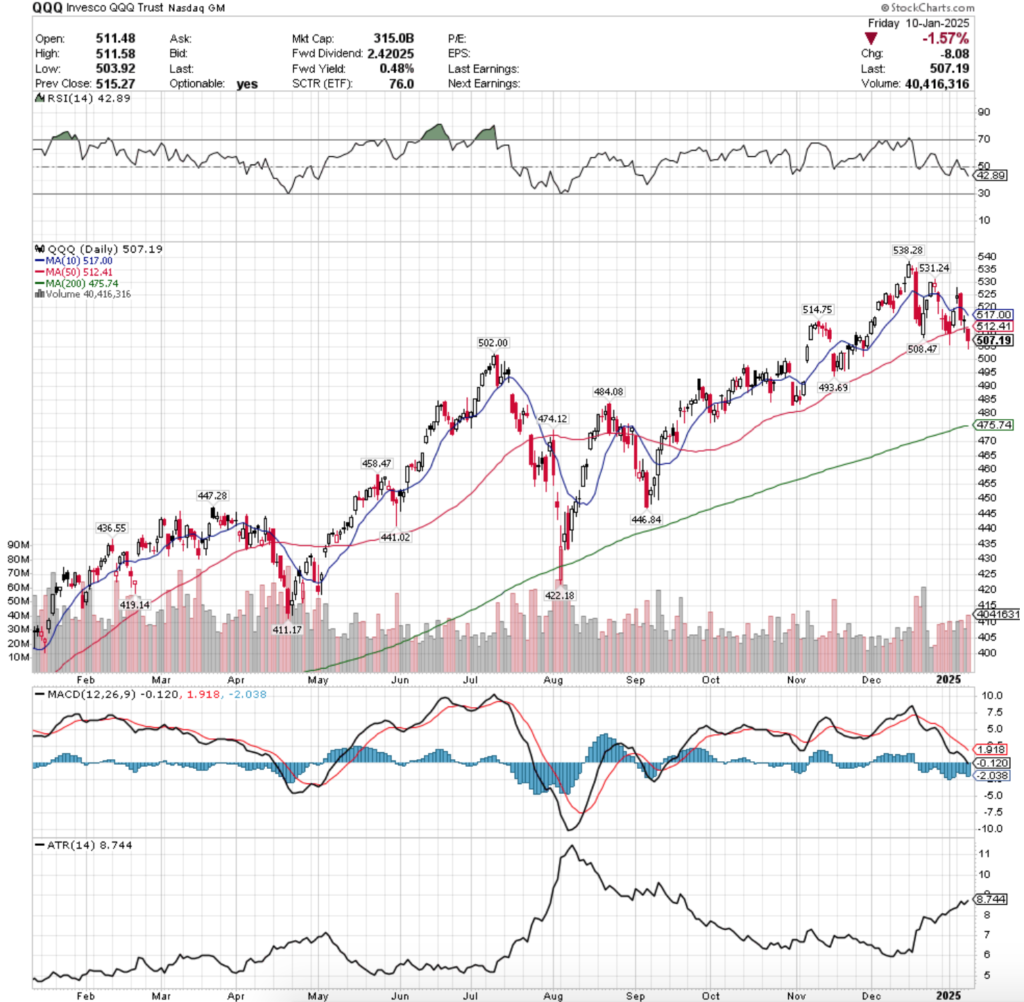
Their RSI is also downtrending & sits at 42.89, while their MACD continues to bearishly decline.
Volumes were -2.28% lower than the previous year’s average level (36,027,500 vs. 36,869,643), which is cause for concern similar to SPY’s, given that this occurred on a short week.
Again, while average volume levels of the past year have become diluted compared to what they were when running the same exercise nine months ago, these “high” levels are cause for concern given that they’re occurring on declining weeks at somewhat pivotal points on their one year charts.
Much like SPY, QQQ opened the week up on unstable footing, with a spinning top candle on Monday that had long upper & lower shadows indicating that there was a lot of tug of war taking place between bulls & the bears.
Tuesday the floor fell out from under QQQ, as the day opened higher, but on the week’s second highest volume their price crashed through the 10 day moving average’s support & their candles’s lower shadow showed that there was appetite for taking on the 50 DMA as well.
Wednesday confirmed this, when the day wound up temporarily breaking down through the 50 DMA, but was able to close as a doji that closed lower than it has opened, indicating weakness, especially when combined with the low volume.
Friday the session opened on a gap down to below the 50 DMA & never tested its resistance level, and continued to decline lower, with a lower shadow indicating that there is likely more downside movement on the horizon in the coming week(s).
As we’ve been saying for months, QQQ & SPY have been trading quite similarly to one another & what to look for this week is similar between the two.
On each ETF’s chart there is an emerging bearish head & shoulders pattern, which appears to be continuing into this new week.
QQQ’s 10 DMA will cross bearishly through their 50 DMA as well by Wednesday, which will apply downwards pressure on the price, leading to their 200 DMA, the long-term trend, which is currently their fourth support level from Friday’s closing price.
Their 200 DMA is -6.2% below Friday’s closing price, which will make for an interesting test against the long-term trend should they meet again like they did temporarily in August (recall they barely came out of that ahead).
Prices are likely to fluctuate around between the 200, 50 & 10 DMAs in the coming week in a form of consolidation.
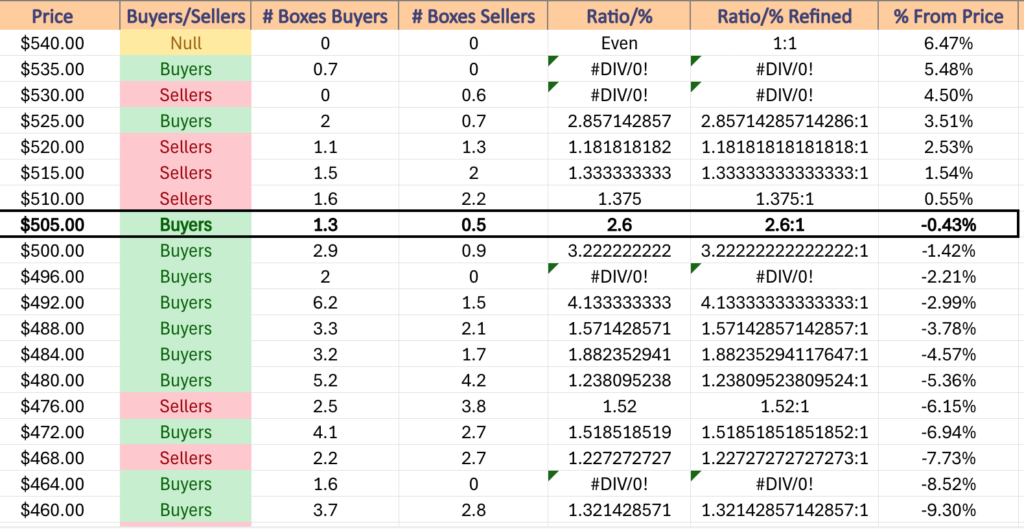
Referencing the data below re: volume sentiments appears like a rosy picture at first, but aside from the $492-495.99/share zone there is not a whole lot of support, particularly when you break down how untested many of the price levels below are.
Any type of upside movement will likely be straddling/oscillating around the 10 DMA, as unless there is significant advancing volume there doesn’t appears to be much left in the tank to retest QQQ’s all-time high.
QQQ has support at the $502 (Volume Sentiment: Buyers, 3.22:1), $493.69 (Volume Sentiment: Buyers, 4.13:1), $484.08 (Volume Sentiment: Buyers, 1.88:1) & $475.74/share (200-Day Moving Average, Volume Sentiment: Buyers, 1.52:1) price levels, with resistance at the $508.47 (Volume Sentiment: Buyers, 2.6:1), $512.41 (50-Day Moving Average, Volume Sentiment: Sellers, 1.38:1), $514.75 (Volume Sentiment: Sellers, 1.38:1) & $517/share (10-Day Moving Average, Volume Sentiment: Sellers, 1.33:1) price levels.
IWM, the iShares Russell 2000 ETF declined -3.39%, as the small cap index was the least favored of the major four index ETFs last week.
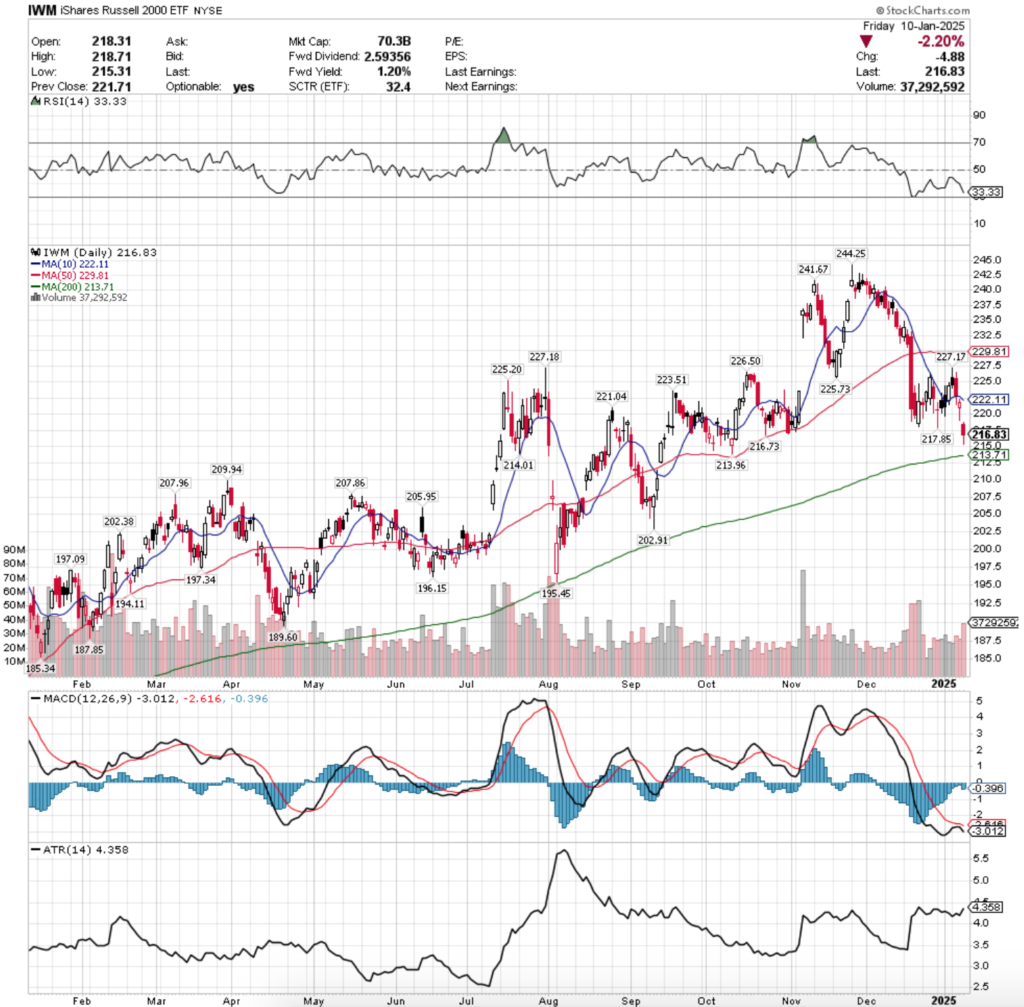
Their RSI is trending down towards the oversold 30 mark & sits at 33.33, while their MACD continues its descent lower.
Volumes were -6.52% lower than the previous year’s average (29,140,000 vs. 31,172,738), which is sending a bearish signal given that 20% of the trading week didn’t take place & the week resulted in declines; people wanted out.
Monday opened up similar to QQQ & SPY, where low volumes & wide daily ranges ran supreme, but IWM’s session managed to close lower than it opened, a bearish signal.
Tuesday the bleeding really started, as the day opened within the prior day’s range made an upwards move but was quickly halted only to break down below the 10 day moving average’s support, and barely being able to rally up to close in-line with it on the second highest volume of the week.
Wednesday this theme continued, as the session opened on a gap down & while it managed to close higher than it opened, and the low volumes made it near impossible for IWM to run at the 10 day moving average’s resistance.
Friday this continued, with another gap down which brought IWM’s price +1.46% above the 200 day moving average, making the long-term trend beginning to look in danger.
Friday’s volume being the highest of the week is also a troubling issue, as it does begin to make the long-term trend look in danger of breaking down.
As mentioned above, there also appears to be a bearish head & shoulders emerging which will require some heavy advancing volume to break out of to the upside.
It should be noted too that the 4th support level for IWM is also their 200 DMA, much like SPY & QQQ.
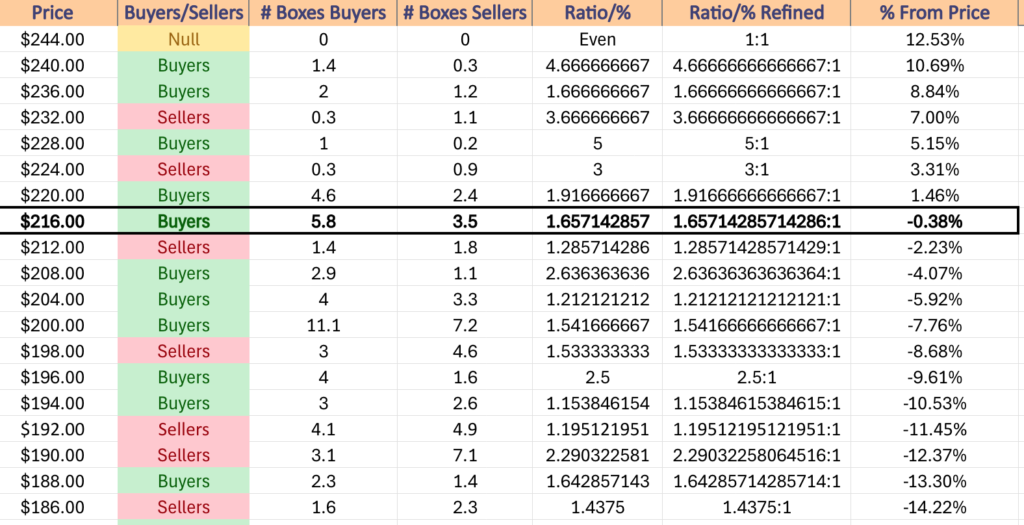
This week it will be important to keep an eye out on how the price interacts with the 200 DMA’s support & the descending 10 & 50 DMAs above them.
So far in 2024 IWM managed to stay above the 200 DMA’s support, but this is looking like that may break down in the event of a retest, particularly as their all-time high took place only a month ago.
Volume sentiment also suggests that the trend may break down, given that the $212-215.99/share price level is Seller dominated 1.29:1.
Should that break down the $208-211.99/share zone is the strongest Buyer zone nearby for IWM, which will need to hold up should the $209.94/share support level be tested again.
IWM has support at the $216.73 (Volume Sentiment: Buyers, 1.66:1), $214.01 (Volume Sentiment: Sellers, 1.29:1), $213.96 (Volume Sentiment: Sellers, 1.29:1) & $213.71/share (200-Day Moving Average, Volume Sentiment: Sellers, 1.29:1) price levels, with resistance at the $217.85 (Volume Sentiment: Buyers, 1.66:1), $221.04 (Volume Sentiment: Buyers, 1.92:1), $222.11 (10-Day Moving Average, Volume Sentiment: Buyers, 1.92:1) & $223.51/share (Volume Sentiment: Buyers, 1.92:1) price levels.
DIA, the SPDR Dow Jones Industrial Average ETF dropped -1.83% last week, as even the blue chip index saw investors creeping towards the door & taking profits.
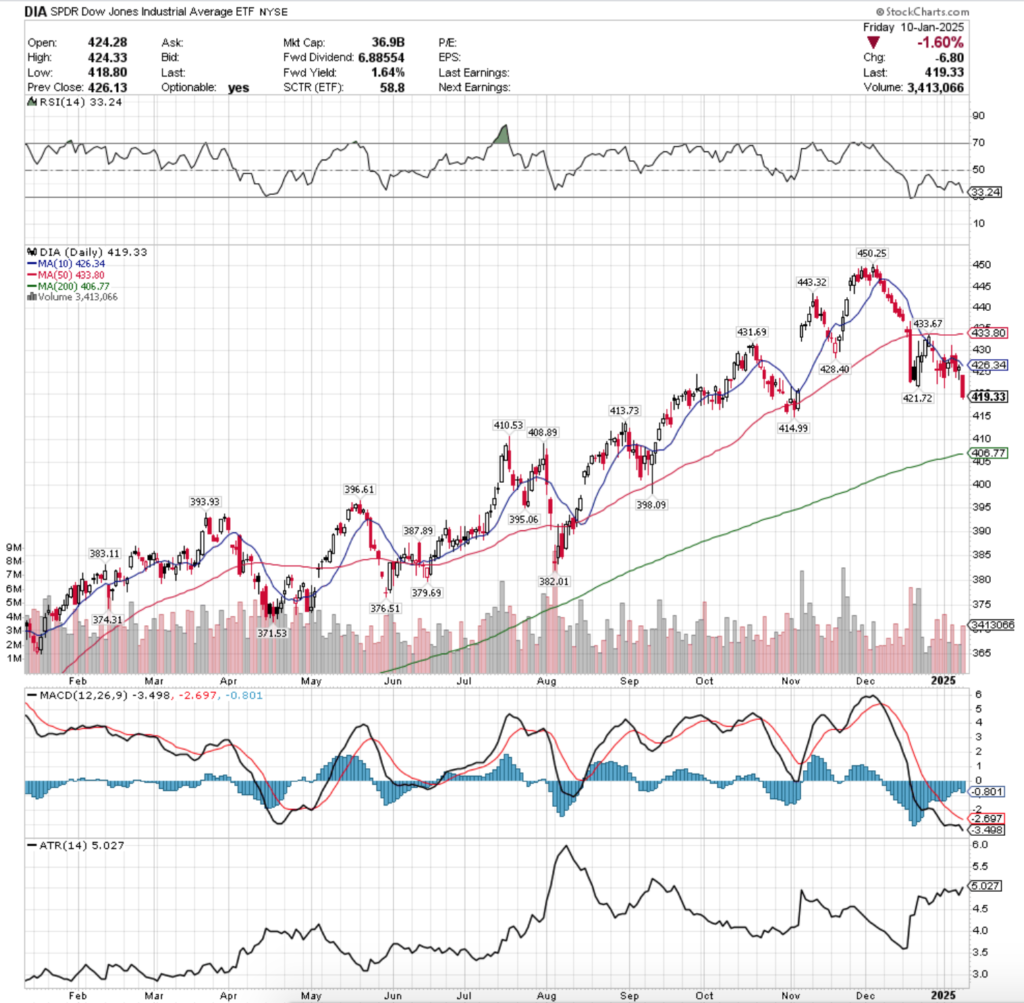
Their RSI is also trending down towards the oversold level much like IWM & sits at 33.24, while their MACD continues to sink lower.
Volumes were -18.58% lower than the previous year’s average (2,737,500 vs. 3,362,341), which signals that market participants are really getting anxious & there’s a bit of fear in the air.
Monday began on a high volume sell-off (relative to the rest of the week) where the 10 DMA’s support broke down.
Tuesday managed to open above the 10 DMA, but quickly ducked bath beneath it & that theme carried out throughout the week based on the downside appetite shown by the candle’s lower shadow.
Wednesday the bleeding took a short pause on low volume, and the spinning top candle showed that there was quite a bit of uncertainty in the air, especially as the session did not advance much at all towards the 10 DMA’s resistance.
Friday the pain continued, on a gap down session that wound up taking -1.6% off of DIA’s price on high volume for the week.
In the week ahead it will be beneficial to keep an eye out on for how the price moves in relation to the resistance of the 10 & 50 DMAs above, as well as how far above its 200 DMA’s support it can stay before a retest.
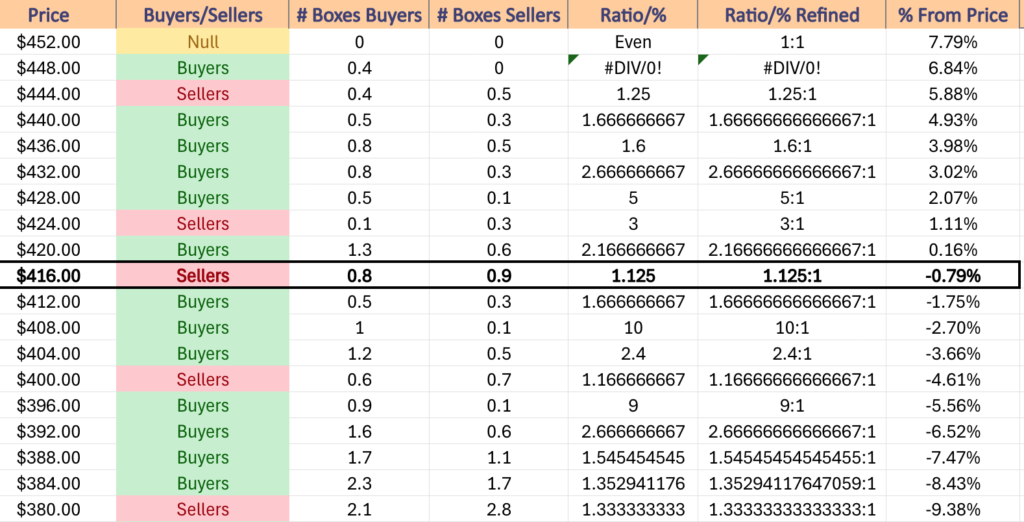
DIA is further from its long-term trend line vs. the previous three mentioned index ETFs in terms of support levels, but its price is still ~3% above the 200 DMA’s support, while a similar head & shoulders reversal pattern to the prior three ETFs is appearing on their one year chart.
Sustainable upward movement for DIA will require an influx in advancing volume, and the volume at the immediate price levels below Friday’s close do look like they’re ready to be tested against, particularly the $408-411.99/share zone which is currently in favor of the Buyers 10:1.
DIA has support at the $414.99 (Volume Sentiment: Buyers, 1.67:1), $413.73 (Volume Sentiment: Buyers, 1.67:1), $410.53 (Volume Sentiment: Buyers, 10:1) & $408.89/share (Volume Sentiment: Buyers, 10:1) price levels, with resistance at the $421.72 (Volume Sentiment: Buyers, 2.17:1), $426.34 (10-Day Moving Average, Volume Sentiment: Sellers, 3:1), $428.40 (Volume Sentiment: Buyers, 5:1) & $431.69/share (Volume Sentiment: Buyers, 5:1) price levels.
The Week Ahead
Monday the week begins with the Monthly U.S. Federal Budget at 2 pm & KB Homes reports earnings after the session’s close.
NFIB Optimism Index data is released Tuesday at 6 am, followed by Producer Price Index, Core PPI, PPI Year-over-Year & Core PPI Year-over-Year data at 8:30 am, Fed President Schmid speaking at 10 am & the Fed Beige Book at 2pm.
Tuesday morning features earnings from Progressive, followed by Applied Digital Corp. & Calavo Growers after the closing bell.
Wednesday begins with Consumer Price Index, CPI Year-over-Year, Core CPI, Core CPI Year-over-Year, Empire State Manufacturing Survey & Philadelphia Fed Manufacturing Survey data at 8:30 am, followed by Home Builder Confidence Index & Business Inventories data at 10 am.
JP Morgan Chase, BlackRock, BNY Mellon, Citigroup, Goldman Sachs & Wells Fargo report earnings before Wednesday’s opening bell, with Concentrix, H.B. Fuller, Home Bancshares & Synovus reporting after the session’s close.
Initial Jobless Claims, U.S. Retail Sales, Retail Sales minus Autos, Import Price Index & Import Price Index minus Fuel data are all scheduled for 8:30 am on Thursday.
Thursday morning starts off with UnitedHealth Group, Bank of America, First Horizon, Insteel Industries, M&T Bank, Morgan Stanley, PNC Financial Services Group, & U.S. Bancorp reporting earnings, followed by Bank OZK & J.B. Hunt Transportation Services after the closing bell.
Friday the week winds down with Housing Starts & Building Permits data at 8:30 am, followed by Industrial Production & Capacity Utilization data at 9:15 am.
SLB reports earnings Friday morning, as well as Citizens Financial Group, Fastenal, Huntington Banc, Regions Financial, State Street, Truist Financial & Webster Financial.
See you back here next week!
*** I DO NOT OWN SHARES OR OPTIONS CONTRACT POSITIONS IN SPY, QQQ, IWM OR DIA AT THE TIME OF PUBLISHING THIS ARTICLE ***