SPY, the SPDR S&P 500 ETF dipped -0.51% on a short holiday week last week, while the VIX closed the week at 16.13, indicating an implied one day move of +/-1.02% & a one month implied move of +/-4.66%.
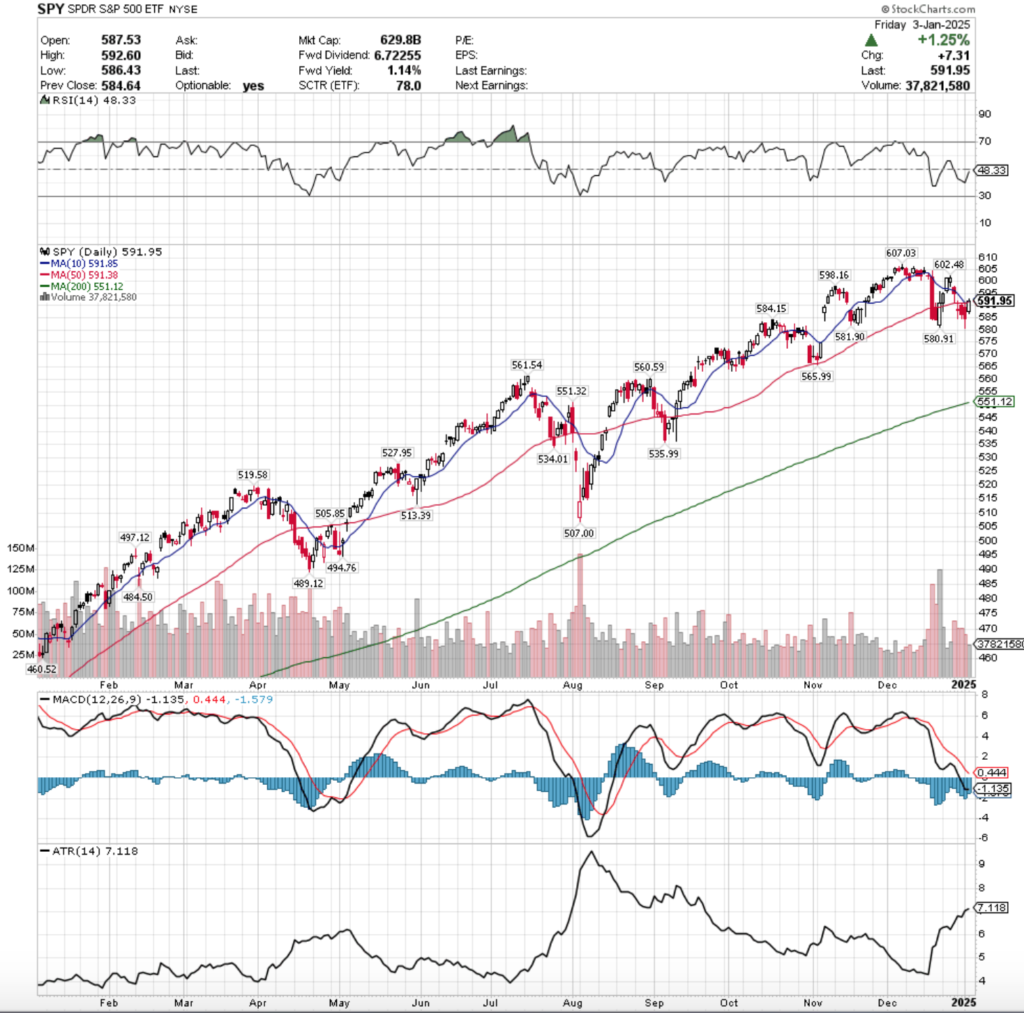
Their RSI is trending up back towards the neutral 50 mark & sits currently at 48.33 after Friday’s bullish session, while their MACD remains bearish.
Volumes were -11.6% below the prior year’s average (50.430.000 vs. 57,050,198), which should be cause for concern given how low they’ve been in the previous months when prices were advancing & this week was short & a declining week.
This becomes even more concerning when you factor in that Friday’s session was +1.25% & was the only advancing session of the week.
Monday started the week off on a sour note, as an opening gap down led to a high wave candle on high declining volume for the week.
While the session managed to temporarily break out above the 50 day moving average’s resistance, it was unable to close near it & resulted in a doji candle, setting the stage for a week of further declines.
Tuesday managed to open higher than Monday’s close, but again market participants were in a selling mood & the day resulted in a bearish engulfing candle pattern that was unable to break above the 50 DMA’s resistance.
Wednesday the market was closed for New Years day, but the selling continued on Friday, as the third highest volume session of the week brought on further declines.
Thursday’s session also tried to test the 50 DMA unsuccessfully, and the lower shadow on the candlestick indicates that there is still downside appetite from where the week closed up.
Friday was the only advancing session of the week & the only reason that the weekly losses were pared to the level that they were, as prices closed just above the 10 & 50 day moving averages.
Monday will be important to watch to see if SPY dips back below their 10 & 50 DMAs, which will be crossing over bearishly either on Monday or Tuesday.
Based on last week’s outflows it seems unlikely that they will remain above these levels, particularly given how Friday’s advancing session had the week’s lowest volume.
It’s also worth noting that volumes were much stronger than they’ve been since April 19,2024, which is not a good thing given that the week resulted in a decline & should’ve been worse had Friday not staged the recovery that it did.
Another thing to note is that the window created by the post-election gap up still has not been completely filled, which adds another bit of negativity to the mix when thinking about where SPY is headed next.
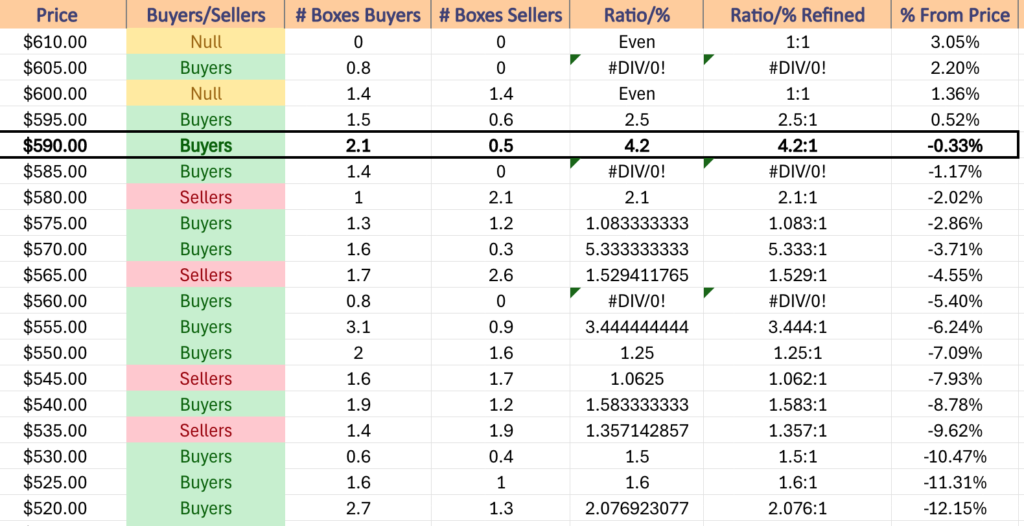
The beginning of this week will focus on whether or not the 10 & 50 DMAs can hold up as support levels, as SPY is barely above them from a price perspective, but they have a history of being Buyer dominated 4.2:1 over the past ~2 years.
In the event of a breakdown, the next three support levels fall in a zone that has been dominated by the Sellers 2:1 over that time period, which indicates that there is selling pressure all the way down to $579.99/share.
Should this breakdown occur there’s no support until $565.99, which is in a Seller dominated zone 1.53:1, before entering a relatively untested Buyer dominated zone in the $560-564.99/share range.
That would be a -5.4% decline from Friday’s closing price, which in a shortened four day week in observance of President Carter’s death is likely a stretch.
There isn’t much data or earnings this week that would inspire much of an upwards move, unless the December FOMC minutes come in with a massively dovish tone & the recent volumes do not indicate that market participants will be overly eager to jump back into the pool.
SPY has support at the $591.85 (10 Day Moving Average, Volume Sentiment: Buyers, 4.2:1), $591.38 (50 Day Moving Average, Volume Sentiment: Buyers, 4.2:1), $584.15 (Volume Sentiment: Sellers, 2:1) & $581.90/share (Volume Sentiment: Sellers, 2:1) price levels, with resistance at the $598.16 (Volume Sentiment: Buyers, 2.5:1), $602.48 (Volume Sentiment: Even, 1:1) & $607.03/share (All-Time High, Volume Sentiment: Buyers, 0.8:0*) price levels.
QQQ, the Invesco QQQ Trust ETF declined -0.76%, faring the worst of the major index ETFs for a second consecutive week.
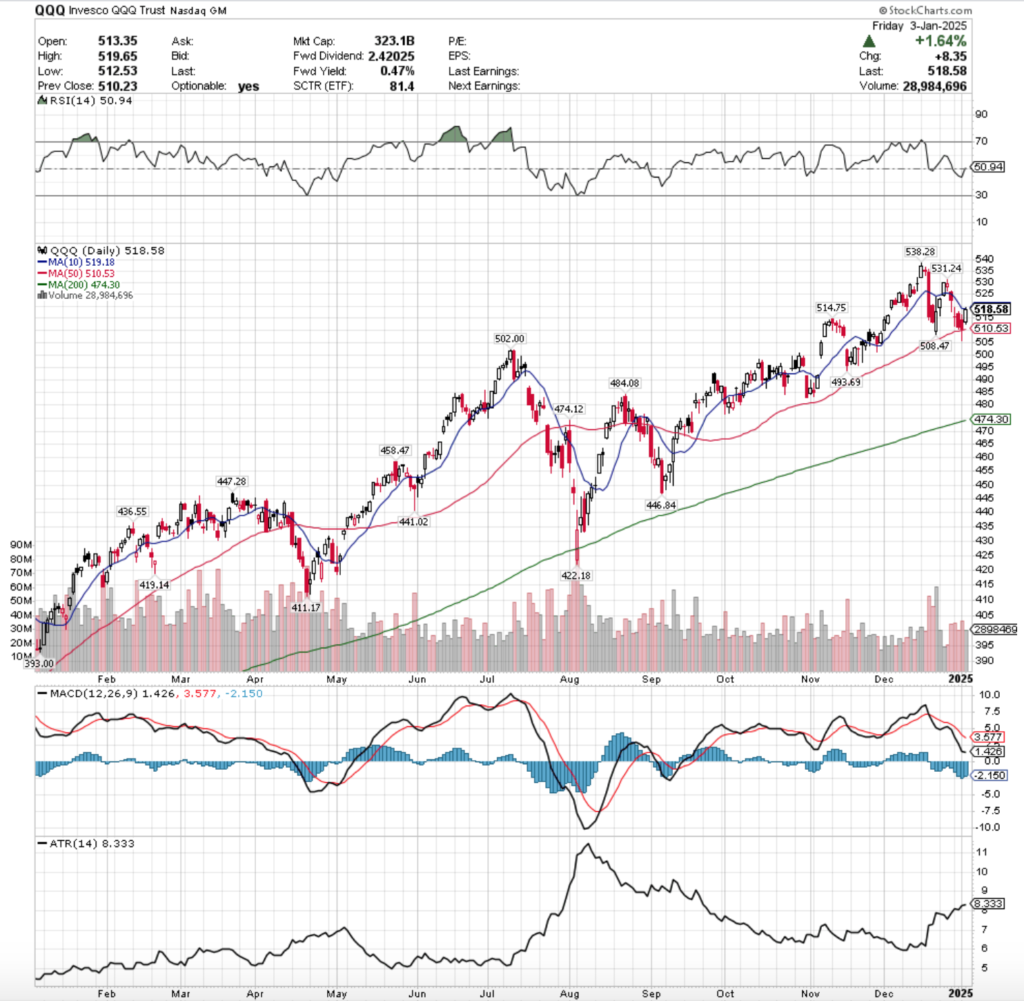
Their RSI just broke north through the neutral level & sits at 50.94 after Friday’s session, while their MACD remains bearish.
Volumes were -12.73% lower than the previous year’s average (32,287,500 vs. 36,996,008), which like SPY’s is troubling considering how much lower than average they’d been for the prior 8-9 months while QQQ was advancing.
QQQ opened the week up on a similar foot as SPY, gapping down & resulting in a high wave candle that closed in line with its open, indicating that there was quite a bit of uncertainty among market participants.
Volumes were solid Monday & that participation rolled into Tuesday, when QQQ opened higher, but slid lower throughout the day to close out for a loss just above the 50 day moving average’s support.
Thursday continued the trend of weakness, as the day opened midway through Tuesday’s range, before declining & temporarily breaking down through the 50 DMA’s support, but managed to close in-line with it.
Friday the bulls came out to play, although in low numbers as the volume wasn’t spectacular in the wake of the declines of the prior six sessions, and QQQ ended the week just below its 10 day moving average’s resistance.
This coming week will focus on whether or not QQQ can find enough buyers to come out & continue to push prices higher.
Friday’s price action showed that market participants want to respect by the medium-term trend given that Thursday managed to close above the 50 DMA & Friday went higher, but the volumes around it were not convincing.
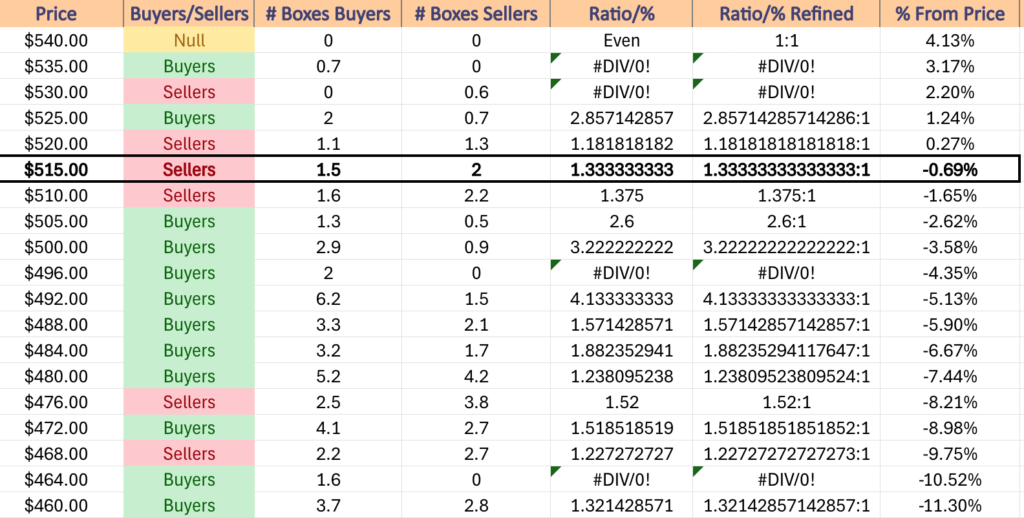
Even if the 10 DMA is broken above temporarily, QQQ’s current price level & the one above it & one below it are all historically dominated by Sellers, so there will need to be a big push in order to break back above these zones.
To the upside, QQQ is still ~3% from their All-Time High, which was aided greatly by Friday’s +1.64% advancing session to offset some of the other declines of the prior six days.
With this in mind & recalling that this too is a short week those & the relationship of price to the 10 & 50 day moving averages will be in focus.
QQQ has support at the $514.75 (Volume Sentiment: Sellers, 1.38:1), $510.53 (50 Day Moving Average, Volume Sentiment: Sellers, 1.38:1), $508.47 (Volume Sentiment: Buyers, 2.6:1) & $502/share (Volume Sentiment: Buyers, 3.22:1) price levels, with resistance at the $519.18 (10 Day Moving Average, Volume Sentiment: Sellers, 1.33:1), $531.24 (Volume Sentiment: Sellers, 0.6:0*) & $538.28/share (All-Time High, Volume Sentiment: Buyers, 0.7:0*) price levels.
IWM, the iShares Russell 2000 ETF advanced +0.92% for the week, as the small cap index staged a bit of a recovery in its consolidation range after a rocky end to 2024.
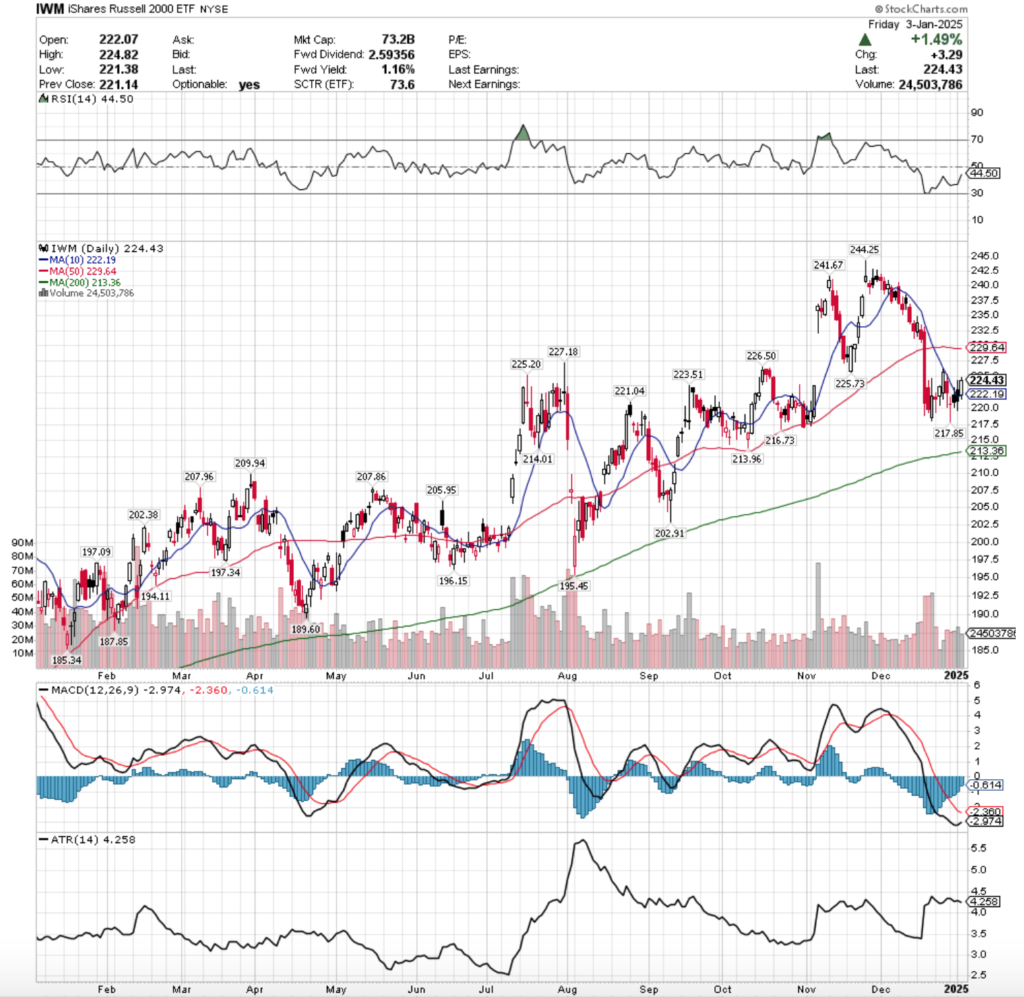
Their RSI is trending up towards the neutral mark & sits currently at 44.5, while their MACD is still bearish, but its histogram is signaling that there may be a further consolidation in the near-term.
Volumes were -15.72% below the previous year’s average level (26,452,500 vs. 31,387,826), which is not a major indicator of strength & confidence, despite the brief recovery from the losses of the previous month.
Like SPY & QQQ, IWM opened on a gap down on Monday & the session closed as a high wave candle on decent volume for the week, further distancing itself from the resistance of the 10 & 50 day moving averages.
The next day gapped up on the open & tested higher to briefly break through the 10 DMA’s resistance, but was unable to stay elevated & would up dropping lower to test against the $220/share price level, before closing above it but below the opening price, indicating that there was still lots of negative sentiment in the air.
Thursday managed to open above the 10 DMA & move higher, but gave back all of the gains by the end of the session & closed lower than it opened with a lower shadow that indicated that there was appetite for IWM below $220, which will be something to keep an eye on in the coming week(s).
Thursday’s moves came on the highest volume of the week as well, which helped gather investor momentum for Friday’s +1.49% advance which brought the week into the black.
It should be noted that Friday’s session was the lowest volume session of the week, which makes the staying power of the move higher come into question.
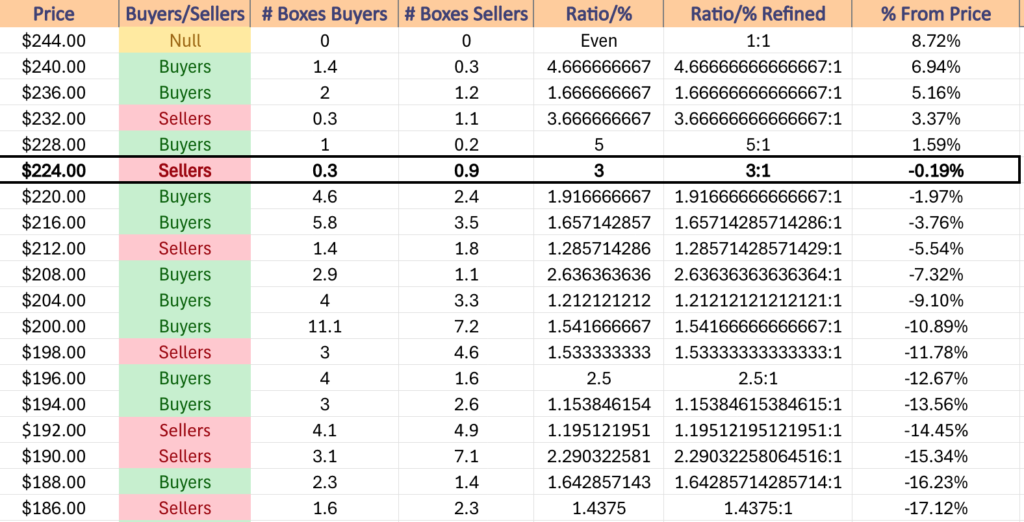
IWM faces a difficult week(s) ahead, as they have a number of resistance levels just overhead, all of which belong to a price zone that s historically Seller dominated 3:1.
It should be noted that the last time prices broke above the $227.18/share resistance level was the gap up after the U.S. Presidential election, so pending another catalyst that inspires optimism among market participants, it is difficult to see much strength to the upside without a large increase in volume.
IWM has managed to consolidate since the end of December & stayed in a relatively tight range near the 10 day moving average, which is likely to continue into this week.
Another thing to keep an eye on is that in the event of a decline, the long-term trend (200 day moving average) is just -4.93% below Friday’s closing price & is currently in a seller dominated price zone ($212-215.99), which will make for an interesting retest after IWM managed to stay above their 200 DMA in August, the last time they met.
IWM has support at the $223.51 (Volume Sentiment: Buyers, 1.92:1), $222.19 (10 Day Moving Average, Volume Sentiment: Buyers, 1.92:1), $221.04 (Volume Sentiment: Buyers, 1.92:1) & $217.85/share (Volume Sentiment: Buyers, 1.66:1) price levels, with resistance at the $225.20 (Volume Sentiment: Sellers, 3:1), $225.73 (Volume Sentiment: Sellers, 3:1), $226.50 (Volume Sentiment: Sellers, 3:1) & $227.18/share (Volume Sentiment: Sellers, 3:1) price levels.
DIA, the SPDR Dow Jones Industrial Average ETF slipped -0.66% for the week, as even the blue chip index was not immune to losses.
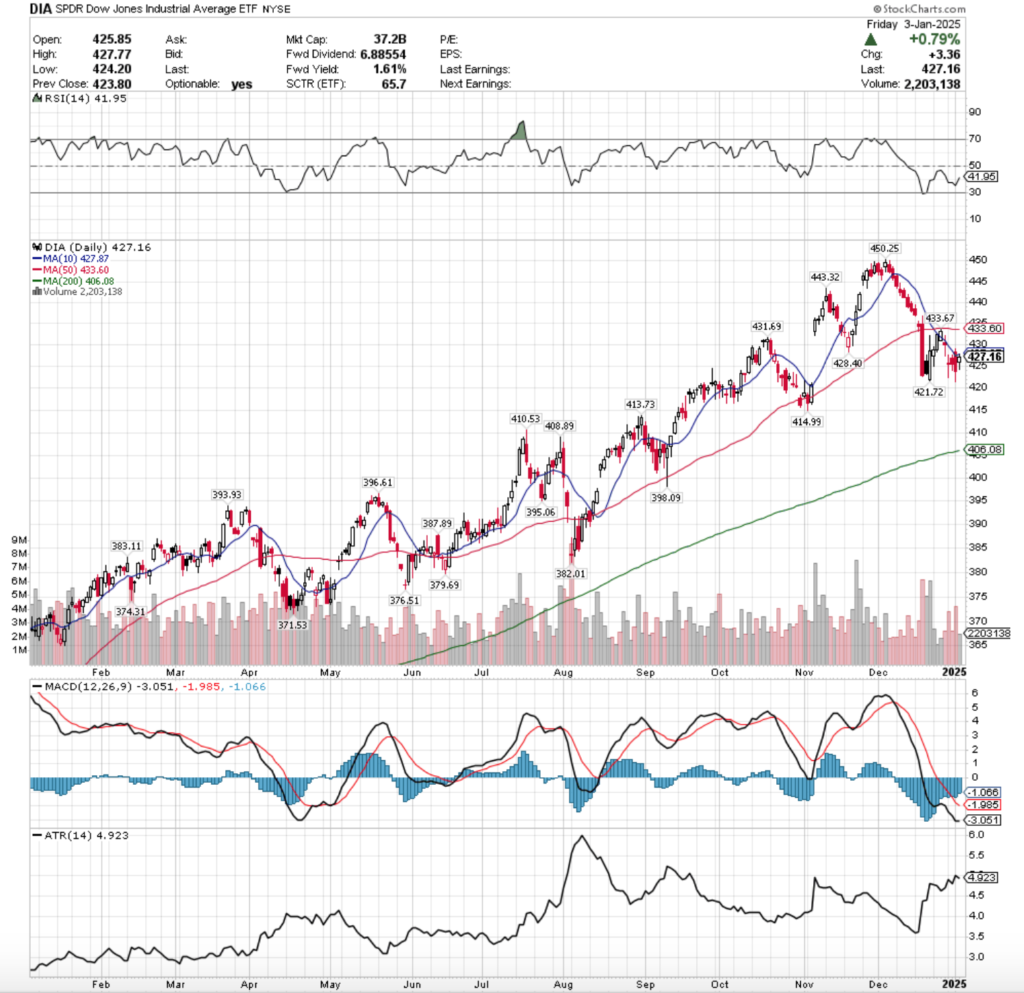
Their RSI is trending back towards neutral & currently at 41.95 after Friday’s session, while their MACD is still trending bearishly.
Volumes were -6.4% lower than the prior year’s average (3,182,500 vs. 3,400,040), which indicates that even the blue chip names have begun to lose their luster in the eyes of market participants.
Monday began the week with the second strongest volume of the week & resulted in a gap down high wave candle, indicating that there was a wide range of prices that the market deemed fair for DIA, both above & below it.
Tuesday opened on a gap higher but proceeded to go lower throughout the day & resulted in a decline on the week’s second lowest volume, leading to Thursday which is where things become interesting.
Thursday opened on a gap higher above the 10 DMA’s resistance, tested a little bit higher, before galling back down through the 10 DMA, testing lower than any day of the week & settled for a loss & forming a bearish engulfing pattern with Tuesday’s candle on the week’s highest volume.
Friday saw an advance of +0.79% which helped trim the losses of the rest of the week, but it came with an interesting twist as the candle formed a bullish harami pattern with Thursday’s candle.
What makes this interesting is that the session had the lowest volume of the week, indicating a lack of conviction among market participants, and it also resulted in a spinning top candle, which shows indecision.
Moving into this week it will be interesting to see if DIA is able to break above the 10 DMA’s resistance, and if it can if it remains there or if it is a short term stay.
The window caused by the election has still not been fully filled, which should be on people’s radar as there is only one support level separating Friday’s closing price and the bottom of the window.
It should be noted that the support of the 200 Dya moving average is -4.9% below Friday’s closing price, so if the window does close there may well be a test of the long-term trend.
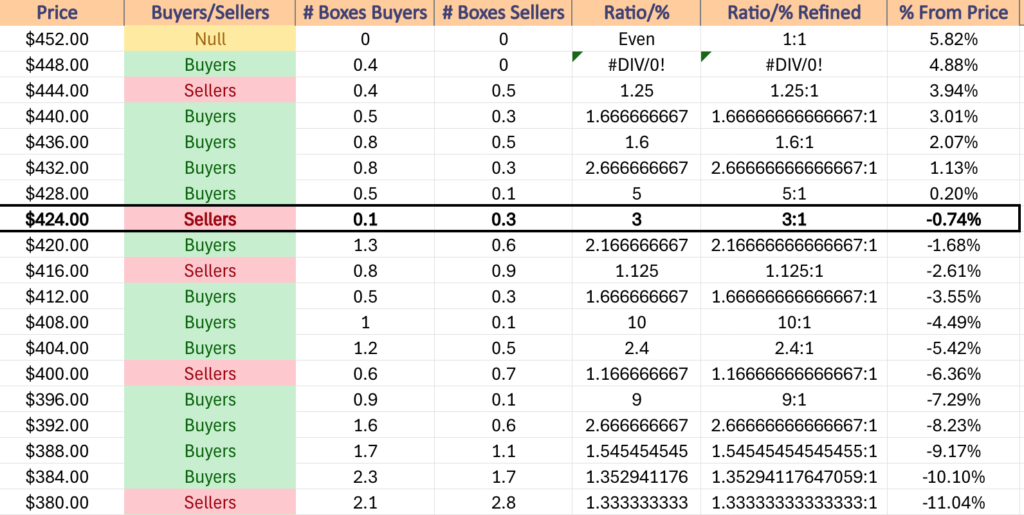
While the price zone above the 200 DMA has historically been Buyer dominated 10:1 ($408-411.99), this may not be able to save DIA from a downside test of it.
To the upside, should DIA break above its 10 DMA, it still has the resistance of the 50 DMA & would likely find itself consolidating into a range between the two for the rest of the coming short week.
DIA has support at the $421.72 (Volume Sentiment: Buyers, 2.17:1), $414.99 (Volume Sentiment: Buyers, 1.67:1), $413.73 (Volume Sentiment: Buyers, 1.67:1) & $410.53/share (Volume Sentiment: Buyers, 10:1) price levels, with resistance at the $427.87 (10 Day Moving Average, Volume Sentiment: Sellers, 3:1), $431.69 (Volume Sentiment: Buyers, 5:1), $433.60 (50 Day Moving Average, Volume Sentiment: Buyers, 2.67:1) & $433.67/share (Volume Sentiment: Buyers, 2.67:1) price levels.
The Week Ahead
Monday kicks the week off with Fed Governor Cook speaking at 9:15 am, followed by Factory Orders at 10 am.
Commercial Metals reports earnings before Monday’s opening bell.
Fed President Barkin speaks Tuesday at 8 am, followed by Governor Waller speaking & U.S. Trade Deficit data coming out at 8:30 am & ISM Services data & Job Openings data at 10 am.
Tuesday morning’s earnings reports include Apogee Enterprises, Lindsay Corp. & RPM Inc., followed by AAR Corp., AZZ, Cal-Maine Foods & Simulations Plus after the closing bell.
Wednesday leads off with ADP Employment data at 8:15 am, Minutes from December’s FOMC meeting at 2pm & Consumer Credit data at 3pm.
Acuity Brands, Albertsons, AngioDynamics, Helen Of Troy, MSC Industrial, Radius Recycling & UniFirst report earnings before Wednesday’s opening bell, followed by Greenbrier, Jefferies & Penguin Solutions.
Initial Jobless Claims data is released Thursday at 8:30 am, followed by Fed President Harker speaking at 9 am, Wholesale Inventories data at 10 am & Fed Governor Bowman speaking at 1:35 pm.
Simply Good Foods will report earnings on Thursday morning, followed by Accolade, KB Home & PriceSmart, but the market will not be open in observance of President Carter’s recent passing.
Friday the week winds down with the U.S. Employment Report, U.S. Unemployment Rate, U.S. Hourly Wages & U.S. Hourly Wages Year-over-Year data at 8:30 am before Consumer Sentiment (prelim) data at 10 am.
Delta Airlines, Walgreens Boots Alliance, Constellation Brands, Neogen, TD Synnex & Tilray all report earnings before Friday’s opening bell, with WD-40 reporting after the session’s close.
See you back here next week!
*** I DO NOT OWN SHARES OR OPTIONS CONTRACT POSITIONS IN SPY, QQQ, IWM OR DIA AT THE TIME OF WRITING THIS ARTICLE ***