SPY, the SPDR S&P 500 ETF added +0.86% last week, while the VIX closed at 18.03, indicating an implied one day move of +/-1.14% & an implied one month move of +/-5.21%.
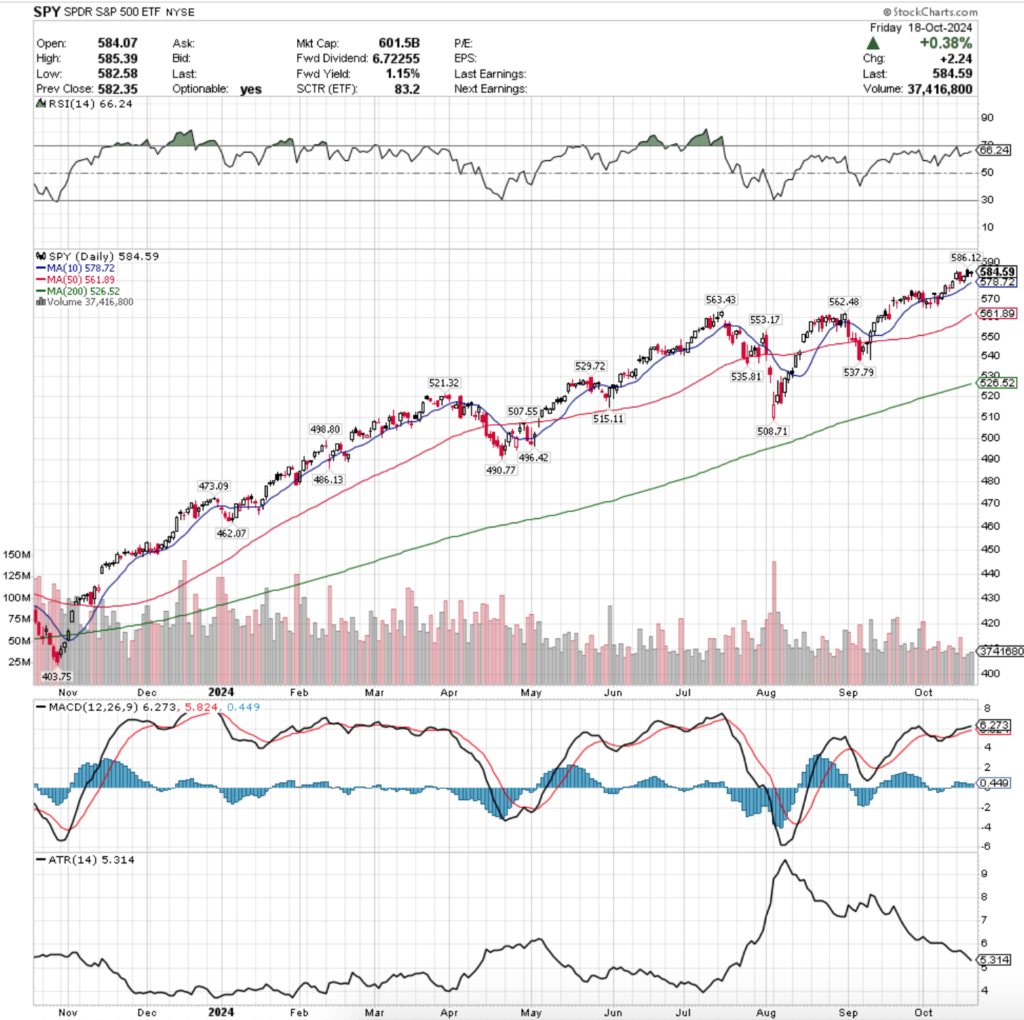
Their RSI is advancing towards the overbought level of 70 & sits currently at 66.24, while their MACD is bullish, but its histogram is signaling that it is losing steam following last week’s relatively flat performance.
Volumes were -40.04% below the previous year’s average levels (38,592,000 vs. 64,338,465), as market participants have clearly begun to show signs of caution in regards to the U.S. election & international relations in October.
For comparison, using April 21, 2024’s Market Review Note‘s prior year’s average volume of 78,101,687 (last peak volume was 4/19/2024 before volumes began to significantly decline) the current prior year’s average volume is -17.62% lower & the past week’s volume was -50.59% lower.
Now let’s look at what happened last week.
Monday kicked the week off on a gap up session that continued to climb higher, closing with only a small upper shadow, but on less than stellar volume.
Profit taking & warning lights began flashing on Tuesday, when the day’s session resulted in a bearish engulfing candle on a declining session on volume that eclipsed the rest of the month, minus 10/1/2024’s declining session’s volume.
Wednesday opened in-line with Tuesday’s close & saw more selling temporarily as more investors took profits following Monday’s gap up & the week before’s advances (there was no market note last week as I was on vacation).
The session also had the lowest volume of the week, and given the week was weak, it may be the start of investors becoming extremely cautious as we run up to the U.S. Presidential Election.
The cautious attitude continued into Thursday, as while the session advanced on the day to set a new all-time high for SPY, it opened on a gap up, nudged higher (minuscule upper shadow), before tumbling to close just above the prior day’s close, closing lower than it opened (bearish).
Thursday’s volume was also the second lowest of the week, adding confirmation to the already bearish looking set up.
Friday’s session opened midway through Thursday’s candle’s real body range & resulted in a hanging man candle that closed lower than it opened, with limited test to the upside (small upper shadow) & the day’s low was slightly higher than Thursday’s low.
What is even more interesting about Friday’s session is that the candle formed a harami pattern with Thursday’s.
Typically an advancing session (+0.38% intraday) is considered bullish, which would mark this a bullish harami.
However, given the fact that it closed below its open & resulted in a filled candle, there is plenty of bearish sentiment & reason to interpret it as a bearish harami, which when paired with the low volume & other bearish elements of the week reason for caution moving into the week ahead.
Aside from the previously mentioned potential market moving news, there is a plethora of earnings reports due out this week that are all outlined in “The Week Ahead” at the bottom of this article which may be a catalyst for more volatility in the coming week, along with the Fed’s Beige Book being released on Wednesday.
Those earnings calls will be something to keep an eye on in the coming week, as will the volume levels of the week, as if Wednesday’s volume stands as a spike it will likely down the road be viewed as a reversal point, especially with how bearish the rest of the week was (even if it did advance slightly higher).
The next order of business will be to watch how the 10 day moving average holds up as a support level in the event of a leg down, as it is currently at a level where there is not much historic volume data to based how investor sentiment may be should that test come.
While there is a light support zone between $561.89 & $563.43, that begins -3.62% from Friday’s closing price.
It’s worth noting that $561.89 is the 50 day moving average & it will continue rising as time progresses, pinching the zone smaller & smaller as days pass.
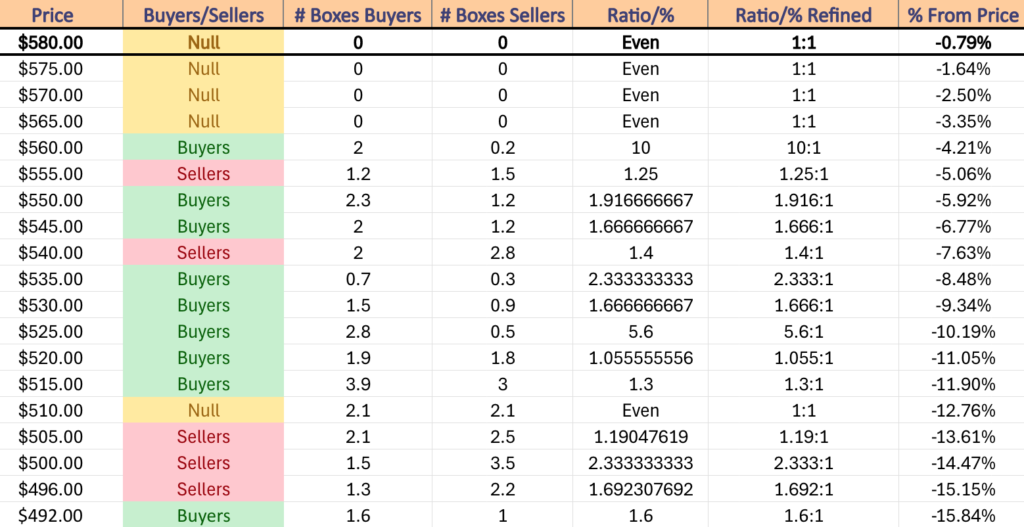
While the touch-points in this zone are all historically dominated by Buyers at a rate of 10:1 by volume (see “Volume Sentiment” link below), this range has seen limited testing & sits near price extremes, so it has not seen much in terms of testing.
This can be seen when you consider the gap downs & wide-range declining sessions that took place at these levels, making any retest of these levels dilute the historic Buyer sentiment.
It would also be prudent to watch SPY’s RSI, as the last time it approached the overbought 70 mark it retreated rather than crossing over it like we’ve seen happen a majority of the other times it’s approached it this year.
If there is not an increase in volume as it approaches that level again it is a signal to take caution.
Also, referring to the 10 DMA point above, should price drop below it & it becomes a resistance level, look at the prior year’s examples of what’s happened when this occurs.
Given they’re at all-time highs there is little to review regarding their upside.
The table below breaks down volume sentiment at each price level SPY has traded at over the past ~2 years & can be referenced to see how strong or weak SPY’s support or resistance levels may be (the link explains how to read the table).
SPY has support at the $578.72 (10 Day Moving Average, Volume Sentiment: NULL, 0:0*), $563.43 (Volume Sentiment: Buyers, 10:1), $562.48 (Volume Sentiment: Buyers, 10:1) & $561.89/share (50 Day Moving Average, Volume Sentiment: Buyers, 10:1) price levels, with resistance at the $586.12/share (All-Time High, Volume Sentiment: NULL, 0:0*) price levels.
QQQ, the Invesco QQQ Trust ETF that tracks the NASDAQ 100 gained +0.22%, faring the worst of the major four index ETFs.
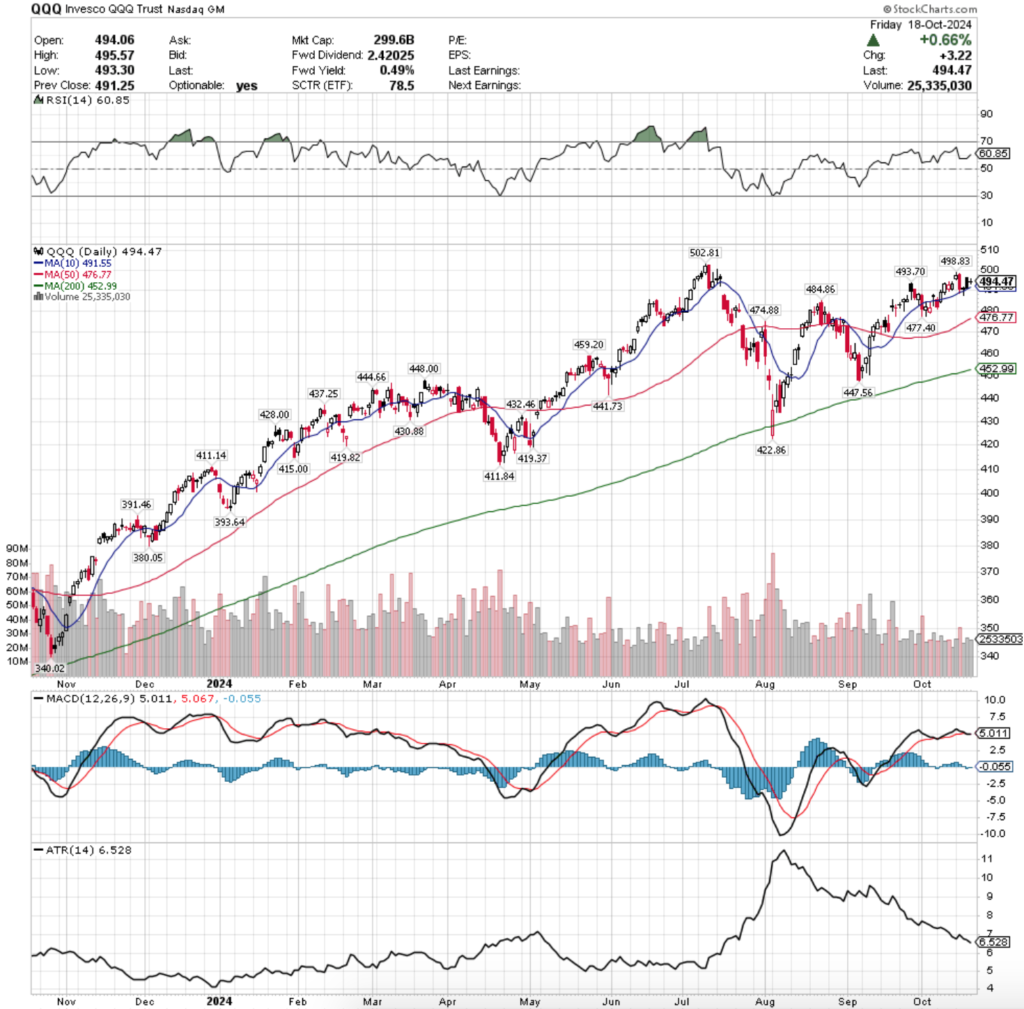
Their RSI is rising towards overbought levels & currently sits at 60.85, while their MACD is has flattened out but it bullish after dipping below the signal line for a couple of sessions.
Volumes were -33.43% lower than the prior year’s average volume (27,278,000 vs. 40,977,632), which as we just outlined in SPY is a reason to consider taking caution in the near-term.
Using the same 4/21/2024 market data as SPY’s comparison (49,155,742 was the average annual volume), the current average past year’s volume for QQQ is -16.64% lower, while last week’s average volume was -44.51% lower than that benchmark.
Now that the A.I. & Semiconductor trade has begun to wane in popularity we’ve witnessed a big shift in volumes between SPY & QQQ vs. IWM & DIA.
As noted, SPY & QQQ have moved in a much more similar manner to one another than the latter two index ETFs.
QQQ’s week also began on a gap up session where the day’s high marked a recent resistance level on volumes that were nothing to write home about.
Tuesday saw a -1.34% decline on the week’s highest volume, which is second highest for October minus 10/1/2024’s declining volume & formed a very large bearish engulfing candle.
Much of this was likely profit taking in the wake of the previous week’s run up & it should be noted that the 10 day moving average’s support managed to hold up, despite the day’s low testing it.
Bearishness & cautious sentiment carried on Wednesday, when QQQ opened opened just above the 10 day moving average’s support, briefly broke through it but managed to close the day as a dragonfly doji.
Dragonfly dojis tend to signal that there may be a price reversal move coming up, but given that there is no trend to reverse from & the low volume.
Thursday opened with a glimmer of optimism on a gap up, only to drag lower throughout the day & close in-line with the 10 DMA lower than it opened, another sign of caution.
Friday continued to theme of risk-off/take caution ahead as the session opened midway between Thursday’s real body range & closed as a harami cross.
Typically this would indicate that the current trend may be winding down & setting up to reverse, but the recent trading activity has been relatively choppy & not strongly trending in one way or another.
With this in mind, the week ahead will be time to watch the price of QQQ in relation to the 10 day moving average.
We’ll likely see a retest of it based on Fed speakers & earnings calls at some point in the week & how strong that support level holds up will be a key determinant of QQQ’s near-term performance.
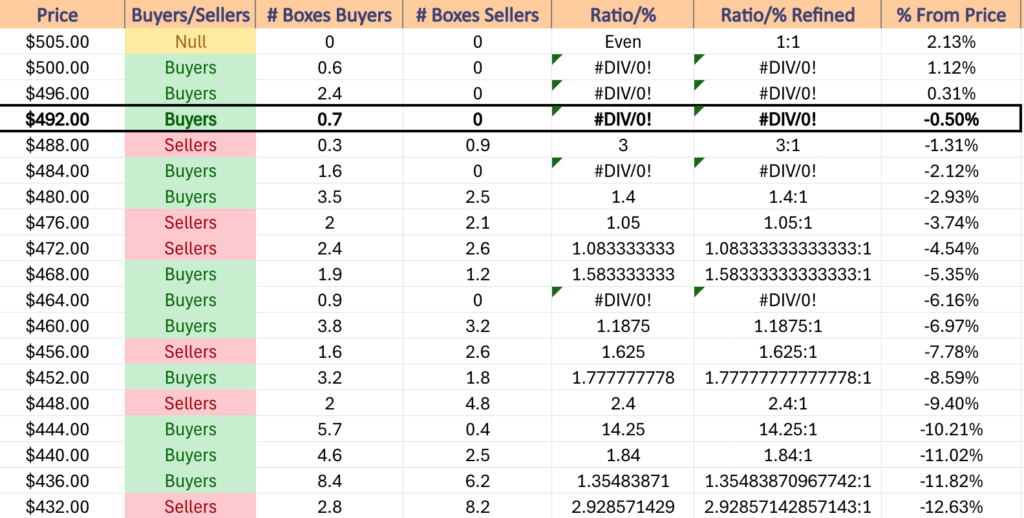
This is going to be especially important given that the price range it sits in now is Seller dominated 3:1 over the past 2-3 years & the next two zones beneath it (table below) are Buyer dominated, but not by much.
If those zones are passed through we may see 5%+ declines from Friday’s closing price as the two zones beneath it favor the Sellers.
There is also only one support level that falls into those two aforementioned Buyer zones, which will make it difficult for QQQ to find footing without sliding into those Seller zones.
In terms of the upside potential, the $498.83 mark is going to be an area to keep an eye on, as if volumes improve & prices are driven up above it there may be a possible run at the recent all-time high of $502.81.
QQQ has support at the $493.70 (Volume Sentiment: Buyers, 0.7:0*), $491.55 (10 Day Moving Average, Volume Sentiment: Sellers, 3:1), $484.86 (Volume Sentiment: Buyers, 1.6:0*) & $477.40/share (Volume Sentiment: Sellers, 1.05:1) price levels, with resistance at the $498.83 (Volume Sentiment: ) & $502.81/share (All-Time High, Volume Sentiment: Buyers, 0.6:0*) price levels.
IWM, the iShares Russell 2000 ETF advanced +1.98% last week, as small caps had the strongest week of the major four index ETFs.
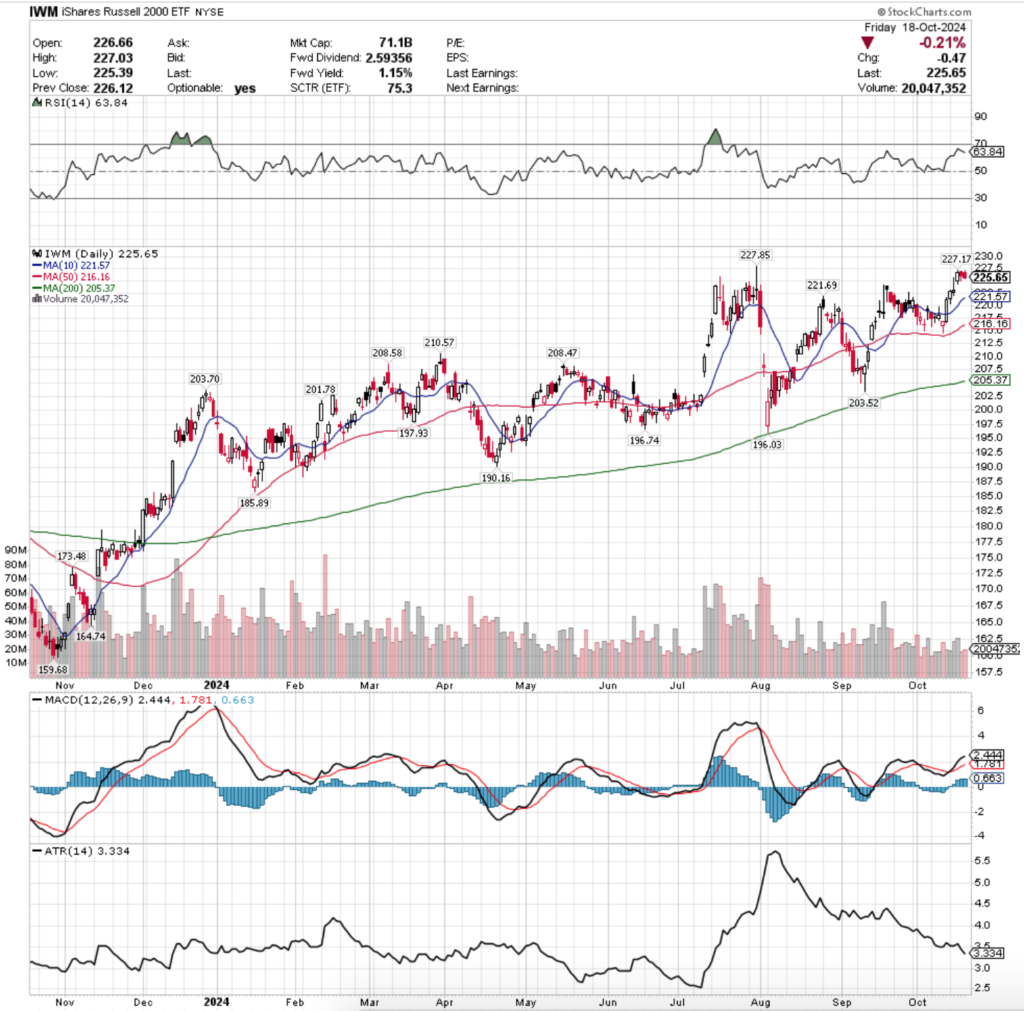
Their RSI is trending down towards neutral but still sits closer to overbought levels at 63.84, while their MACD is bullish, but beginning to show signs of a bearish rollover in the near-term.
Volumes were -35.74% below the previous year’s average (22,194,000 vs. 34,538,583), which is bad given that IWM currently has a higher past year’s average volume than it did in April.
Compared to the 4/21/2024 market data where IWM’s prior year’s average volume was 34,864,840, IWM’s current prior year’s average volume is +0.94% higher, while last week’s volume was -35.74% lower.
Monday IWM started off on a sleepy note, when the week began with a very low volume session that opened just above Friday’s close, tested lower before trudging up to close the day out as an advancing session, but with lackluster participation.
Tuesday is when things began to get murky for IWM, as the session opened slightly higher, tested briefly into Monday’s range, before rocketing higher to break above the $225/share mark, when folks began taking profits & forced the price down so low that the day ended as a high wave candle & spinning top.
This is troubling as the real body of the candle is concentrated at the bottom of the day’s range & the upper shadow is much higher than the lower, indicating that there was not enough bullish sentiment to keep climbing higher.
This makes Wednesday’s candle even more interesting, as the day began on a gap up, briefly tested lower before powering higher on the week’s highest volume.
It set the stage for the range that the rest of the week would trade in for IWM, as Thursday opened slightly higher, only to test down to the bottom of Wednesday’s candle’s real body & find bullish support around the $225/share mark & closed as a hanging man candle (bearish).
Bearish sentiment carried on into Friday as investors were not willing to carry small cap risk into the weekend & continued taking profits from the run-up of the past week.
While the last two sessions of the week were bearish, the volumes behind the movements was not particularly strong.
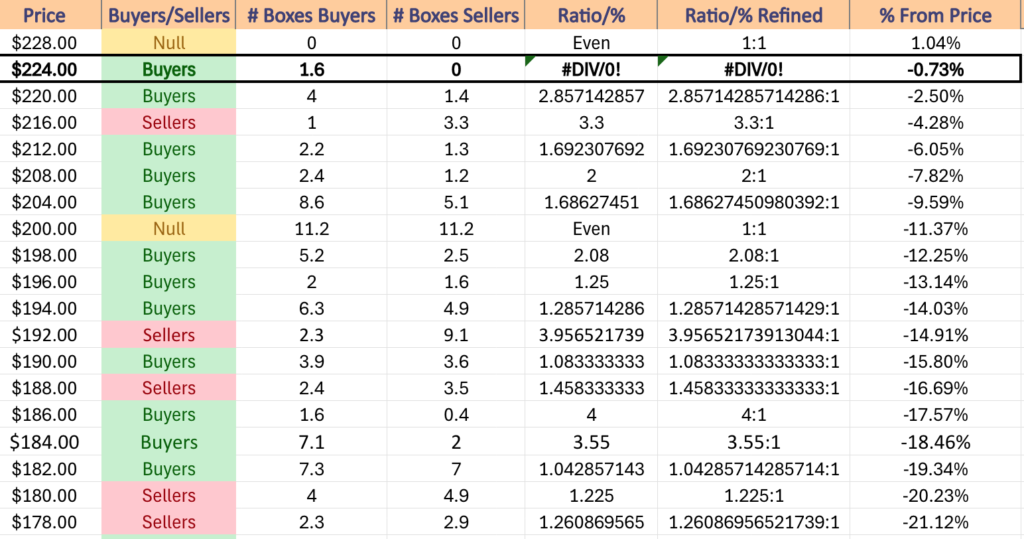
This week will be important to watch how the window created by Wednesday’s gap up holds up or if it becomes filled, as Wednesday’s session’s high was unable to reach the 52-week high set in July.
Should that window be filled there will be a pair of support touch-points in the $221.57-221.69 (first number may increase as it is the 10 DMA) which will prove to be vital for IWM’s price, as should they break down there are no other support levels until it enters a Seller dominated price zone where they’ve outnumbered Buyers 3.3:1.
The good news is that this support level is the 50 day moving average, which will continue higher, but if IWM declines below that & both the 10 & 50 DMAs are applying resistance & downward pressure on the price there are no support levels again until $210.57.
Volume will be imperative to watch as well, as it may lend clues into which way IWM will break out as the current volume levels are lackluster & reflect cautious sentiment.
IWM has support at the $221.69 (Volume Sentiment: Buyers, 2.86:1), $221.57 (10 Day Moving Average, Volume Sentiment: Buyers, 2.86:1), $216.16 (50 Day Moving Average, Volume Sentiment: Sellers, 3.3:1) & $210.57/share (Volume Sentiment: Buyers, 2:1) price levels, with resistance at the $227.17 (Volume Sentiment: Buyers, 1.6:0*) & $227.85/share (52-Week High, Volume Sentiment: Buyers, 1.6:0*) price levels.
DIA, the SPDR Dow Jones Industrial Average ETF climbed +0.91% last week, having the second strongest week behind IWM.
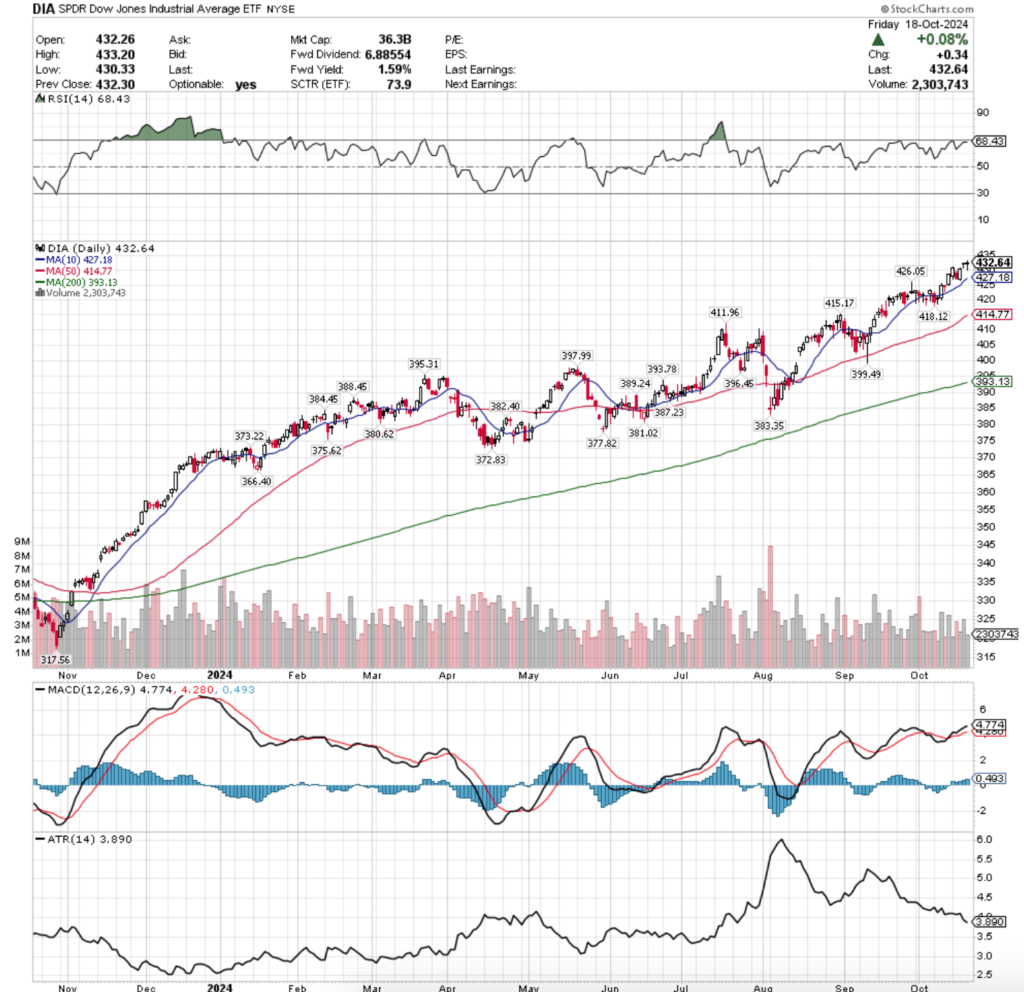
Their RSI has flattened just beneath the overbought level & currently sits at 68.43, while their MACD is still bullish, but may be losing steam if they do not advance early in the next week following the past two days’ relatively flat performance.
Volumes were -20.98% below the previous year’s average volume (2,762,000 vs. 3,495,512), as investors have even grown cautious around the blue chip index names.
Compared to the 4/21/2024 market data when DIA’s average prior year’s volume was 3,508,088, DIA’s current prior year’s average volume is -0.36% lower & their past week’s volume was -21.27% lower.
DIA’s week began on a bullish note, although their RSI was nudging up against the overbought level, which helped pave the way for the more cautious approach the rest of the week took.
They opened just below Friday’s close before powering higher, but it should be noted it was on the week’s weakest volume.
Tuesday opened lower & was unable to find any footing as profit taking pushed DIA’s price down into the close on the week’s second highest volume, which indicated that in addition to the desire to capture profits, there was also a bit of uneasiness gripping into DIA’s pricing.
Wednesday’s session produced a bullish engulfing candle, but again, on light volume which did not indicate that there was a potential breakout at-hand.
Thursday gapped up, but the day resulted in a dragonfly doji with the week’s highest volume.
This would normally be something of more interest & perhaps carry more bullish implications, but given it set a new all-time high & tested down almost to Wednesday’s high it appears that market participants were not overly eager to continue pushing higher.
This was confirmed Friday when the session resulted in another dragonfly doji, on lower volumes, that also saw a bit of bearish selling pressure as market participants were ready to take some chips down from the table heading into the weekend.
Friday was also the second lowest volume of the week, which makes Thursday’s price movement look even less remarkable.
Heading into this week it will be interesting to watch if DIA is able to trudge any higher, given that they hit the all-time high so late in the week (Friday).
The window created by Thursday’s open will also be an area to watch in to see if it becomes filled, as well as DIA’s RSI, as it has flattened out just below the overbought mark of 70 & will need to split one way or the other in the near-term.
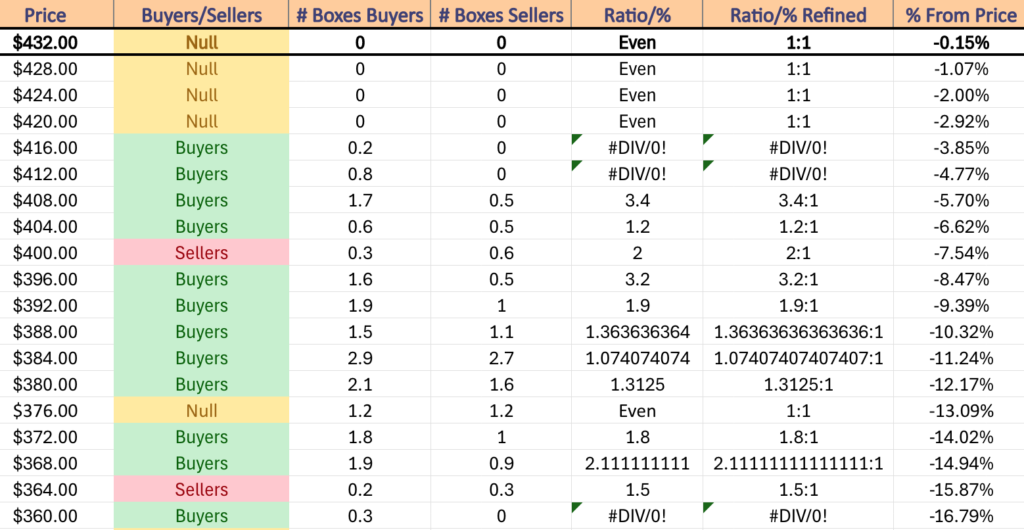
While the table below is one month old & may need to be refreshed, the low volume environment DIA has traded in has caused a set up where for the next -2.92% from Friday’s closing price there is limited Buyer:Seller information to gauge sentiment.
With that in mind, keep an eye on the volumes that you see coming in during the week to get an idea as to how market participants may be slanted in terms of their near-term outlook.
Also, should the 10 Day Moving Average’s support break down, there is support at the $426.05/share level (-1.52%), before nothing for an additional -1.86%, which is when DIA returns to Buyer dominated price levels for another ~3%.
One thing of note though is that with the exception of $408-411.99, these Buyer zones are relatively untested so far by Sellers, and it would be wise to keep that in mind should these price levels be tested.
DIA has support at the $427.18 (10 Day Moving Average, Volume Sentiment: NULL, 0:0*), $426.05 (Volume Sentiment: NULL, 0:0*), $418.12 (Volume Sentiment: Buyers, 02.:0*) & $415.17/share (Volume Sentiment: Buyers, 0.8:0*) price levels, with resistance at the $433.20/share (All-Time High, Volume Sentiment: NULL, 0:0*) price levels.
The Week Ahead
Monday kicks off with Fed President Logan speaking at 8:55 am, followed by U.S. Leading Economic Indicators data at 10 am.
Sandy Spring Banc reports earnings Monday morning before the opening bell before AGNC Investment, Alexandria RE, BOK Financial, Cadence Bank, Cathay Bancorp, Equity Lifestyle Properties, HealthStream, Hexcel, Medpace Holdings, Nucor, Simpson Manufacturing, W.R. Berkley & Zions Bancorp report after the session’s close.
Fed President Harker speaks Tuesday morning at 10 am.
Tuesday morning’s earnings calls include GE Aerospace, Verizon, 3M, A.O. Smith, Atlantic Union Bankshares, Banc of California, Comcast, Community Financial System, Danaher, Denny’s, Fiserv, Freeport-McMoRan, GATX, General Motors, Genuine Parts, Herc Holdings, Interpublic, Invesco, Kimberly-Clark, Lockheed Martin, Moody’s, Old National Bancorp, PACCAR, Pentair, Philip Morris International, Polaris Industries, PulteGroup, Quest Diagnostics, RTX & Sherwin-Williams, with Agree Realty, Baker Hughes, Brandywine Realty, Canadian National Railway, CoStar Group, East West Bancorp, Enova International, Enphase Energy, Highwoods Properties, JBT Corp, Manhattan Associates, Matador Resources, Nabors Industries, National Bank, Packaging Corp of America, PennyMac, Range Resources, Retail Opportunity Investments, Robert Half, Seagate Technology, Stride, Texas Instruments, Trustmark, Valmont Industries, Veritex Holdings & Vicor all reporting after the closing bell.
Wednesday brings us Existing Home Sales data at 10 am & the Fed’s Beige Book at 2pm.
Amphenol, AT&T, Avery Dennison, Boeing, CME Group, Coca-Cola, Constellium, Evercore, GE Vernova, General Dynamics, Healthcare Services Group, Hilton, KBR, Lennox International, Lithia Motors, Mr. Cooper Group, New Oriental Education & Technology, NextEra Energy, NextEra Energy Partners, Northern Trust, Old Dominion, PROG Holdings, Prosperity Bancshares, Roper, Stifel Financial, Taylor Morrison Home, Teledyne Technologies, Thermo Fisher Scientifi, TransUnion, Travel + Leisure Co, UniFirst, United Community Banks, Vertiv Holdings, Westinghouse Air Brake Technologies, Watsco & Winnebago are all due to report earnings before Wednesday’s opening bell, with Tesla, Align Technology, Ameriprise Financial, ASGN Incorporated, CACI International, Canadian Pacific Kansas City, Celestica, Century Communities, Churchill Downs, Community Health, Core Labs, EastGroup, Equity Commonwealth, Essential Properties Realty Trust, Globe Life, Goosehead Insurance, Graco, Greenbrier, International Business Machines, ICON, Impinj, Kaiser Aluminum, Knight-Swift Transportation Holdings, Lam Research, Las Vegas Sands, Lending Club, Mattel, MaxLinear, Moelis, Molina Healthcare, MSA Safety, Newmont, O’Reilly Automotive, Oceaneering International, Pathward Financial, Patterson-UTI, Pegasystems, Plexus, QuantumScape, Raymond James, Rollins, Sallie Mae, SEI Investments, ServiceNow, Simulations Plus, South State, Stewart Info, T-Mobile US, Teradyne, Tyler Technologies, United Rentals, Veralto, Viking Therapeutics, Waste Connections, WesBanco, Western Union, Whirlpool & Wyndham Hotels & Resorts reporting after the session’s close.
Initial Jobless Claims data comes out Thursday morning at 8:30 am, followed by S&P Flash U.S. Services PMI & S&P Flash U.S. Manufacturing PMI data at 9:45 am & New Homes Sales data at 10 am.
Thursday morning’s earnings calls include ADT, Alkermes, Allegion, AllianceBernstein, American Airlines, Applied Industrial, Berkshire Hills Bancorp, Bread Financial, Brunswick, Carpenter Technology, Carrier Global, CBRE Group, Columbia Banking, Dover, Dow, DTE Energy, Euronet, Expro Group, First Merchants, FirstService, FTI Consulting, Harley-Davidson, Hasbro, Honeywell, Integer Holdings, Keurig Dr Pepper, KKR, Labcorp Holdings, Lear, Life Time, Lindsay Corp, LKQ, MSC Industrial, NASDAQ, NetScout Systems, Northrop Grumman, OSI Systems, Pacific Premier, Pool, Radius Recycling, Reliance, Rogers Communications, RPC, Ryder System, S&P Global, Simply Good Foods, Sonic Automotive, Southside Banc, Southwest Air, TechnipFMC, Teck Resources, Textron, Tractor Supply, TRI Pointe Homes, Union Pacific, United Parcel Service, Valero Energy, Valley National, Virtu Financial, Visteon, Wabash National, West Pharmaceutical Services & WEX, followed by Ameris Bancorp, AppFolio, AptarGroup, Arthur J. Gallagher, Associated Banc-Corp, Beyond, Boston Beer, Boyd Gaming, Capital One, Carlisle Cos, Cincinnati Financial, Coursera, Cousins Properties, Deckers Outdoor, Dexcom, Digital Realty Trust, Edwards Lifesciences, Exponent, Federated Hermes, First Financial Bancorp, First Interstate Bancsystem, Gaming and Leisure Properties, Glacier Bancorp, Hartford Financial, Healthpeak Properties, Kinsale Capital, Knowles, L3Harris, McGrath RentCorp, Minerals Technologies, Mohawk Industries, NOV Inc., Olin, Phillips Edison & Company, Piedmont Office Realty Trust, Principal Financial Group, ResMed, Seacoast Banking, Skechers USA, SPS Commerce, SS&C Technologies, Texas Roadhouse, Tronox, Universal Health, VeriSign, Western Digital, Weyerhaeuser & WSFS Financial after the closing bell.
Friday the week winds down with Durable-Goods Orders & Durable-Goods Minus Transportation data at 8:30 am, followed by Consumer Sentiment (final) data at 10 am.
The week winds down with Aon, AutoNation, Avantor, Balchem, Barnes Group, Booz Allen Hamilton, Centene, Colgate-Palmolive, First Hawaiian, Gentex, HCA, Lakeland Financial, New York Community, Newell Brands, Piper Sandler, Portland General Electric, Saia, Sanofi, Sensient, Stellar Bank, TriNet Group & WisdomTree reporting earnings before the session’s opening bell.
See you back here next week!
*** I DO NOT OWN SHARES OR OPTIONS CONTRACT POSITIONS IN SPY, QQQ, IWM OR DIA AT THE TIME OF PUBLISHING THIS ARTICLE ***