SPY, the SPDR S&P 500 ETF advanced +0.26% last week, having the best week of the major four index ETFs, while the VIX closed the week out at 19.21, indicating an implied one day move of +/-1.21% & a one month implied move of +/-5.55% for the S&P 500.
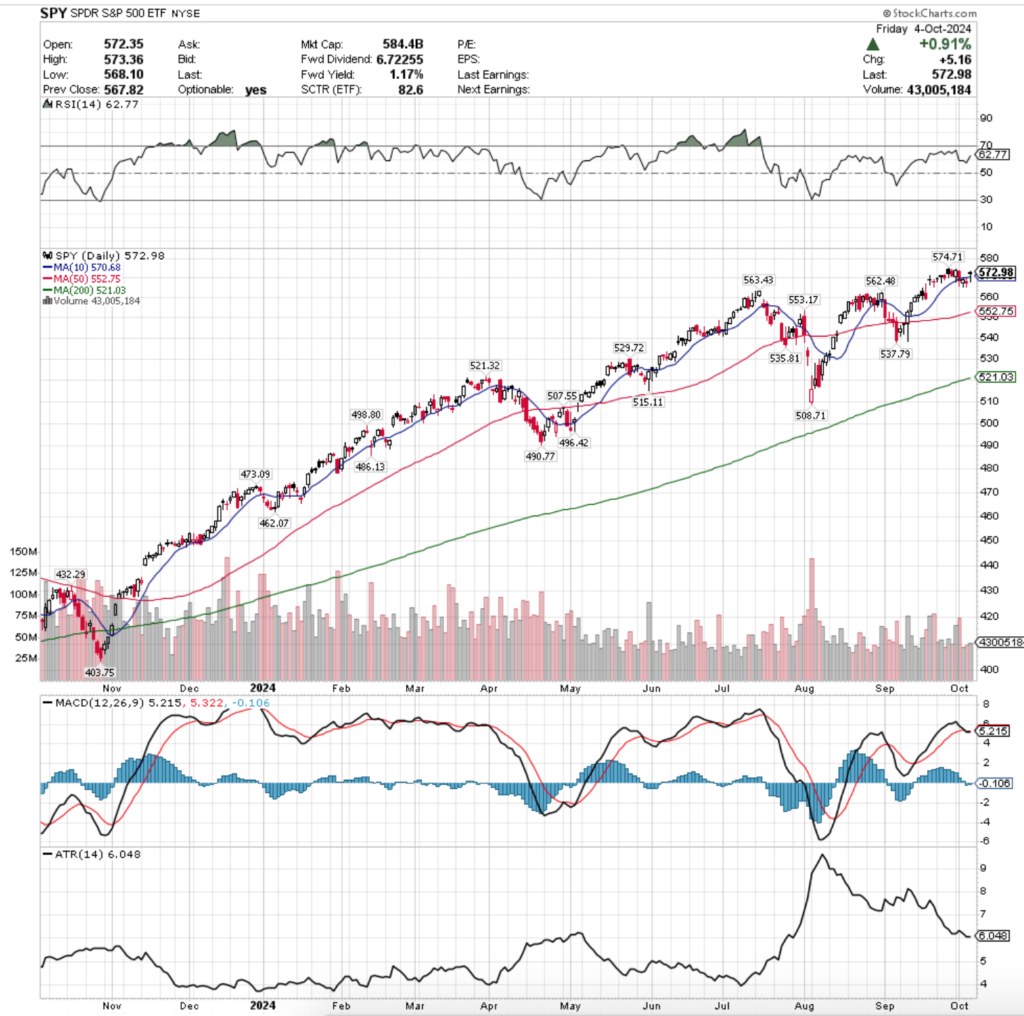
Their RSI is trending towards overbought levels after Friday’s gap up session & currently sits at 62.77, while their MACD is lightly bearish & sitting relatively flat with the signal line; again, as a result of Friday’s moves after crossing bearish a couple of days prior.
Volumes were still notably low, coming in -21.65% below the past year’s average volume (51,658,000 vs. 65,934,287), which as we highlighted last week marks a steep decline from where the prior year’s average volume readings were coming in at 5-6 months ago ( that market note here).
Monday began the week on a moderately upbeat note, there was the second highest volume of the week on a bullish session that despite dipping low enough to test the 10 day moving average’s support was able to find legs & close higher for the day.
It was not able to test the all-time high set the previous Thursday though, a clear sign that market participants have become exhausted & are not overly eager to chase SPY or its component stocks much higher.
Tuesday this uneasiness was confirmed when markets opened lower, and despite temporarily testing higher (shown by candle’s upper shadow), the session was largely bearish, with the week’s highest volume coming as bears pushed the price to break beneath the 10 DMA’s support temporarily, before rising back up to close the day just beneath it; clearly showing some cracks have formed.
Wednesday added more fuel to the fire, when SPY opened lower, tested lower, but ultimately rallied to end the day as an advancing session, but was unable to break above the resistance of the 10 DMA.
Things continued on this track into Thursday, when the session opened lower & floundered around all day to prove unable to break above the 10 DMA’s resistance, but to also show that there was not enough bearish sentiment among market participants to force prices to the low levels of the prior day.
Ultimately, Thursday ended in a spinning top candle in a declining session, indicating that there was a lot of uneasiness in the market & uncertainty regarding SPY.
This made Friday’s price action look like a squeeze, as the volume was the third highest of the week, but far below that of the top two days, prices opened on a gap up above the 10 DMA’s resistance, but intraday crossed below it’s support, only to rally higher but still close lower than the session opened as a hanging man candle.
While the MACD & RSI temporarily benefitted from this movement, it does not come across as being something with a solid foundation that is built to last & indicates that there is reason to be cautious in the coming week regarding SPY (And the other major indexes, for that matter).
Prices have similarly shown weakness in days leading up to days that manage to pop above the 10 DMA’s support only to fall in the coming sessions in May & August & given the existing weakness that we are seeing for SPY this looks to be the case coming into tomorrow.
Heading into the coming week the 10 DMA will continue to be an area of focus for SPY, as well as any volume clues that may come along with the price action, as despite overall volumes being lower than usual, there are still subtle clues that can be taken from the behavior of market participants about their current sentiment & next moves.
Last week’s support level notes will also be relevant this week (apologies for keeping this note brief, but I am on vacation & preparing for an all-day charity event tomorrow, as well as a hurricane the next day).
Those notes regarding the support for SPY all remain true, especially given the way the RSI & MACD moved over the past five days.
This week will feature a lot of Federal Reserve speakers, as well as the FOMC Minutes from the September meeting (released Wednesdays at 2pm) & big bank earnings kick off the next earnings season beginning on Friday.
Aside from that, there is also CPI, PPI & earnings from Domino’s Pizza & PepsiCo during the week, all of which will shed more light into the state of the average consumer & how they’re coping with inflation.
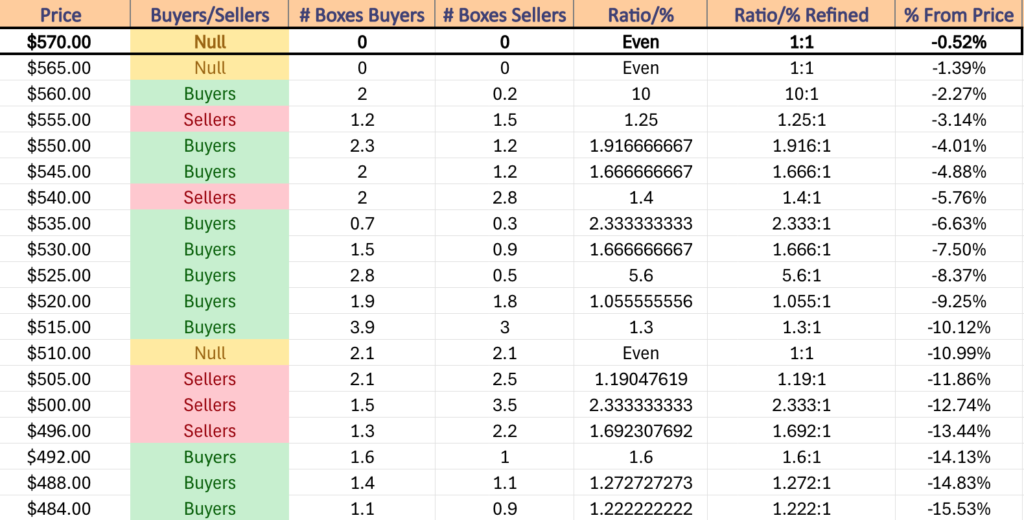
SPY has support at the $570.68 (10 Day Moving Average, Volume Sentiment: NULL, 0:0*), $563.43 (Volume Sentiment: Buyers, 10:1), $562.48 (Volume Sentiment: Buyers, 10:1) & $553.17/share (Volume Sentiment: Buyers, 1.92:1) price levels, with resistance at the $574.71/share (All-Time High, Volume Sentiment: NULL, 0:0*) price levels.
QQQ, the Invesco QQQ Trust ETF that tracks the NASDAQ 100 added +0.12% last week, having the second strongest showing of the major four index ETFs.
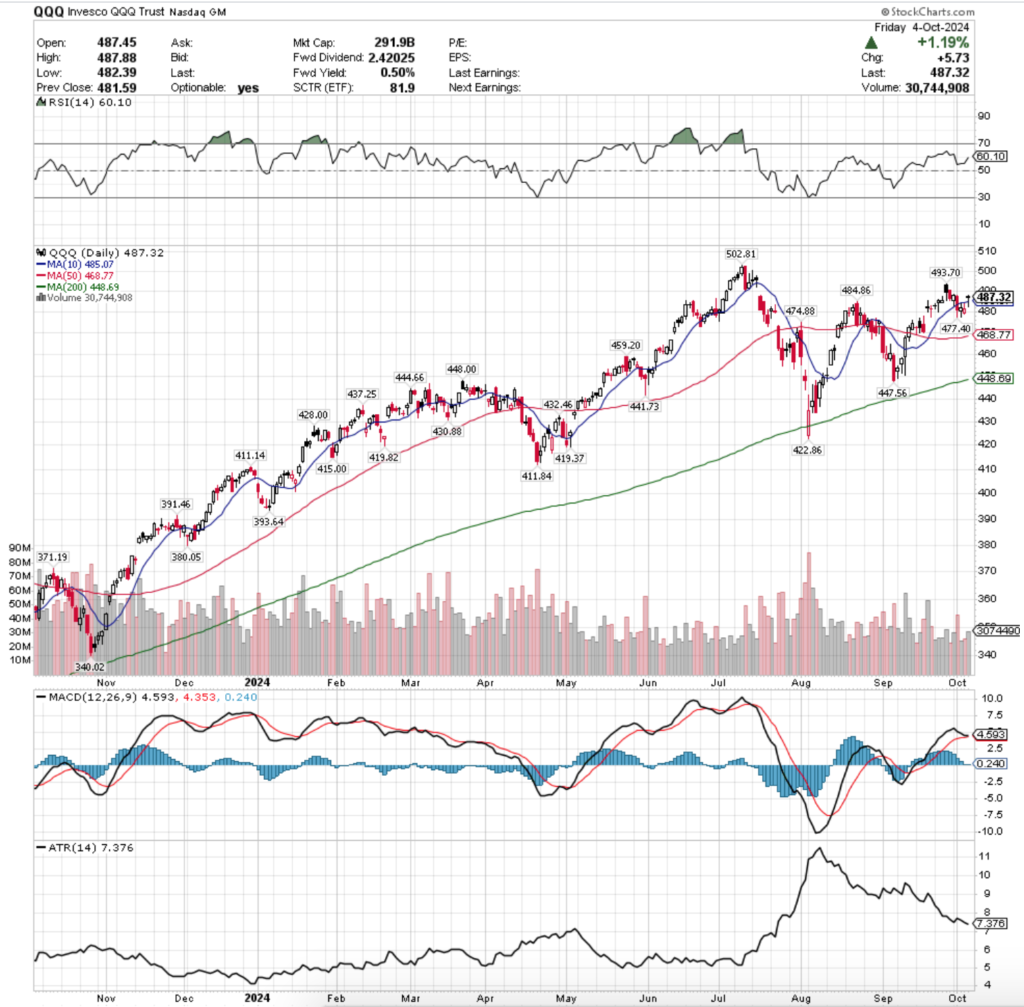
Their RSI is also trending higher towards overbought after Friday’s session & currently sits at 60.1, while their MACD remains bullish, but the MACD line is flat just above the signal line, which can lead to a bearish crossover in the coming days given how close together they are.
Volumes were -26.92% below the prior year’s average (30,578,000 vs. 41,840,661), as market participants are still not showing confidence or enthusiasm for the tech-heavy index.
Monday began on a similar shaky note as SPY, as while prices advanced for the session, they did test down to the 10 day moving average’s support during the sessions, indicating that there was downside appetite & blood in the water.
Bears came out in full force Tuesday, forcing prices to decline through the 10 DMA’s support on the week’s highest volume as investors began to show that QQQ is not on stable footing in the near-term & despite clawing back from the lows of the day’s candle’s lower shadow it was unable to close above the 10 DMA.
Wednesday the weakness & indecision theme continued, with QQQ opening lower, testing lower throughout the day & ultimately closing as a spinning top candle, indicating indecisiveness.
The 10 DMA’s resistance held up strength & it was the lowest volumes of the week, showing that there was not much conviction or enthusiasm for market participants to see QQQ go higher.
Thursday opened on a gap down & the bulls came back out to play, forcing QQQ higher, but still not being able to rally enough to force the close above the 10 DMA’s resistance, and the session closed out midway between the real body of Wednesday’s candle.
Friday reflected similar price movement that SPY saw, where a gap up day closed as a hanging man candle that closed lower than it opened while having crossed below the 10 DMA’s support, but managing to close above it.
This week keep an eye on the 10 DMA’s strength of support, as once it becomes a resistance level the recent tests have proven that it is likely to remain one for a while, as investors have not been keen to pick up risk much near it this past week.
The other primary concerns of last week are all still in play this week & can be found here: 9/29/2024’s Market Review Note.
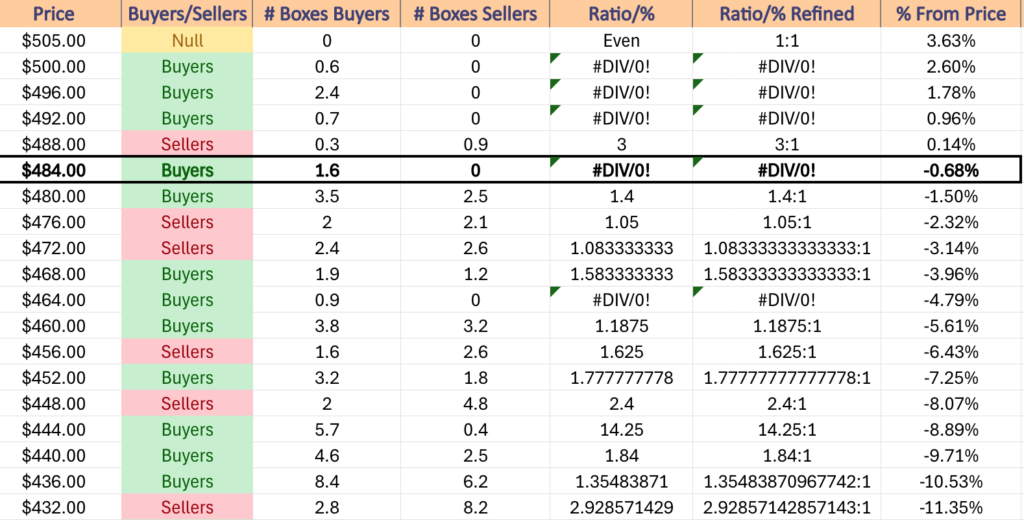
QQQ has support at the $485.07 (10 Day Moving Average, Volume Sentiment: Buyers, 1.6:0*), $484.86 (Volume Sentiment: Buyers, 1.6:0*), $477.40 (Volume Sentiment: Sellers, 1.05:1) & $474.88/share (Volume Sentiment: Sellers, 1.08:1) price levels, with resistance at the $493.70 (Volume Sentiment: Buyers, 0.7:0*) & $502.81/share (All-Time High, Volume Sentiment: Buyers, 0.6:0*) price levels.
IWM, the iShares Russell 2000 ETF declined -0.54% last week, as the small cap index was the least favored among market participants.
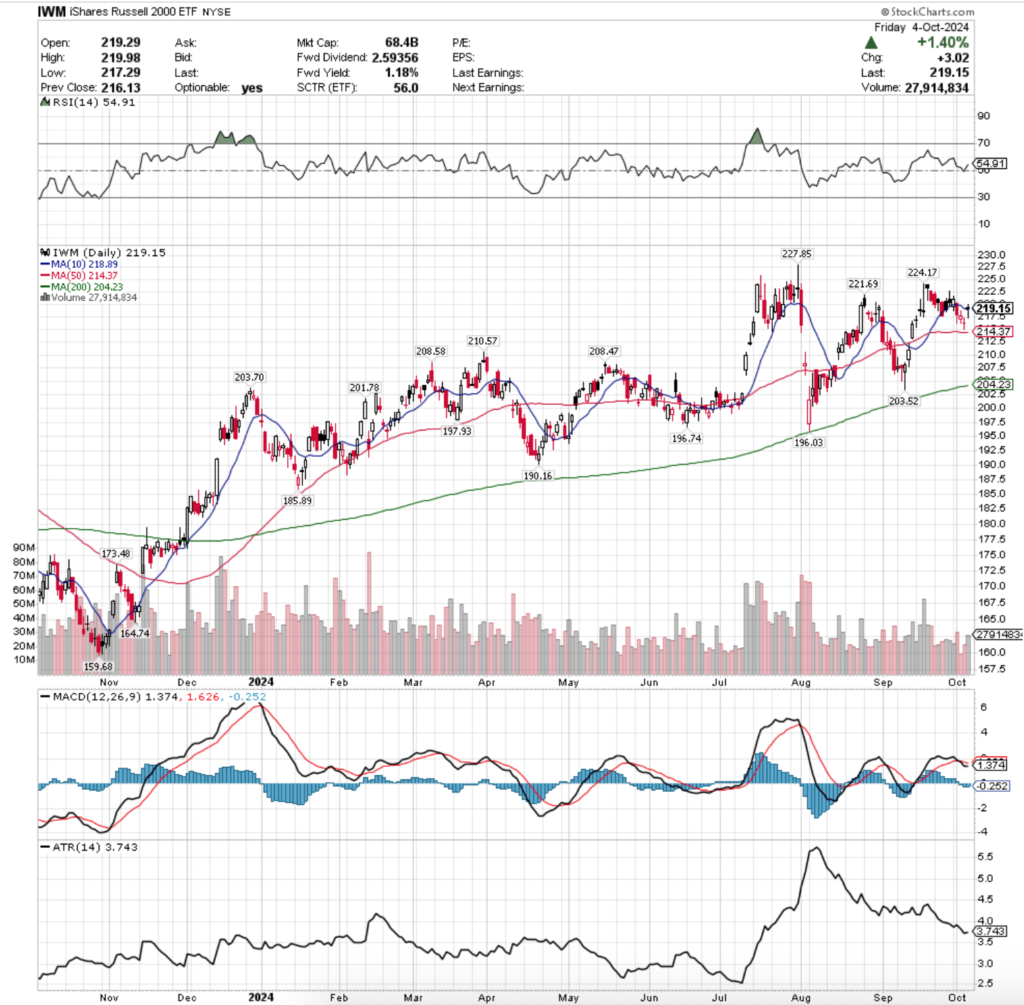
Their RSI just bounced off of the neutral 50 mark & is moving higher towards overbought territory following Friday’s gap up session, while their MACD has crossed over bearishly last week.
Despite this bearish crossover the MACD line has flattened out, but it still sits beneath the signal line & is not likely to break above it this week, unless there is some major revelation that comes from the FOMC Minutes that not one has priced in, or a surprise in inflation data from CPI/PPI.
Volumes were also the lowest of all index ETFs, coming in -34.03% lower than the previous year’s average volume (23,138,000 vs. 35,072,964), as market participants have been less eager to get into small cap names over the past couple of weeks, after a rally in the index in the two weeks before that.
Monday started off IWM’s week on an ominous note, as IWM opened below the 10 day moving average, tested further lower, before rallying higher on volume that was average for the week (3rd highest), which was not a clear sign of strength & bullish conviction.
Tuesday the weakness really began to show, as the session opened about midway between the real body of Monday’s candle, but sellers drove the price down to below the $217.50/share mark & despite bull’s best efforts, the day closed out as a declining session.
Needless to say, this also happened to have been the highest volume session of the week, signaling that there was a lot of folks ready to hop out of the IWM pool at the price levels tested, and that while there was some appetite to push prices higher, the day’s close was still below the midway mark of the day’s range.
Wednesday the declines continued & indecision remained king as the session ended in a spinning top, but the close was higher than the opening gap down, signaling that there were muted signs of optimism for the small caps, and volumes were the lowest of the week.
Thursday’s long legged doji candle showed a lot of indecision & uncertainty in the small cap world for IWM, as prices covered the $217.23-215.08 range throughout the day, only to close slightly lower than they opened.
Friday’s +1.4% gap higher session was able to close above the 10 day moving average’s resistance, however the majority of the day’s price action took place below the 10 DMA’s resistance & the close was lower than the open, indicating weakness.
Friday did have the second highest volume of the week, which would be expected based on the wide range of prices that were tested that day, particularly to the downside.
Last week’s thoughts about the week ahead for IWM are all still also largely in play, as ultimately the week took a decline but only lost -0.54% W-o-W.
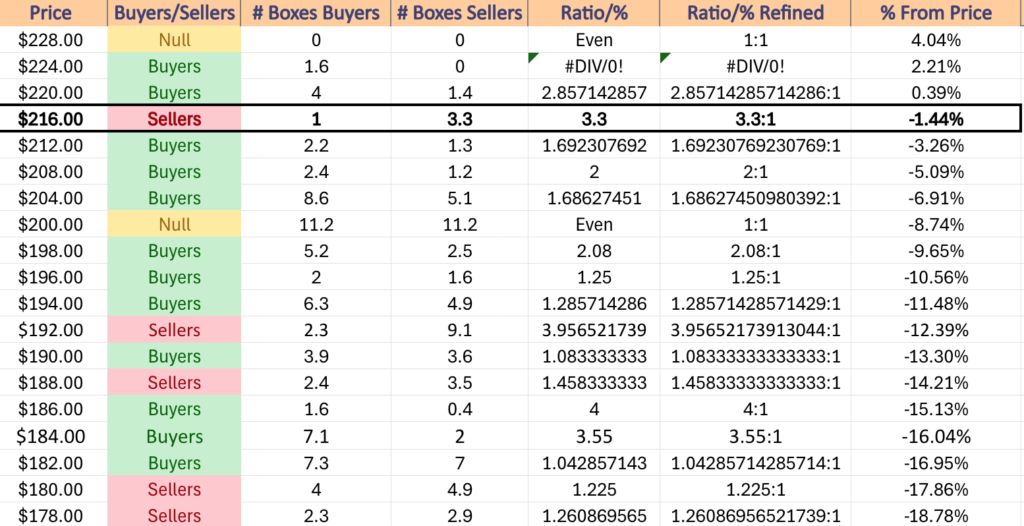
IWM has support at the $218.89 (10 Day Moving Average, Volume Sentiment: Sellers, 3.3:1), $214.37 (50 Day Moving Average, Volume Sentiment: Buyers, 1.69:1), $210.57 (Volume Sentiment: Buyers, 2:1) & $208.58/share (Volume Sentiment: Buyers, 2:1) price levels, with resistance at the $221.69 (Volume Sentiment: Buyers, 2.86:1), $224.17 (Volume Sentiment: Buyers, 1.6:0*) & $227.85/share (52-Week High, Volume Sentiment: Buyers, 1.6:0*) price levels.
DIA, the SPDR Dow Jones Industrial Average ETF gained +0.11% last week, as investors were not overly eager to keep pushing higher after hitting recent all-time highs.
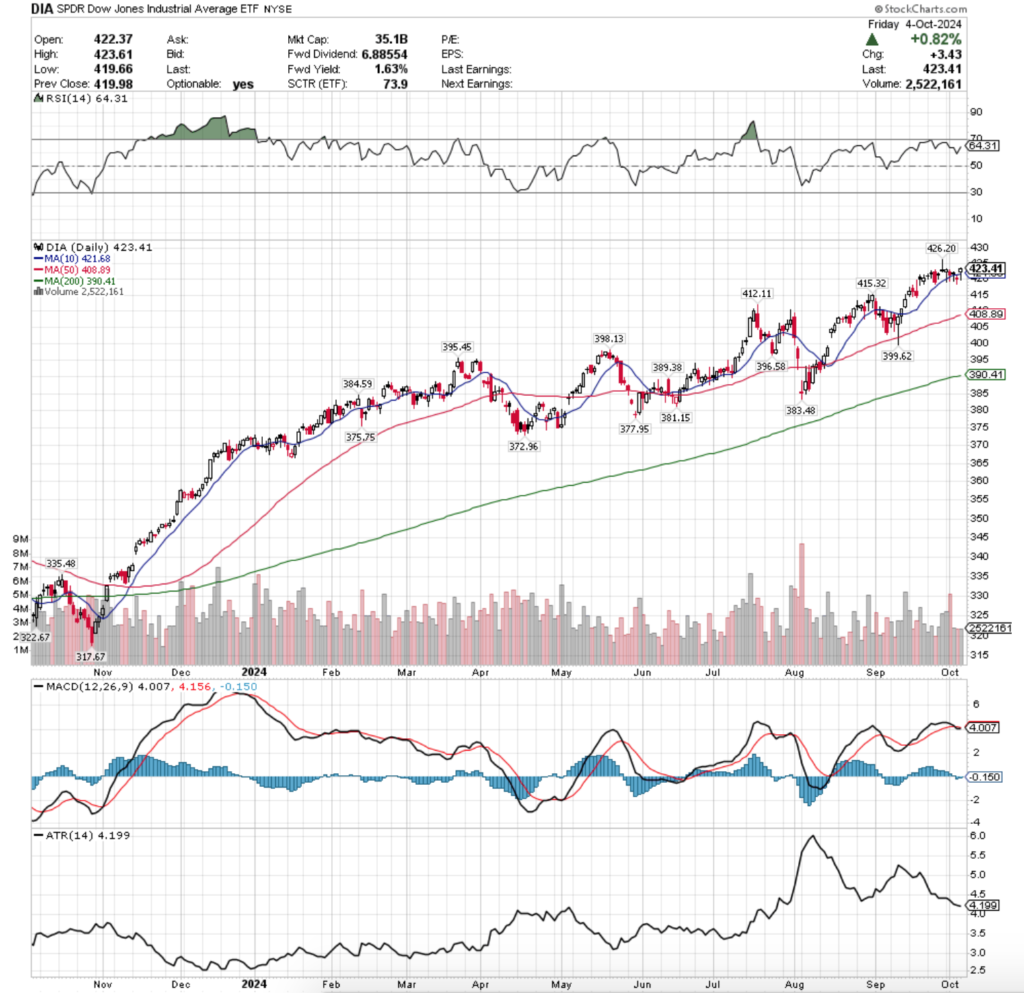
Their RSI is trending towards overbought levels & sits at 64.31 following Friday’s performance, while their MACD crossed over bearishly last week & remains below the signal line.
Volumes were -6.32% below the previous year’s average (3,314,000 vs. 3,537,391), and one thing of note is how the largest volume spike of the week was for a declining session.
Monday set the stage with a hanging man candle with “long legs” based on the lower shadow & appetite for downside DIA price movement it showed, as prices broke through the support of the 10 DMA before rallying back to close for an advancing session.
Tuesday opened lower, tested in the real body of Monday’s candle, before dunking below the 10 DMA & returning to close lower for the day straddling the waterline of the 10 DMA.
Again, the volume of Tuesday’s downside action speaks volumes about how market participants feel right now, as profit takers were met by enough buyers to still force prices back up to the 10 DMA.
Wednesday the negative sentiment continued, as prices opened in the middle of Tuesday’s real body, did not get much higher & ultimately dipped below the 10 DMA’s support again.
Bulls rushed in & were able to force the price to just back above the 10 DMA’s support level, but the session closed lower than it opened & the volumes for the day reflect low participation levels, meaning that despite the “positive” close, there was quite a bit to be negative about.
Thursday confirmed this when prices gapped lower, test higher towards the 10 DMA’s resistance but were rejected, only to test far lower & still close as a decline.
While there were enough buyers to force a large lower shadow, volumes were still meager; hardly a vote of confidence.
Friday DIA saw the same good fortunes as every index ETF above, a gap up open that was above the 10 DMA’s support, but they broke below it for a while before rallying to close higher & end the day with a hanging man candle on low volume.
This is reflecting bearish sentiment for the blue chip index, and all of last week’s observations for the week ahead items to watch are still in play.
Thank you for referring back to last week for these observations while I am working on this with limited time compared to usual.
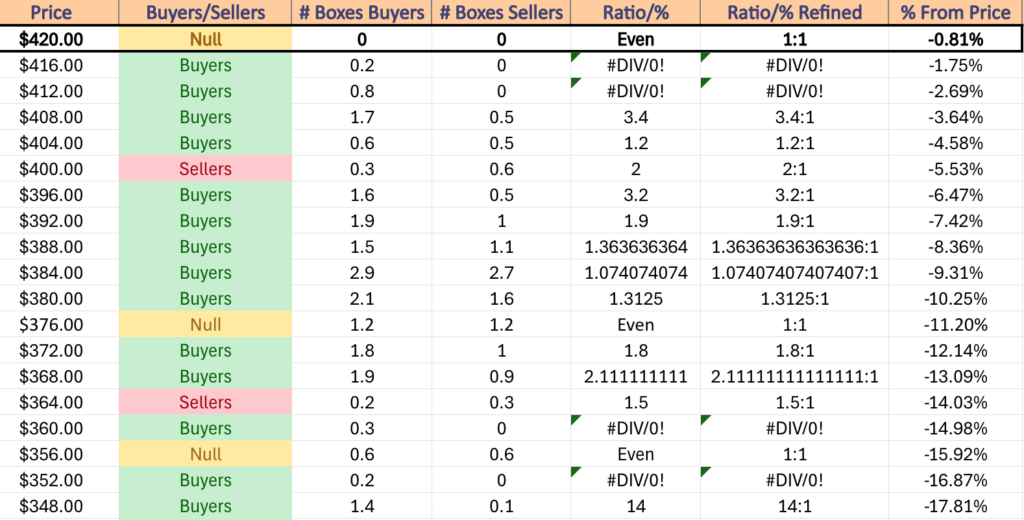
DIA has support at the $421.68 (10 Day Moving Average, Volume Sentiment: NULL, 0:0*), $415.32 (Volume Sentiment: Buyers, 0.8:0*), $412.11 (Volume Sentiment: Buyers, 0.8:0*) & $408.89/share (50 Day Moving Average, Volume Sentiment: Buyers, 3.4:1) price levels, with resistance at the $426.20/share (All-Time High, Volume Sentiment: NULL, 0:0*) price levels.
The Week Ahead
Monday the week kicks off with Fed Governor Bowman speaking at 1pm, Consumer Credit data at 3pm & Fed President Musalem speaking at 6:30 pm.
Tuesday morning’ earnings calls feature PepsiCo & Accolade.
Fed Governor Kugler speaks at 3 am Tuesday, followed by NFIB Optimism Index data at 6 am, U.S. Trade Deficit data at 8:30 am, Fed President Bostic speaking at 12:45 pm & Fed Vice Chair Jefferson speaking at 7:30 pm.
Helen of Troy reports earnings Wednesday before the opening bell, with AZZ due to report following the closing bell.
Wednesday features Fed President Bostic speaking at 8 am, Fed President Logan speaking at 9:15 am, Wholesale Inventories data & Fed President Goolsbee speaking at 10:30 am, FOMC Minutes From The Fed’s September Meeting at 2pm & Fed President Daly speaking at 6 pm.
Thursday morning’s earnings reports include Delta Airlines, Domino’s Pizza, Neogen & Tilray.
Initial Jobless Claims, Consumer Price Index, Core CPI & Core CPI Year-over-Year data are all released at 8:30 am Thursday, before Fed Governor Cook speaks at 9:15 am, Fed President Barkin speaks at 10:30 am & Fed President Williams speaks at 11 am.
JP Morgan Chase, BlackRock, BNY Mellon, Fastenal & Wells Fargo are all due to report earnings before Friday’s opening bell.
Friday morning starts off with Producer Price Index, Core PPI, PPI Year-over-Year & Core PPI Year-over-Year at 8:30 am, Fed President Goolsbee speaks at 9:45 am, Consumer Sentiment (prelim) comes in at 10 am, Fed President Logan speaks at 10:45 am & Fed Governor Bowman speaks at 1:10 pm to wind down the week.
See you back here next week!
*** I DO NOT OWN SHARES OR OPTIONS CONTRACT POSITIONS IN SPY, QQQ, IWM OR DIA AT THE TIME OF PUBLISHING THIS ARTICLE ***