SPY, the SPDR S&P 500 ETF gained +4.75% last week, while the VIX closed the week at 14.94, indicating an implied one day move of +/-0.94% & an implied one month move of +/-4.32% for the S&P 500.
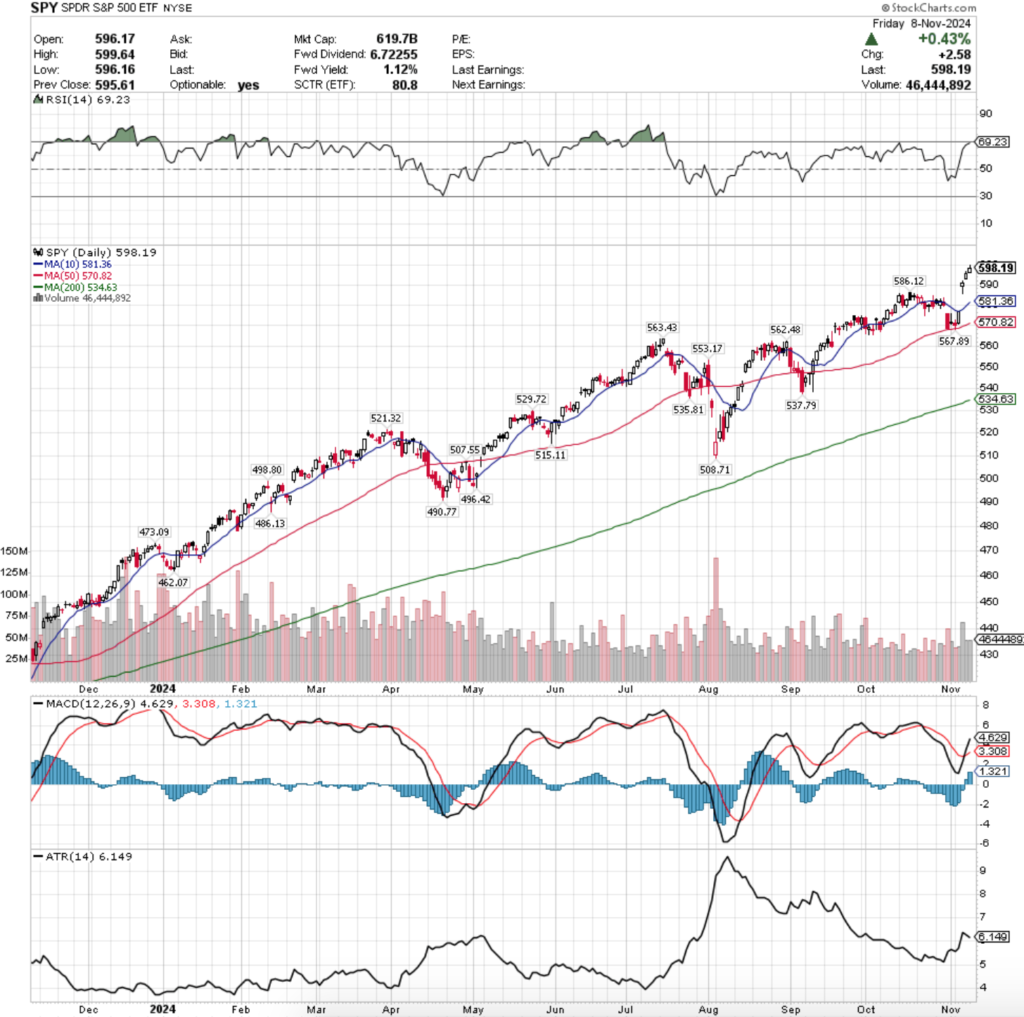
Their RSI is trending into overbought territory in the wake of last week’s performance & currently sits just below it at 69.23, while their MACD crossed over bullishly on Thursday morning.
Volumes were still extremely light though, coming in -21.85% below the prior year’s average (47,910,000 vs. 61,308,656), which as we’ve highlighted in prior weeks’ notes is down drastically from even just seven month’s ago’s prior year’s average volume.
While there was some enthusiasm as a result of the US Presidential election & the FOMC Interest Rate decision the participation rate is still low following mid-April.
Last week opened on a note of uncertainty, as the session’s candle stayed within the range of the previous Thursday’s candle & the support of the 50 day moving average held up, although volumes were light.
Tuesday the low volume continued, but the session resulted in an advance that closed in line with the resistance of the 10 day moving average as folks anxiously awaited the results of the US election.
Wednesday saw enthusiasm rush through the markets, as the highest volume of the week led to a 2.5% gap up for SPY that opened well above the 10 day moving average’s resistance, but it came with a note of caution.
The day’s candle resulted in a hanging man, which has bearish implications & signals that there was a bit of downside appetite despite the day’s higher close.
The good times rolled on into the weekend when Thursday opened on another gap up session higher & Friday produced a +0.43% gain.
Friday’s candle offered another glimmer of caution as well, as while the upper shadow on the day’s candle is not long enough for the candle to be a shooting star, the day’s open & close were concentrated on the lower end of the candle.
Heading into the new week it will be interesting to see if there is enough momentum to continue SPY’s climb higher, or if there will be a cool off period.
Their MACD suggests that there may still be some fuel in the tank to the upside, but their RSI is nearing the overbought level, which is something investors should be mindful of in the days to come.
Another key area of interest will be how price behaves in regards to the window that was created by Wednesday’s gap up.
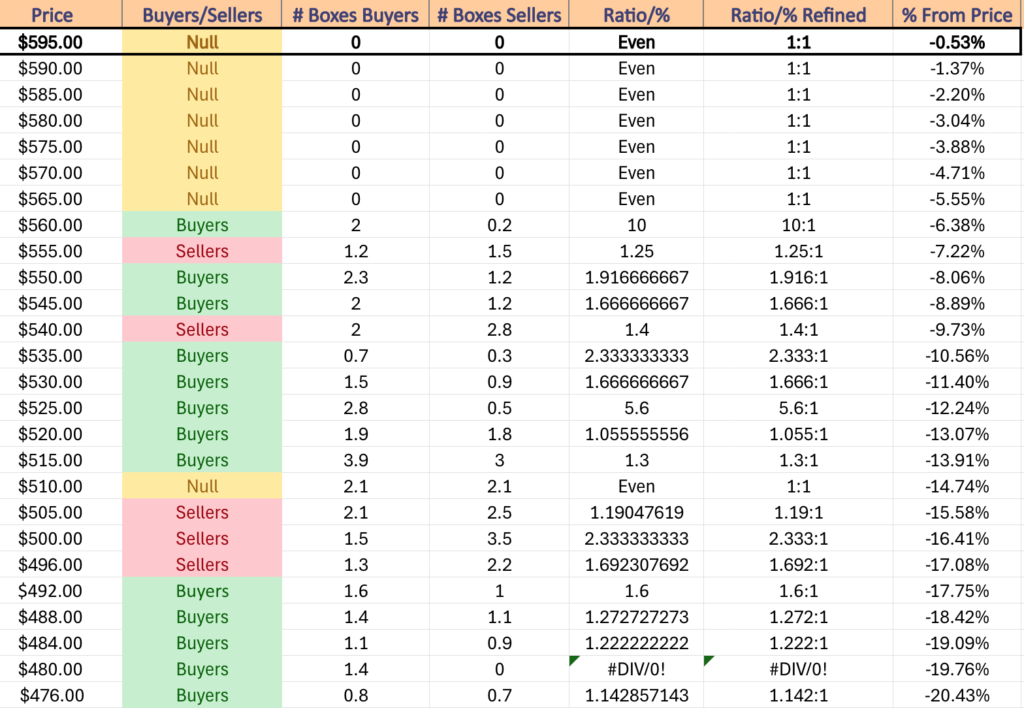
Due to the fact that we’re near all-time highs there is not enough volume sentiment data to assess the strength of the nearby support levels for SPY, as the $586.12 & 10 day moving average at $581.36 both fall within the window.
In the event it begins to fill then the strength of the 50 DMA’s support will be something else to keep an eye on to see if it can provide stable enough footing for SPY to consolidate & broaden.
SPY has support at the $586.12 (Volume Sentiment: NULL, 0:0*), $581.36 (10 Day Moving Average, Volume Sentiment: NULL, 0:0*), $570.82 (50 Day Moving Average, Volume Sentiment: NULL, 0:0*) & $567.89/share (Volume Sentiment: NULL, 0:0*) price levels, with resistance at the $599.64/share (All-Time High, Volume Sentiment: NULL, 0:0*) price levels.
QQQ, the Invesco QQQ Trust ETF that tracks the NASDAQ 100 climbed +5.48% last week, as investors were eager to get into the tech focused index.
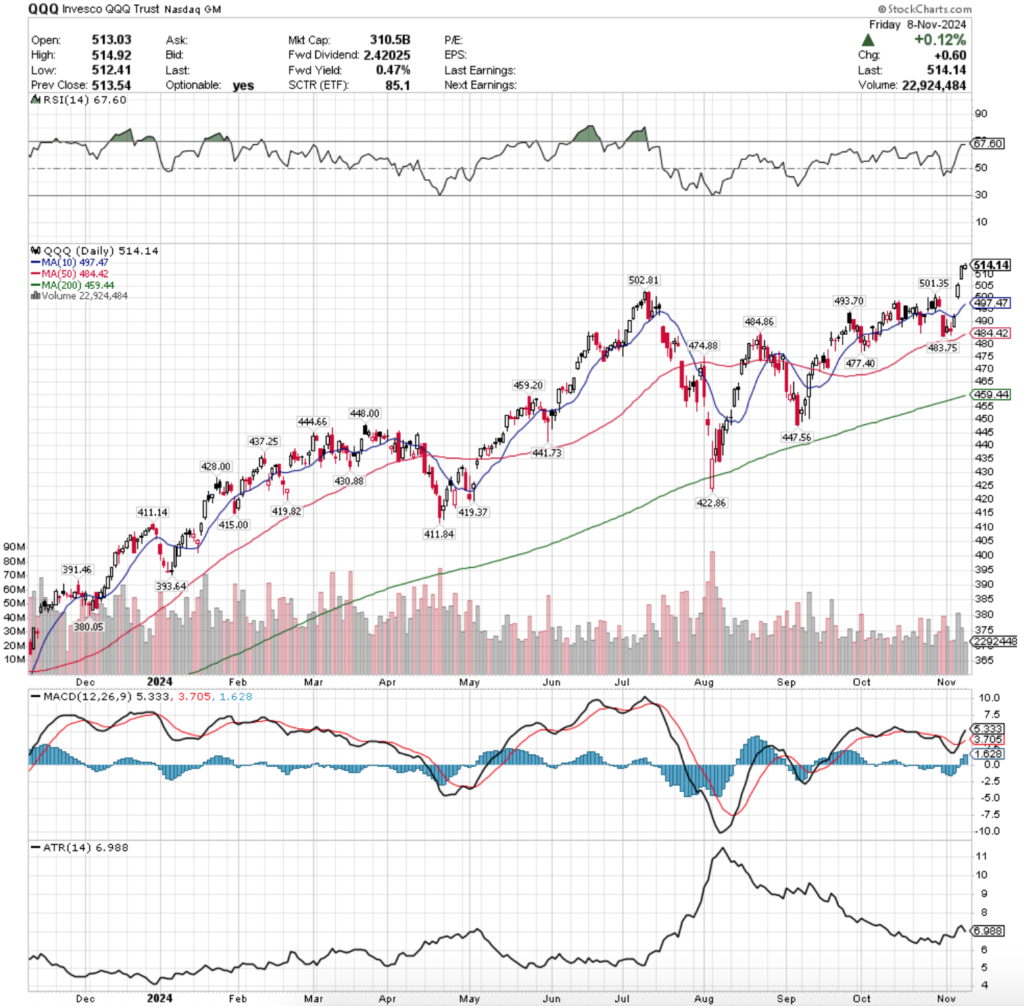
Their RSI has flattened out after advancing towards the overbought level & currently sits at 67.6, while their MACD crossed over bullishly on Thursday.
Volumes were -25.25% below the previous year’s average volume (29,298,000 vs. 39,196,719), indicating that there is still a severe lack of participation much like SPY.
SPY & QQQ have both benefitted dramatically from the AI/Data Center/Semiconductor trades of the past couple of years & it now appears as though investors are pivoting away in favor of the small cap names in IWM & the blue chip index of DIA.
Accordingly, QQQ’s week went very similar to SPY’s, starting off on an uncertain note Monday when the session resulted in a slight decline & a high wave spinning top candle that formed a bearish harami pattern with the day prior’s candle on low volume.
The next day opened in a gap up & ran up to test the resistance of the 10 day moving average, which was briefly broken but was unable to close above it.
Wednesday opened on a large gap up & the session continued higher, setting a new all-time high & closing above the $505/share price level on the highest volume of the week as investors were excited about the results of the election.
Thursday followed suit with another gap up day & all-time high as market participants were still pleased by Wednesday’s news.
Friday the week wound down on another high note, but the day’s candle did flash signal for caution ahead.
Friday’s candle opened lower than Thursday’s close but was able to push slightly higher, adding +0.12% for the day & setting a new all-time high, but it appears that the $514.92/share level is where investors lost enthusiasm & may signal the top in the near-term.
Entering this week it will be interesting to see if there are some profits taken which would push prices down to begin filling in the gaps of last week.
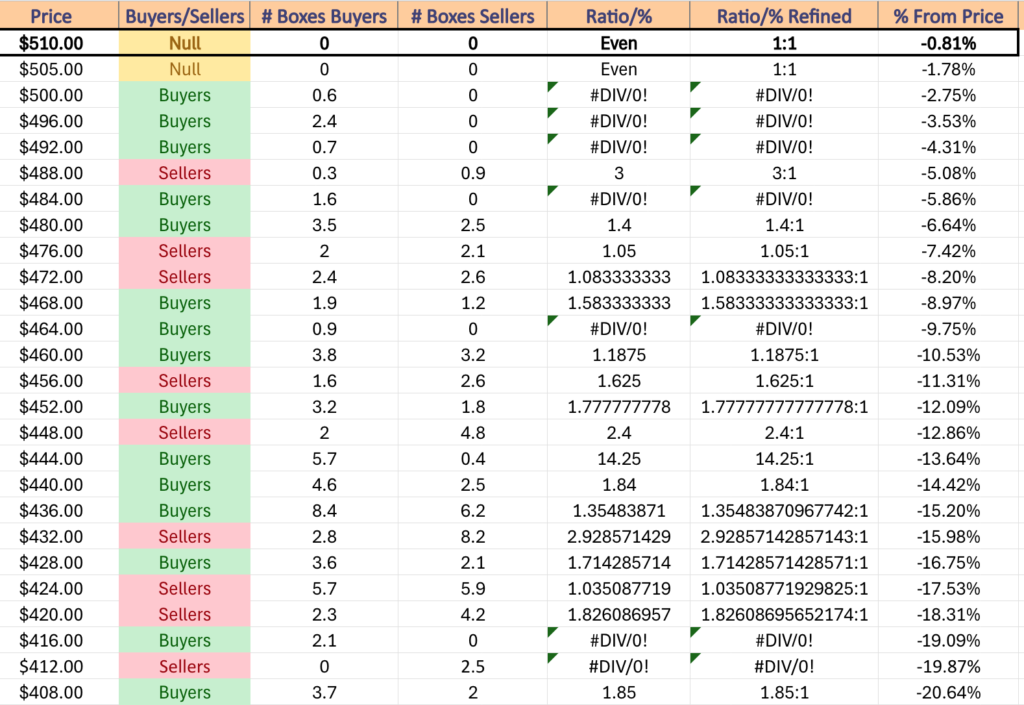
QQQ has more local support than SPY did that may help keep prices propped up & from declining too low below the window, but that will be heavily dependent on how much volume we see on declining days.
The $502.81 & $501.35/share points will be interesting to follow, as they were only broken through on account of gaps, which could make for a false breakout based on the low volume levels.
Any decline will be worth keeping an eye on as well to see if the 10 & 50 DMAs hold up, especially now that the 200 DMA sits just -7.64% below the 10 DMA & -5.16% below the 50 DMA.
Prices tested against the 200 DMA in August & were able to rebound & climb higher, but the appetite to dip below it has already been shown once in the past year & can’t be ruled out again.
QQQ has support at the $502.81 (Volume Sentiment: Buyers, 0.6:0*), $501.35 (Volume Sentiment: Buyers, 0.6:0*), $497.47 (Volume Sentiment: Buyers, 2.4:0*) & $493.70/share (Volume Sentiment: Buyers, 0.7:0*) price levels, with resistance at the $514.92/share (Volume Sentiment: NULL, 0:0*) price levels.
IWM, the iShares Russell 2000 ETF advanced +8.74% last week, as market participants flocked into small cap names in droves.
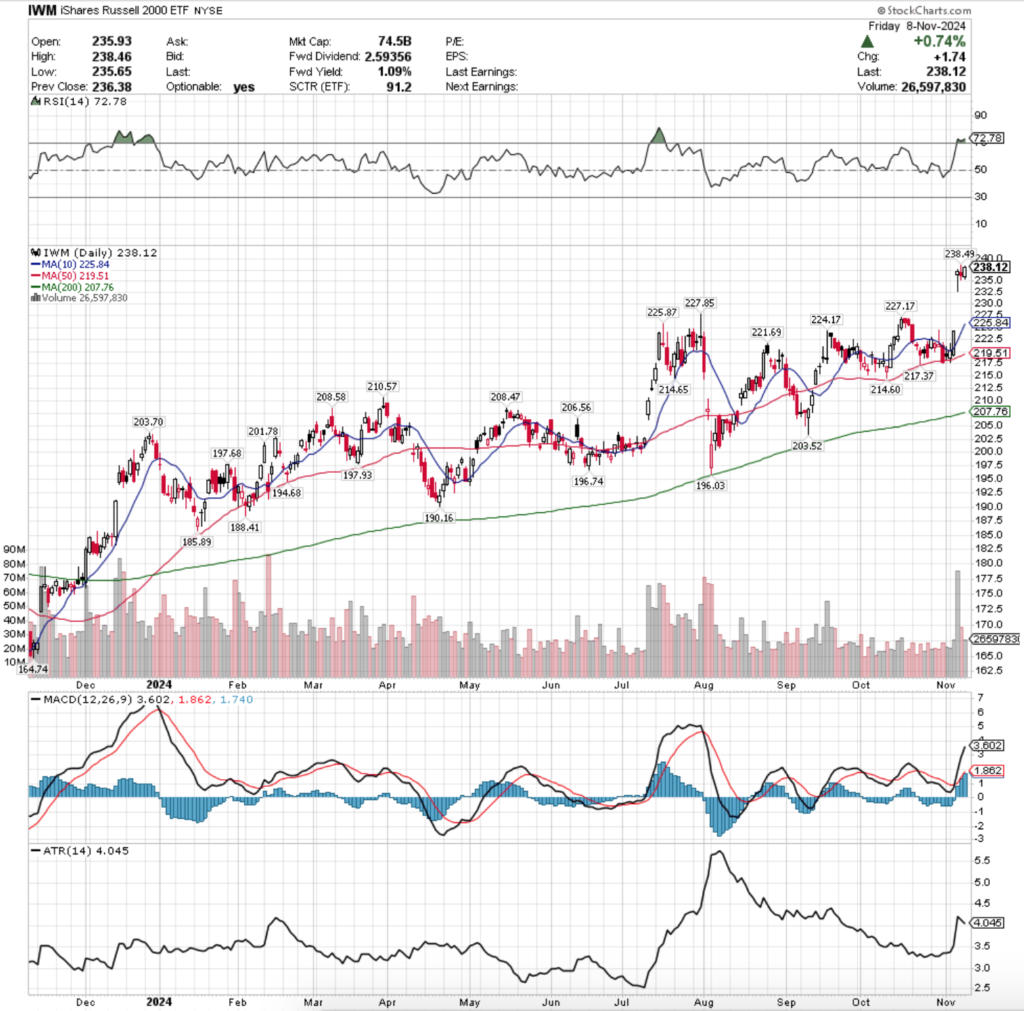
Their RSI has also flattened out, but in overbought territory & sits at 72.78, while their MACD crossed over bullishly on Wednesday.
Volumes were +9.69% above the previous year’s average levels (36,796,000 vs. 33,544,150), as investors were eager to get into small cap names following the US election & FOMC Interest Rate decision.
IWM’s week began on an interesting note, opening lower than Friday’s close, testing to below the support of the 50 DMA before breaking out upwards & crossing the resistance of the 10 DMA briefly before closing in-line with it.
Tuesday opened slightly lower before taking off running through the resistance of the 10 DMA & closing firmly above it.
IWM had a phenomenal Wednesday which accounted for +5.8% of the week’s gains as IWM gapped up, tested down to near the $232.50/share level before roaring back on high volume to close the session higher.
It should be noted that the day resulted in a hanging man candle which carries bearish implications with it, as despite the day’s gain there showed to be plenty of appetite for prices to head to the downside as well.
Despite most of it likely coming from profit taking after the gap, it is still something to consider moving forward, particularly if IWM is unable to continue higher as it will then give a rough idea as to the near-term range it may trade in.
Thursday flashed more warning signs for IWM though, as the session opened lower, tested higher to hit a new all-time high, before collapsing down to near the $235/share mark & settling down for the day.
While Friday’s +0.74% gain created a bullish engulfing candle, the volume sentiment behind it was severely lackluster & does not show much strength & conviction behind the move.
This coming week will be important to track the direction of volume to assess whether or not the current island that was set up last week will be sustainable & if not, how far the declines may be.
The $227-227.85/share level will be the first line of defense for IWM in terms of support, unless the 10 DMA moves higher in the meantime before those levels are tested.
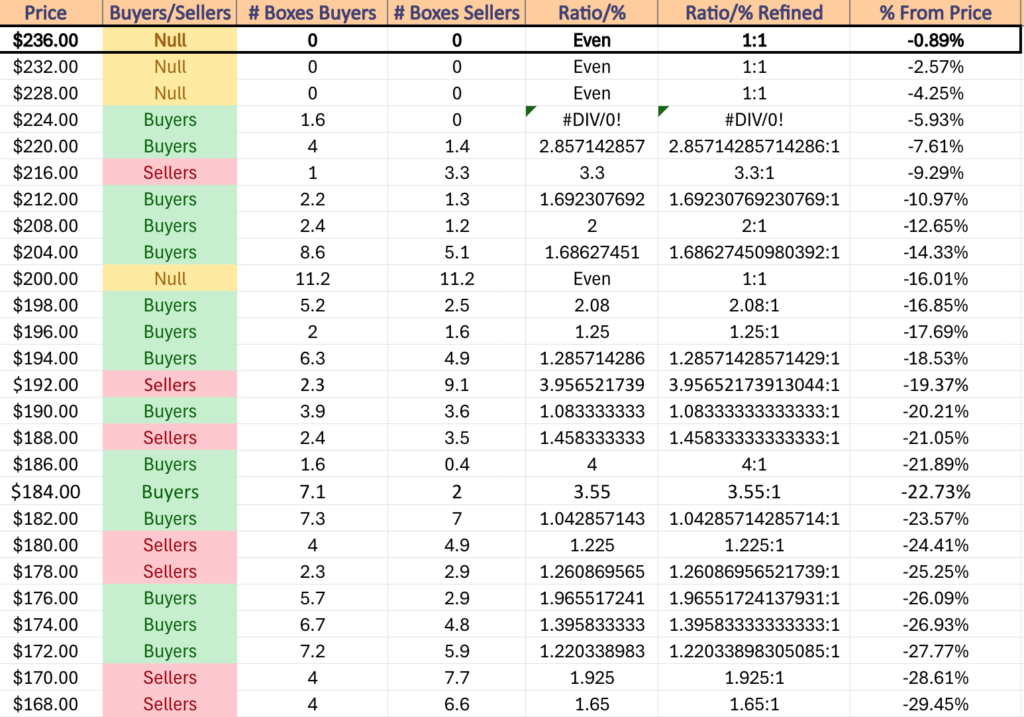
In the event of a breakdown, IWM has many more local support levels than SPY or QQQ due to the rangebound oscillations it advances in vs. the latter two indexes more steep ascents & rapid growth.
IWM has support at the $227.85 (Volume Sentiment: Buyers, 1.6:0*), $227.17 (Volume Sentiment: Buyers, 1.6:0*), $225.87 (Volume Sentiment: Buyers, 1.6:0*) & $225.84/share (10 Day Moving Average, Volume Sentiment: Buyers, 1.6:0*) price levels, with resistance at the $238.49/share (All-Time High, Volume Sentiment: NULL, 0:0*) price levels.
DIA, the SPDR Dow Jones Industrial Average ETF jumped +4.68% last week, as investors wanted exposure to the blue chip index following the week in news.
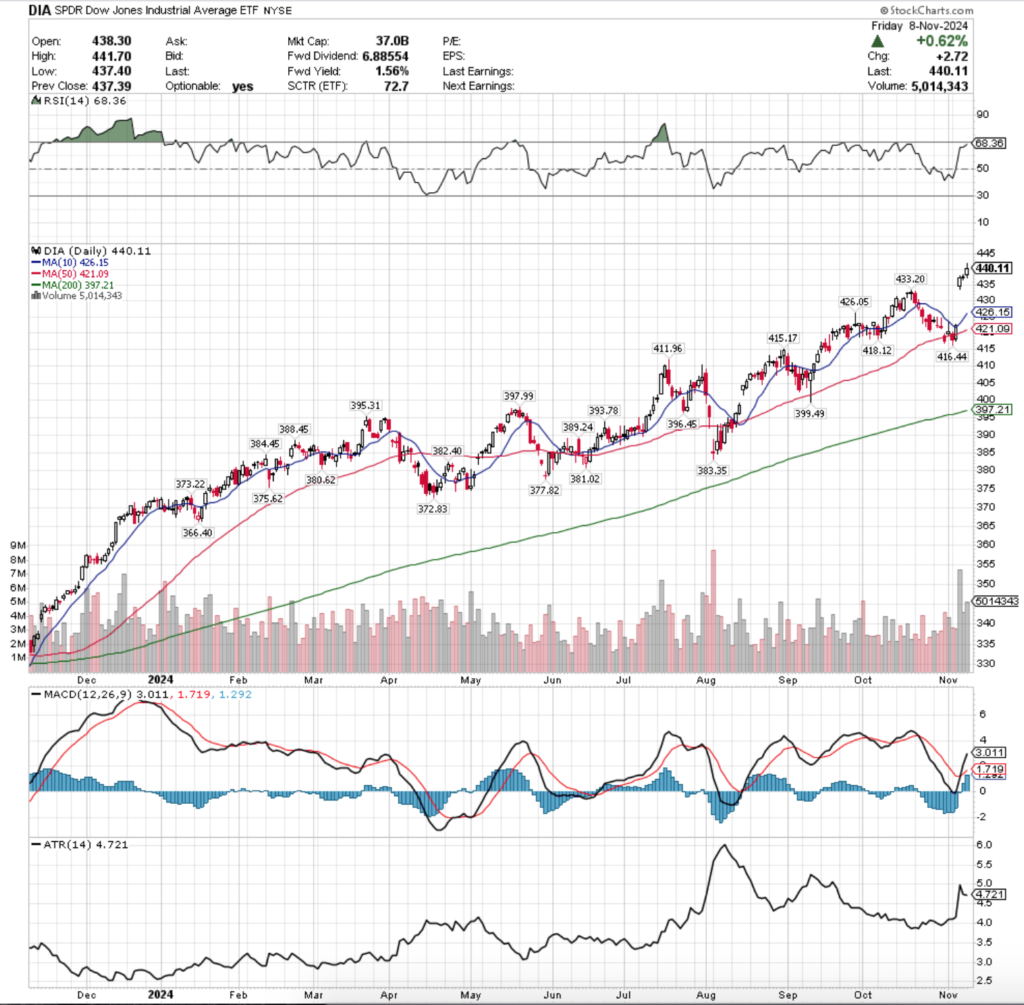
Their RSI is trending towards overbought levels & is currently at 68.36, while their MACD crossed over bullishly on Thursday.
Volumes were +31.68% above the previous year’s average (4,554,000 vs. 3,458,379), as investors showed that they clearly were seeking the protection of the blue chip names while at all-time highs.
Monday opened the week up the same as SPY & QQQ with a declining day where DIA opened lower, briefly tested higher before plunging through its 50 DMA’s support & recovered to close just below it.
Volumes were weak, a trend that continued into Tuesday when the session opened higher & powered above both the 50 & 10 DMA’s resistance levels to close above each, but again, on weak volume.
Wednesday saw a +3.5% advance on the heaviest volume of the week as DIA opened on a gap up & little profit taking took place based on the size of the lower shadow of the session’s candle.
Thursday’s price action began to show some doubt in the strength of the new all-time high set on Wednesday, as though the session advanced on solid volume, it closed lower than it opened & had a very narrow range (between a spinning top & a doji, but not entirely one or the other) between the day’s open & close.
This indicates that there was enough fuel to keep active participation going, but that there was not much appetite to take things higher & that market participants felt like they were at equilibrium.
Friday the gains continued with DIA advancing +0.62% on the day on the second highest volume of the week, but the size of the upper shadow on the day’s candle is cause for concern.
Bears clearly took the reigns back at $441.70 & forced the price back down to $440.11 & following the message of the prior day’s candle it appears that investors might be nearing the end of their rope on the near-term upside for DIA.
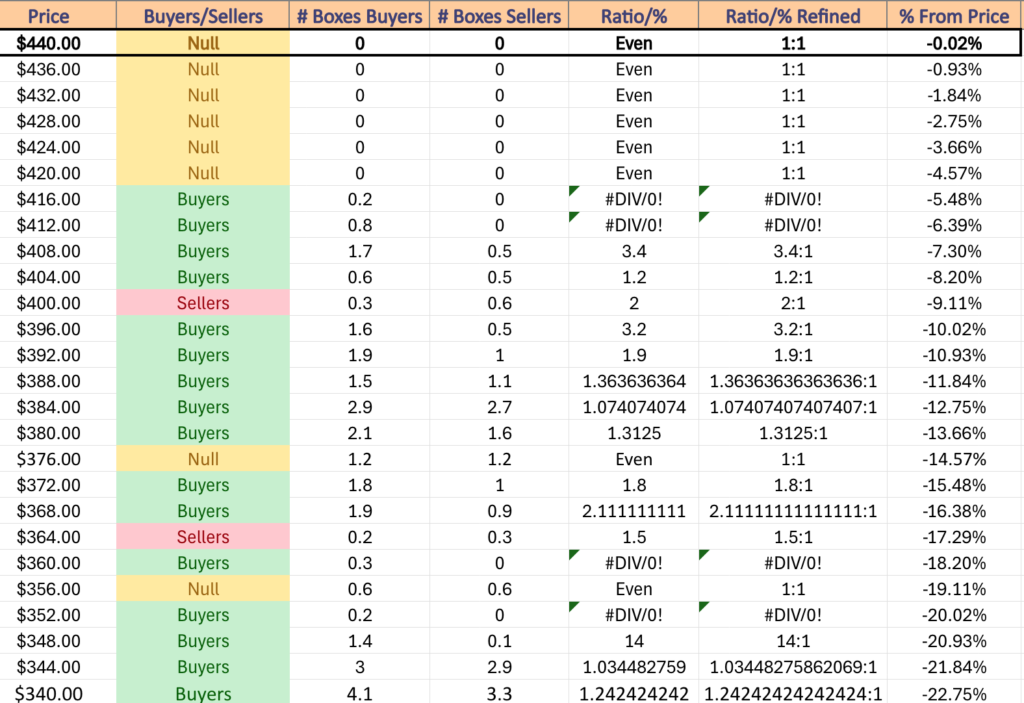
Much like the prior three index ETFs, this week all eyes will be on the window created Wednesday & whether or not it gets filled in the near-term.
Whether the above average volume continues for DIA will also be something to be aware of this coming week, as should it begin to falter there will likely be some risk-off movements by market participants that would force a test of the support of the 10 & possibly 50 DMAs.
Otherwise, in the event of decline the $426-426.50 level will be a zone to keep an eye on for support, as there is currently not much volume data about these price levels to gauge historic sentiment yet.
DIA has support at the $443.20 (Volume Sentiment: NULL, 0:0*), $426.15 (10 Day Moving Average, Volume Sentiment: NULL, 0:0*), $426.05 (Volume Sentiment: NULL, 0:0*) & $421.09/share (50 Day Moving Average, Volume Sentiment: NULL, 0:0*) price levels, with resistance at the $441.70/share (All-Time High, Volume Sentiment: NULL, 0:0*) price levels.
The Week Ahead
Monday is Veteran’s Day & the bond market will be closed.
Aramark & Monday.com report earnings on Monday morning before the opening bell, followed by Archrock, Assured Guaranty, James River Group, Kyverna Therapuetics, Luminar Technologies, Nevro, Talos Energy & Zeta Global after the session’s close.
Tuesday brings us NFIB Optimism Index data at 6am.
Home Depot kicks off Tuesday morning’s earnings calls, along with Alight, Alumis, AstraZeneca, Avadel Pharmaceuticals, Camtek, Endava, EVgo Inc., First Advantage, Genius Sports, Hertz Global, Hudbay Minerals, HUYA, IAC Inc., IHS Holding Limited, International Game Technology, Legend Biotech, Live Nation, Mirum Pharmaceuticals, Mosaic, Neumora Therapeutics, Northwest Natural, Novavax, On Holding, Pactiv Evergreen, Pagaya, Piedmont Lithium, Plug Power, Repligen, Roivant Sciences, Scholar Rock, Schrodinger, Sea Limited, Shift4 Payments, Shoals Technologies, Smith Douglas Homes, Sphere Entertainment, SpringWorks Therapeutics, Sunstone Hotel, Surgery Partners, Sylvamo, Target Hospitality, Tencent Music, TreeHouse Foods, Triumph Group & Tyson Foods, followed by Amdocs, American Healthcare REIT, Azenta, CAE, Cannae Holdings, CAVA Group, Chegg, Crinetics Pharmaceuticals, DHT, EverCommerce, Grab, Hudson Pacific Properties, ICU Medical, Instacart, Integral Ad Science, Light & Wonder, MARA Holdings, Natera, NCR Atleos, NeuroPace, Occidental Petroleum, OUTFRONT Media, Paragon 28, Paymentus, Perdoceo Education, Progyny, Prothena, PubMatic, Rackspace Technology, Repay Holdings, Rocket Lab USA, Seadrill Ltd, Skyworks Solutions, SoundHound AI, Spotify, Suncor Energy, TechTarget, Topgolf Callaway Brands, Xenon Pharmaceuticals & ZoomInfo after the closing bell.
Consumer Price Index, CPI Year-over-Year, Core CPI & Core CPI Year-over-Year data is all due for release Wednesday at 8:30 am, followed by the Monthly U.S. Federal Budget data at 2pm.
Wednesday morning’s earnings reports include Advanced Flower Capital, Arcos Dorados, CG Oncology, Curbline Properties, CyberArk Software, Dole, Enlight Renewable Energy, Griffon, Inhibrx Biosciences, James Hardie, Loar Holdings, Paysafe, Riskified, Shopify, Stratasys, Tower Semiconductor & UBS, with Cisco Systems, Beazer Homes, BrightView, Digi International, dLocal, Helmerich & Payne, Hillenbrand, Ibotta, J&J Snack Foods, Kulicke & Soffa, Nuvei, PACS Group, Sonos & Tetra Tech reporting after the closing bell.
Thursday brings us Initial Jobless Claims, Producer Price Index, PPI Year-over-Year, Core PPI & Core PPI Year-over-Year data at 8:30 am.
Walt Disney, Advance Auto Parts, Bilibili, JD.com, NetEase, NICE, Nomad Foods, Sally Beauty, Sally Beauty & ZEEKR Intelligent Technology Holding are all due to report earnings on Thursday morning before Applied Materials, ESCO Technologies, Globant, Mitek Systems & Post report after the session’s close.
Import Price Index, Import Price Index minus Fuel, Empire State Manufacturing Survey, U.S. Retail Sales & Retail Sales minus Autos data are all scheduled for release on Friday at 8:30 am, followed by Industrial Production, & Capacity Utilization data at 9:15 am & Business Inventories data at 10 am.
Friday morning’s major earnings call is Alibaba Group Holding.
See you back here next week!
*** I DO NOT OWN SHARES OR OPTIONS CONTRACT POSITIONS IN SPY, QQQ, IWM OR DIA AT THE TIME OF PUBLISHING THIS ARTICLE ***