SPY, the SPDR S&P 500 ETF added +0.65% last week, while the VIX closed at 15.95, indicating an implied one day move of +/-1.01% & a one month implied move of +/-4.61%.
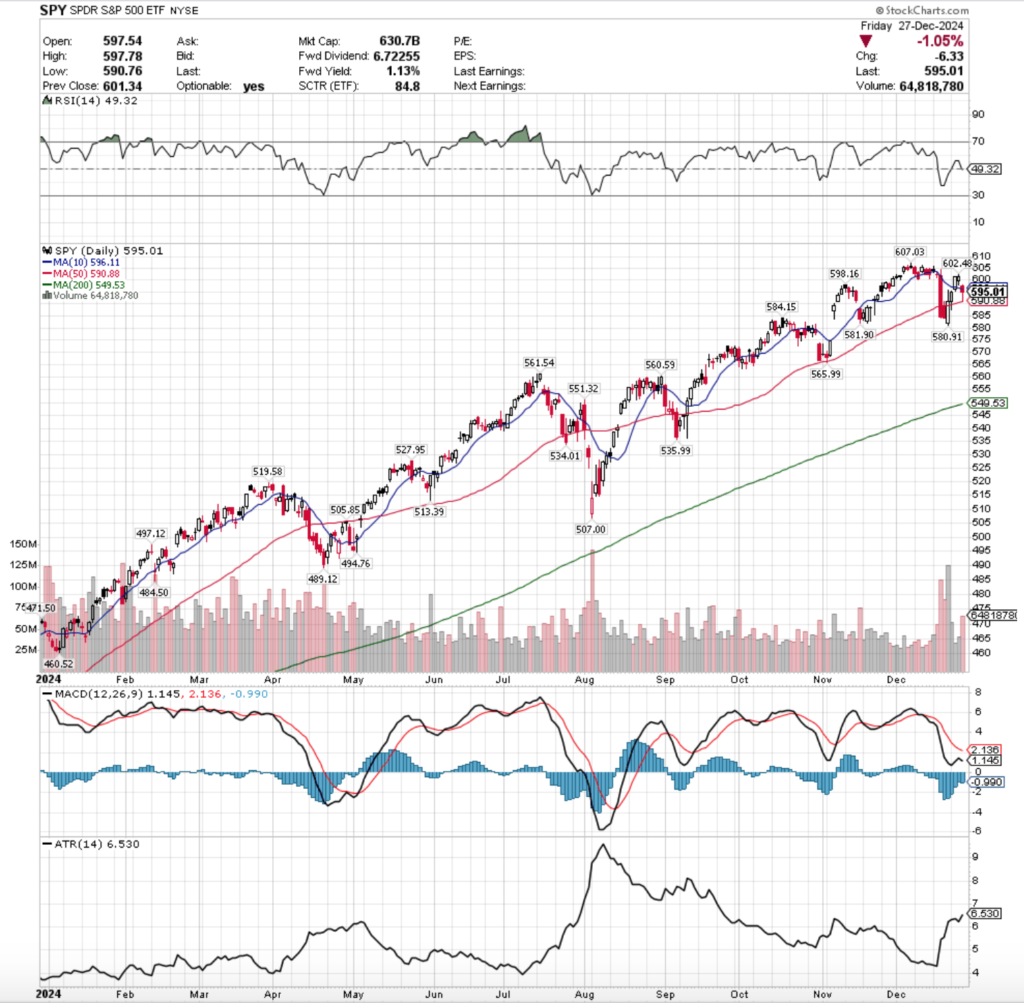
Their RSI just broke bearishly through the neutral 50 level & sits currently at 49.32, while their MACD has resumed its bearish descent.
Volumes were -14.68% lower than the prior year’s average (49,277,500 vs. 57,755,675), which is notable as Friday’s declining session had the highest volume of the shortened holiday week.
Monday continued the short-term reversal that was set into motion with the prior Friday’s breakout above the 50 day moving average’s resistance.
It should be noted though that the fragility noted in last week’s note was still in play on Monday, as the session opened above the 50 DMA’s support, but temporarily dipped below it, indicating that there was still downside appetite among investors, despite SPY powering higher to close close to the 10 DMA’s resistance.
Tuesday opened on a gap up to just below the 10 DMA, before powering higher to close above it, however the volume was weak, which can be attributed to the shortened trading session.
Christmas was Wednesday so there was no trading, but Thursday signaled that weakness was setting in.
Thursday SPY opened slightly lower, tested down to midway down Tuesday’s candle’s real body, before testing slightly above its close & settling marginally up for the day.
This set up Friday’s opening gap down to complete an evening star bearish pattern, as Friday opened just above the 10 DMA’s support, before breaking all the way down to the 50 DMA & settling down for the day on the week’s highest volume.
As noted in last week’s market note, the relationship between price & the 10 & 50 day moving averages will still be an area to focus on heading into the new year.
While volumes last week were higher relative to the weekly volumes of the past few months, they still were not high enough to drive a meaningful upward movement that would gather any traction.
Without seeing a meaningful increase in upside volume the evening star pattern will be in main focus moving into this week & next, particularly given how much profit taking took place on Friday.
As of writing this the 50 DMA’s support broke down already, leaving less support levels between SPY’s price & the long term trend (200 DMA).
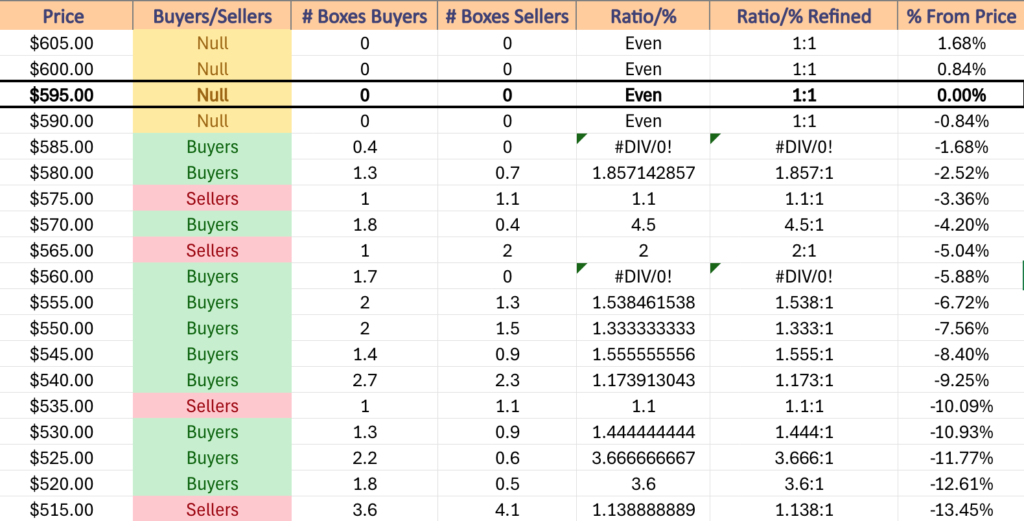
Should prices test the $580-584.99 price level they should have strong support given that there are three touch-points in that zone & that it has historically been dominated by Buyers at a rate of 1.86:1.
Should that break down the $570-579.99 price zones will be interesting to watch, as there are no formal support levels in that range, but there is Buyer dominated support at $570-574.99/share at a rate of 4.5:1.
If that window breaks down there is no support until $565.99/share, which occurs in a Seller dominated zone at a rate of 2:1 historically over the past ~2 years.
Declining to that support level would be a ~-5% decline from Friday’s close, and would open up SPY to further near-term declines based on support levels, which will be examined in more detail in next week’s note.
SPY has support at the $590.88 (50 Day Moving Average, Volume Sentiment: NULL, 0:0*), $584.15 (Volume Sentiment: Buyers, 1.86:1), $581.90 (Volume Sentiment: Buyers, 1.86:1) & $580.91/share (Volume Sentiment: Buyers, 1.86:1) price levels & resistance at the $596.11 (10 Day Moving Average, Volume Sentiment: NULL, 0:0*), $598.16 (Volume Sentiment: NULL, 0:0*), $602.48 (Volume Sentiment: NULL, 0:0*) & $607.03/share (All-Time High, Volume Sentiment: NULL, 0:0*) price levels.
QQQ, the Invesco QQQ Trust ETF advanced +0.75% last week, as the tech heavy index was the most favored of the major four index ETFs.
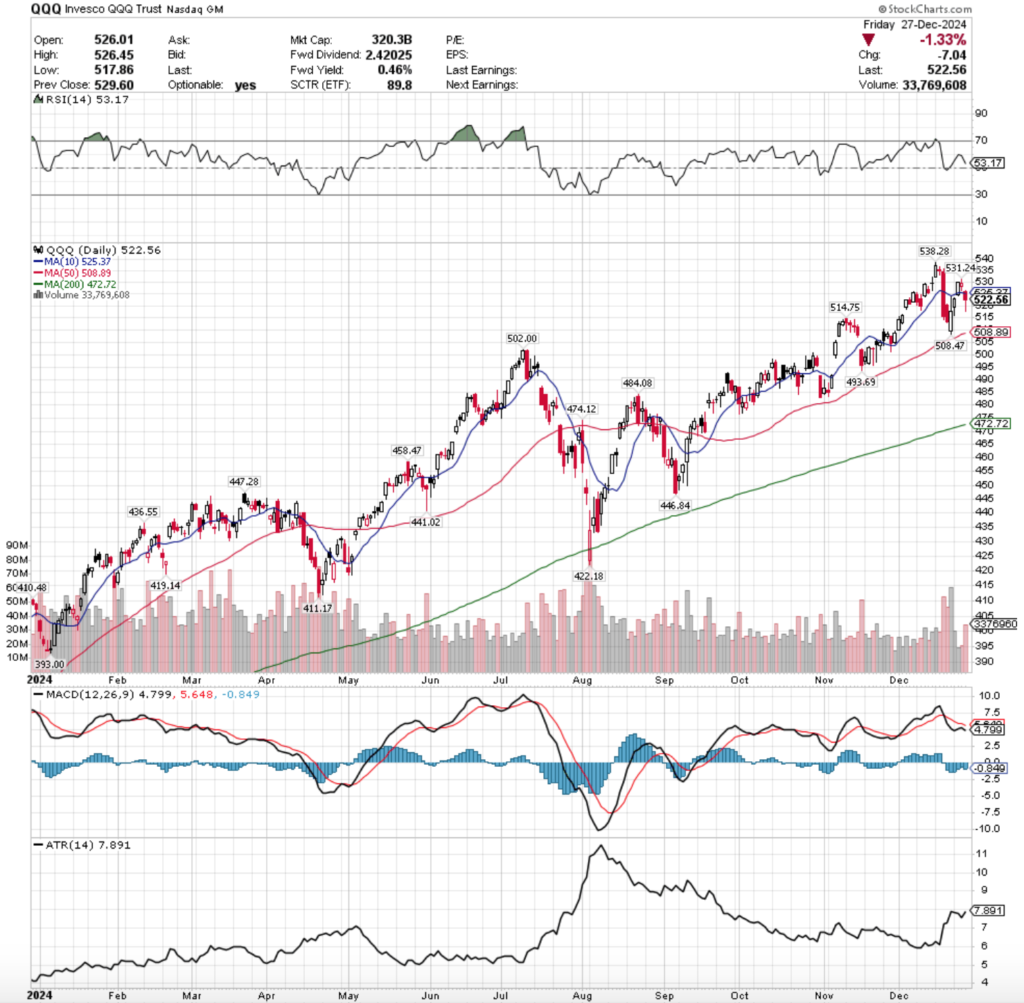
Their RSI is bearishly approaching the neutral 50 mark & sits currently at 53.17, while their MACD is continuing bearishly lower.
Volumes were -32.54% lower than the prior year’s average level (25,052,500 vs. 37,137,143), as market participants were very cautious to approach the tech heavy index.
Much like last week, QQQ’s chart is quite similar this week to SPY’s, as Monday kicked off continuing the ascent of Friday’s session on an opening gap up that temporarily retraced into Friday’s range, before climbing to close the day higher.
Tuesday opened on a gap up that opened near the 10 day moving average’s resistance & managed to break out above it to close higher on the day, but on the lowest volume of the week, indicating that there was waning sentiment among market participants.
Thursday was also a low volume session that opened lower, tested midway through Tuesday’s trading range, before testing slightly higher & closing above its open, but still as a declining session.
The indecision shown by the spinning top candle & low volume set up QQQ for Friday’s gap down session to complete the evening star pattern, as Friday opened just above the 10 day moving average’s support before breaking down through it & testing lower than Monday’s opening price for QQQ.
While it managed to close above Monday’s closing price, there was a big warning sign flashed last week, which will bring all attention to QQQ’s price & the relationship between it & the 10 & 50 day moving averages.
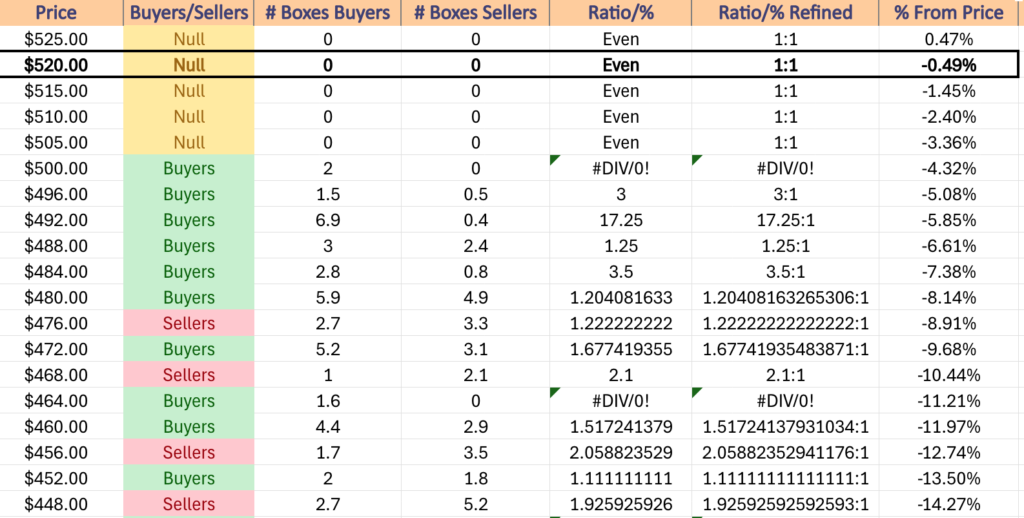
Should the support of the 50 DMA break down for QQQ, as per Friday’s closing price levels there was only a -7.11% spread between the two support levels, which should the top one break down may indicate trouble on the horizon.
This is especially true if the $493.69/share support level breaks down, as it lies in the $492-495.99/share price zone which is the strongest Buyer:Seller zone for QQQ, where Buyers have historically exceeded Sellers 17.25:1.
If this breaks down then there is a severe reversal in sentiment, as most price action around this area has tended to result in gaps up or down around the zone, with limited trading activity within it (most of which is clearly advancing).
QQQ has support at the $514.75 (Volume Sentiment: NULL, 0:0*), $508.89 (50 Day Moving Average, Volume Sentiment: NULL, 0:0*), $508.47 (Volume Sentiment: NULL, 0:0*) & $502.00/share (Volume Sentiment: Buyers, 2:0*) price levels & resistance at the $525.37 (10 Day Moving Average, Volume Sentiment: NULL, 0:0*), $531.24 (Volume Sentiment: NULL, 0:0*) & $538.28/share (All-Time High, Volume Sentiment: NULL, 0:0*) price levels.
IWM, the iShares Russell 2000 ETF climbed +0.21%, as the small cap index was still the least favored for a second consecutive week.
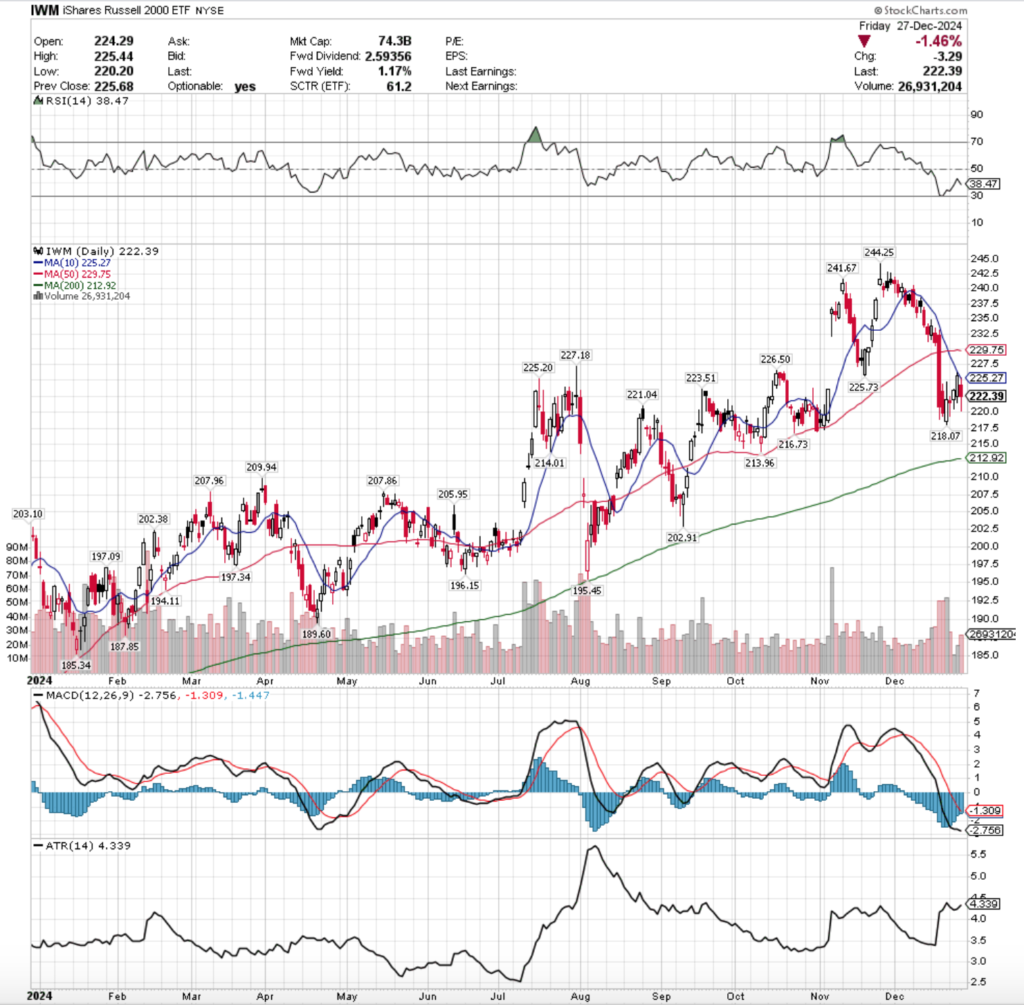
Their RSI is trending bearishly & currently sits at 38.47 & their MACD is still bearish, but the histogram is tapering off & it has begun to flatten out; next week will tell whether it continues lower or not.
Volumes were -28.63% lower than the previous year’s average level (22,515,000 vs. 31,547,937), as the hesitancy to buy stocks on the shortened holiday week also impacted the small cap index.
Monday opened slightly lower on the strongest volume of the week, but the upper & lower shadow signaled that there was a lot of appetite to both the upside & downside, but the real body being concentrated at the top of the candle indicates that there was short-term upside potential.
Tuesday opened on a gap up, tested to the downside, but managed to continue higher & closed for an advancing day, however this happened on the lowest volume of the year for IWM, signaling that there was not much strength & conviction behind the move.
Thursday confirmed that the weakness was setting in, as the session opened lower & tested lower, before rallying up to the 10 DMA’s resistance & closing just below it.
While the volume on Thursday was the second highest of the week, it was still not much to write home about & the uncertainty remained in the air.
Friday opened midway between Thursday’s range, made a run at the 10 DMA’s resistance, got rejected & the floodgates opened with IWM briefly dipping below Monday’s opening price, but recovering to still end the session lower on the day.
Small caps look to be in a bit of trouble, as Friday’s closing price would hit the 200 DMA if it declined -4.3%.
In the near-term IWM looks like an area to tread carefully around, given that their medium term trend is above the short-term trend (50 & 10 DMAs), which are both above their current price level.
While there are many support levels near their current price, they’ve also dipped below a resistance zone, which will require an uptick in volume to break through.
For the rest of the week it would be wise to watch to gain clues & insight into market participant sentiment towards IWM & the small cap names to see how things may kick off in the first month of the new year.
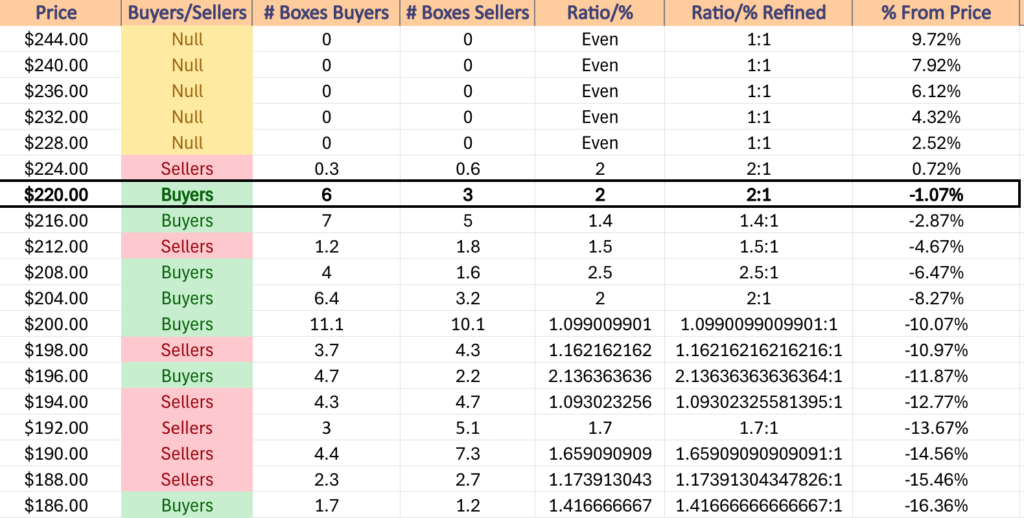
IWM has support at the $221.04 (Volume Sentiment: Buyers, 2:1), $218.07 (Volume Sentiment: Buyers, 1.4:1), $216.73 (Volume Sentiment: Buyers, 1.4:1) & $214.01/share (Volume Sentiment: Sellers, 1.5:1) price levels & resistance at the $223.51 (Volume Sentiment: Buyers, 2:1), $225.20 (Volume Sentiment: Sellers, 2:1), $225.27 (10 Day Moving Average, Volume Sentiment: Sellers, 2:1) & $225.73/share (Volume Sentiment: Sellers, 2:1) price levels.
DIA, the Dow Jones Industrial Average ETF notched +0.34% last week, as even the bluechip index received a “wait & see” approach from market participants.
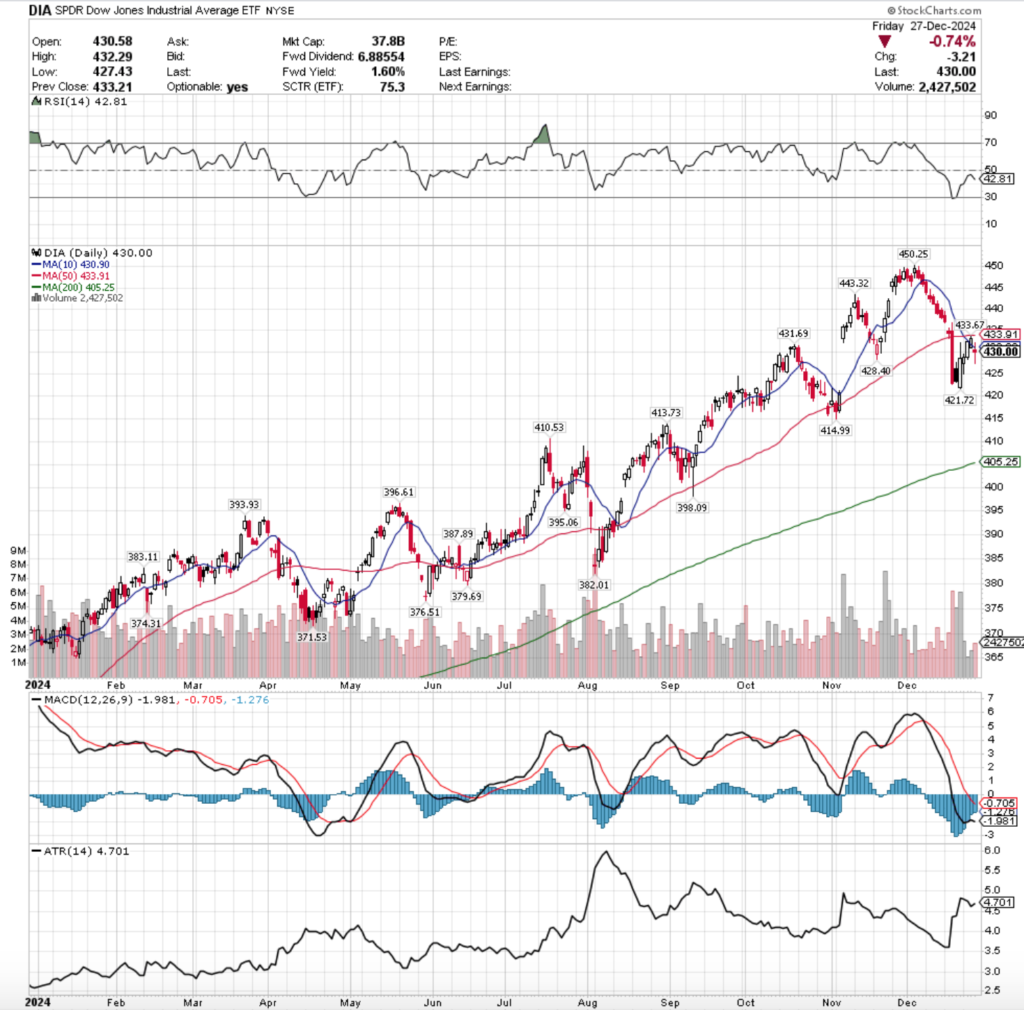
Their RSI is trending bearishly further, sitting currently at 42.81, while their MACD remains bearish, but has flattened out over the past week <FINISH THIS LATER>
Volumes were -38.92% lower than the prior year’s average level (2,082,500 vs. 3,409,683), as there was a very low participation rate during the holiday week.
Monday the week kicked off on a bullish note, advancing for the day on the week’s highest volume.
Tuesday also saw gains for DIA, but on very low volume that was unable to break above the 10 DMA & the session closed in-line with it.
Thursday opened lower, before powering through the 10 DMA to test & get rejected by the 50 DMA’s resistance, but prices managed to close just beneath it.
Friday showed a rush to the exits & profits were taken after the gains of the short week, as the session opened on a gap down, tested higher to briefly break above the resistance of the 10 DMA, but ultimately closed lower on the day as a high wave spinning top candle.
Friday featured the second highest volume of the week as well, indicating that there was a great deal of bearish sentiment out there for DIA.
Heading into this week keep an eye out for any volume shifts, as that will provide clues into whether or not there will be pains or gains heading into the new year.
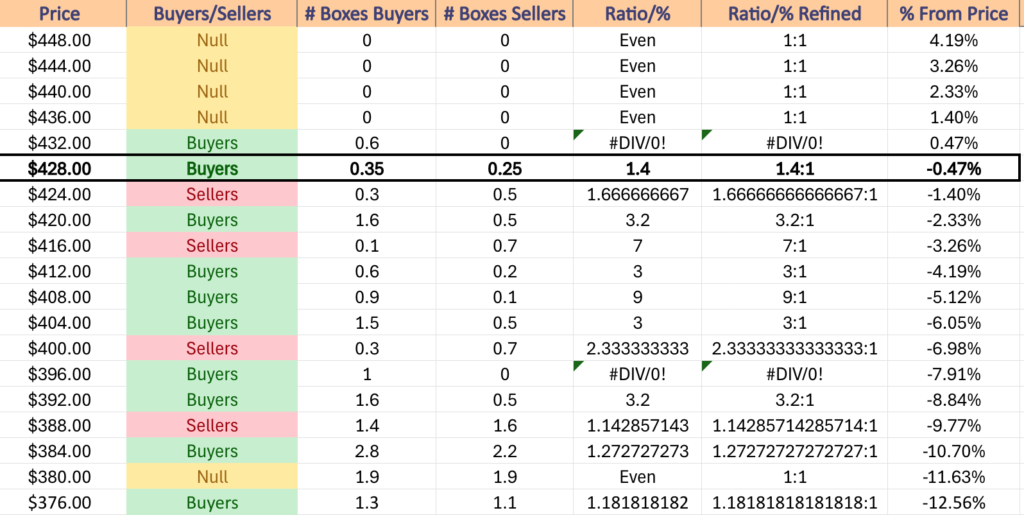
The chart below outlines DIA’s support & resistance levels with their volume sentiments over the past 3-4 years.
DIA has support at the $428.40 (Volume Sentiment: Buyers, 1.4:1), $421.72 (Volume Sentiment: Buyers, 3.2:1), $414.99 (Volume Sentiment: Buyers, 3:1) & $413.73/share (Volume Sentiment: Buyers, 3:1) price levels & resistance at the $430.90 (10 Day Moving Average, Volume Sentiment: Buyers, 1.4:1), $431.69 (Volume Sentiment: Buyers, 1.4:1), $433.67 (Volume Sentiment: Buyers, 0.6:0*) & $433.91/share (50 Day Moving Average, Volume Sentiment: Buyers, 0.6:0*) price levels.
The Week Ahead
The week kicks off Monday with Chicago Business Barometer (PMI) data at 9:45 am, followed by Pending Home Sales data at 10 am & there are no major earnings announcements scheduled.
Tuesday the year winds down with S&P Case-Shiller Home Price Index (20 Cities) data at 9 am & there are no earnings reports scheduled for release.
Wednesday is New Year’s Day & there is no economic data or earning’s announcements.
Thursday the year kicks off with Initial Jobless Claims Data at 8:30 am, followed by Construction Spending data at 10 am & Resources Connection reports earnings to kick the new year off after the session’s close.
Friday the week winds down with ISM Manufacturing data at 10 am & there are no earnings reports scheduled for the day.
See you back here next week!
*** I DO NOT OWN SHARES OR OPTIONS CONTRACT POSITIONS IN SPY, QQQ, IWM OR DIA AT THE TIME OF PUBLISHING THIS ARTICLE ***