Volatility began creeping back into financial markets this past week, just in time for some holiday discounts.
What is particularly interesting about it this time around though is that the levels of volume are far above average for the year, and above where they were in other, more recent volatile periods.
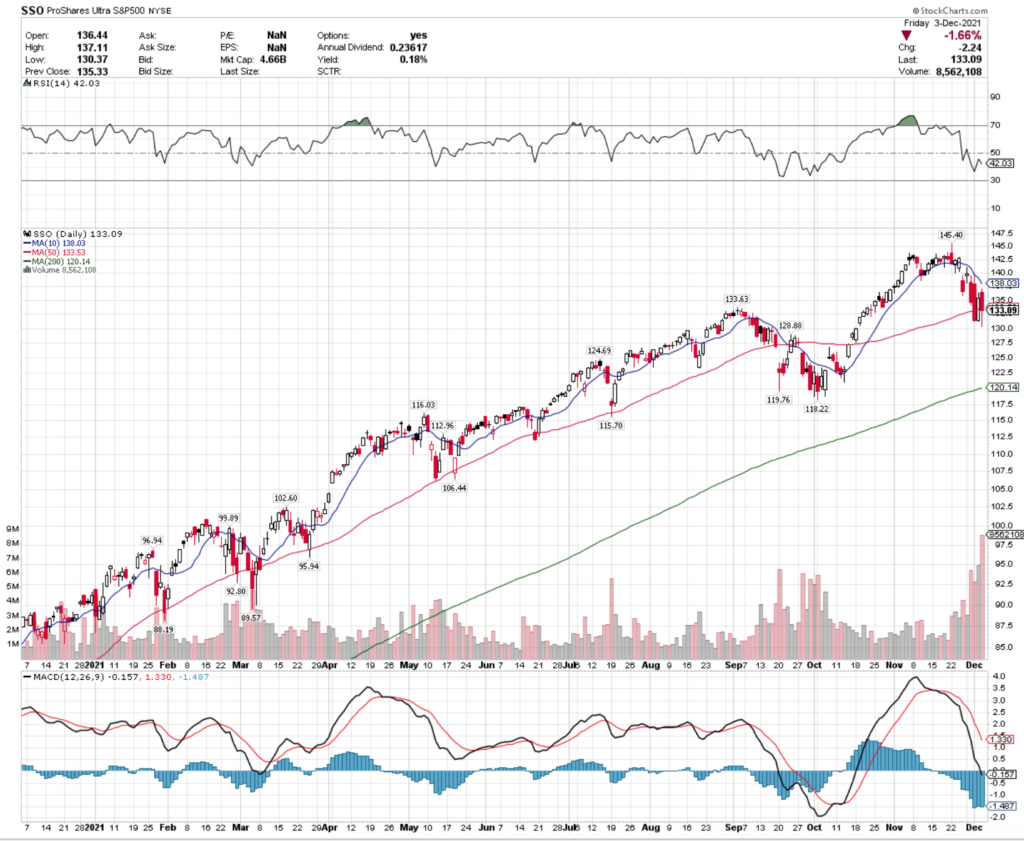
SSO, the ProShares Ultra S&P 500 ETF’s price settled below its 50 Day Moving Average, with an RSI of 42.
This shows there is still more pain to come in the near-term for the S&P 500, as concerns over omicrom, as well as the potential lockdown measures that will take to combat it hang over investors’ heads.
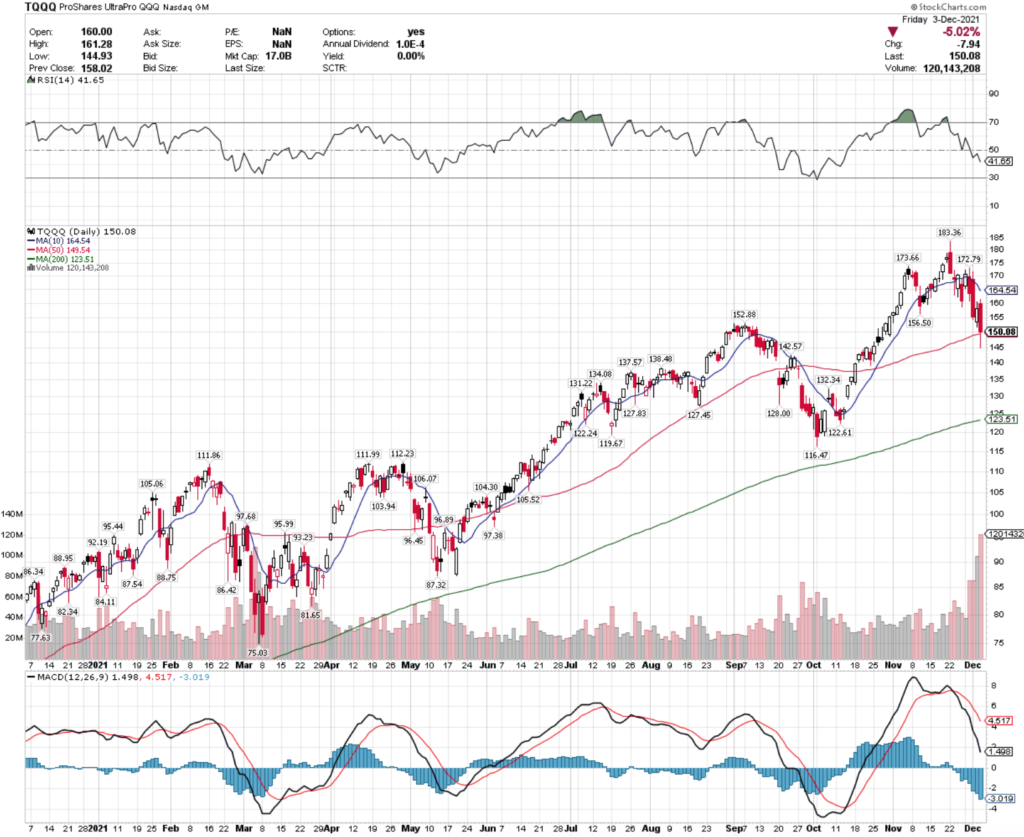
With much discussion about the rate of tapering & rate hikes via the Federal Reserve, the NASDAQ tech-heavy index also saw above average volume in their declines.
While their RSI also signals that there is more near-term losses to come, they closed just above their 50 Day Moving Average.
Still, traders should be on the lookout for the death cross that each index is inching closer & closer towards each passing day.
20+ Year Treasuries (TMF), Semiconductors (SOXL), Industrial Real Estate (INDS) & Technology (TECL) ETFs All Have Had Bullish Runs
TMF, an ETF that tracks 20+ Year Treasuries has enjoyed strong gains recently.
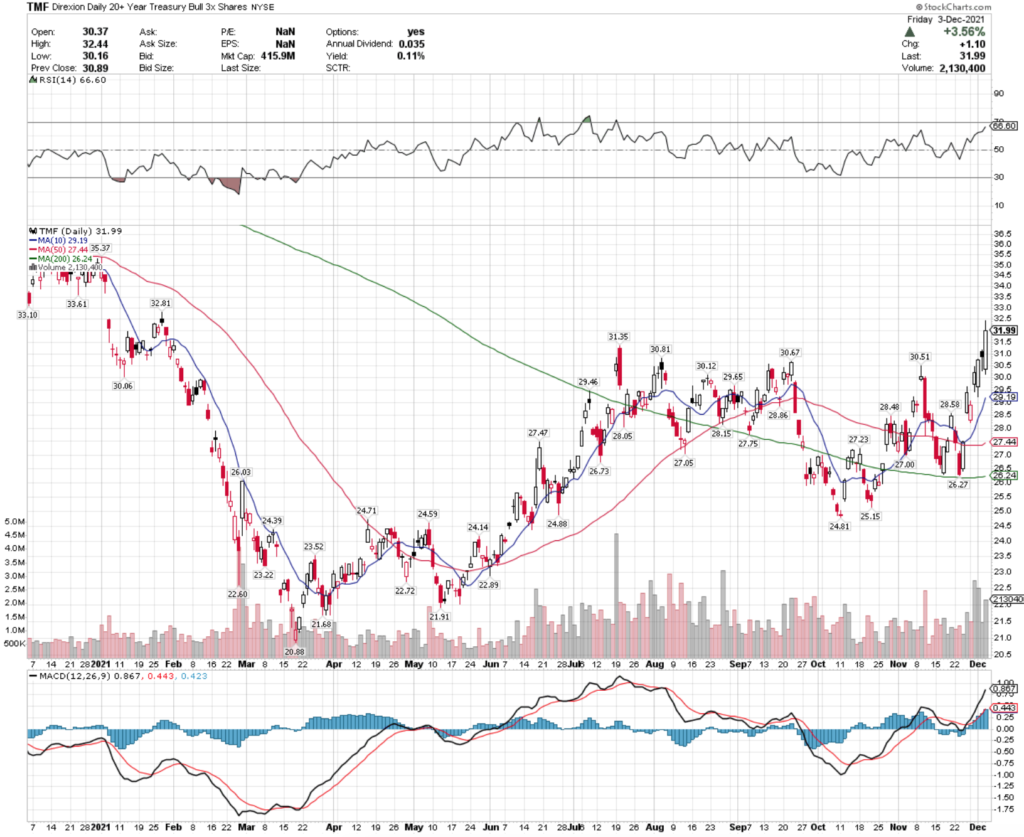
Their moving averages have begun signaling more bullishness is to come, although there may be some decent entry points in the near-term as their RSI will need to cool off while they establish a new price range.
Semiconductors have somewhat stalled out at their top range, as seen with SOXL ETF.
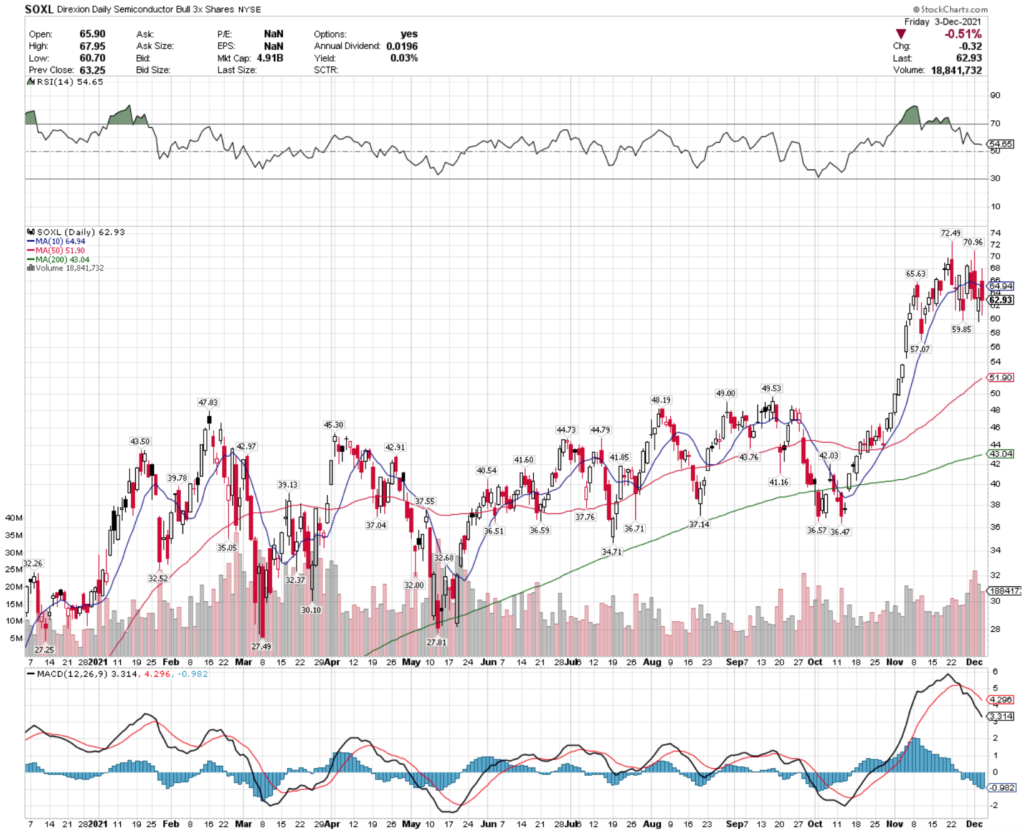
SOXL’s volume has remained about average, but with a now neutral RSI & continuing issues with supply, there may be more positive pressure on these names.
INDS ETF, which tracks industrial real estate has also been on a steady incline all year.
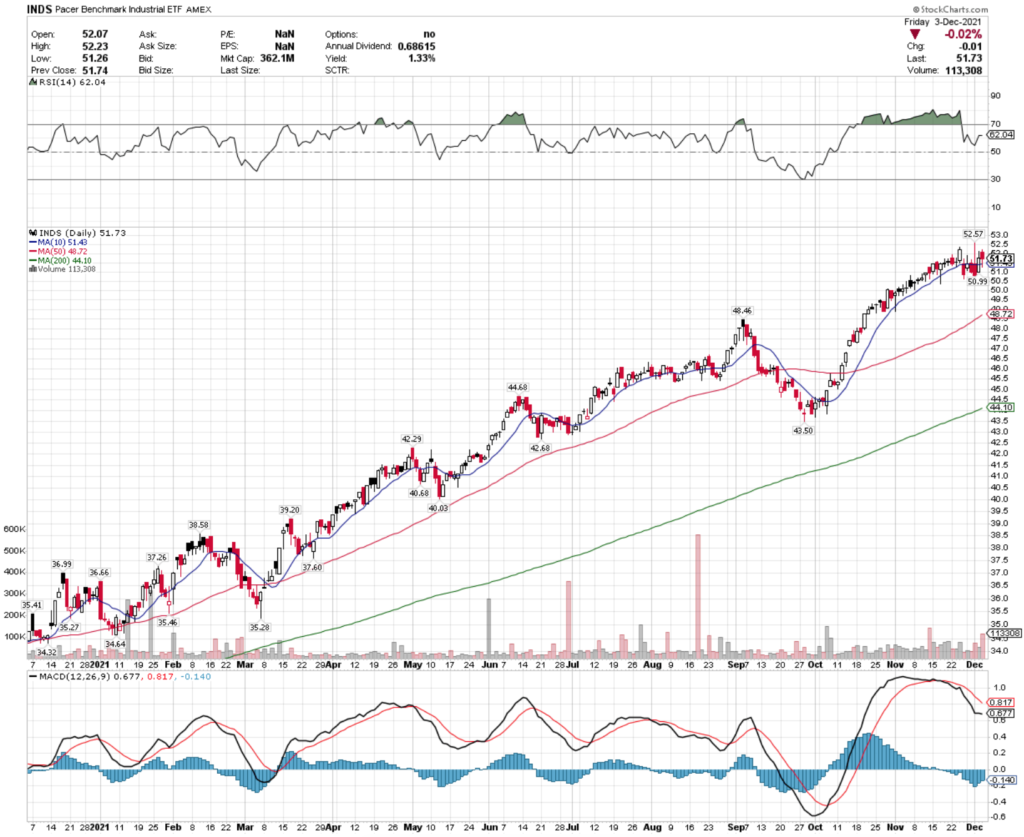
INDS’s recent volumes have also been above average for the year, as their RSI cools down from overbought conditions this last week.
Watch their MACD, which looks to be signaling more growth in the coming days as it begins to flatten/curve upwards.
TECL, the Direxion Daily Technology Bull 3X Shares ETF is cooling down with all of the talks of rate hikes & tapering, which may provide a decent entry point in the near-term.
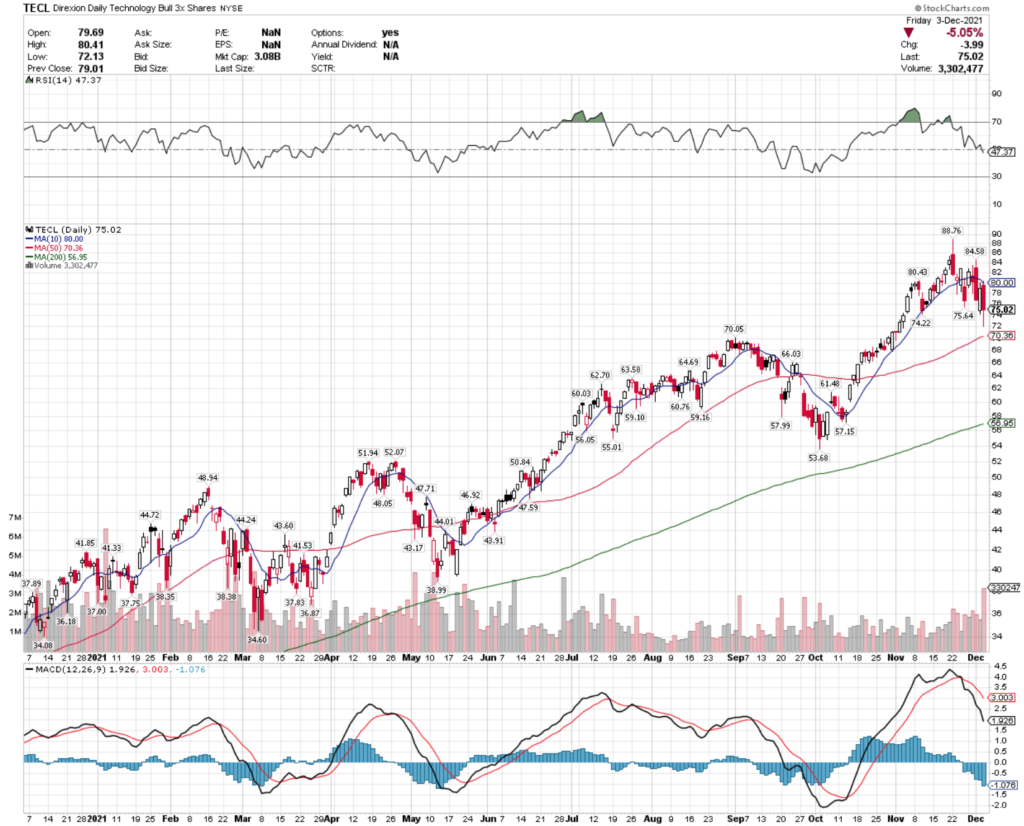
Their RSI is now dipping into the oversold side, although they may have a bit more room to fall based on their MACD & elevated volume levels compared to the year’s averages.
Genomics (ARKG), Aerospace & Defense (DFEN), Betting & iGaming (BETZ) & Streaming Services (SUBZ) Are All Bearish & Lagging The Pack
ARKG, an ETF that seeks exposure to securities that are involved in genomics has been horribly lagging the market recently.
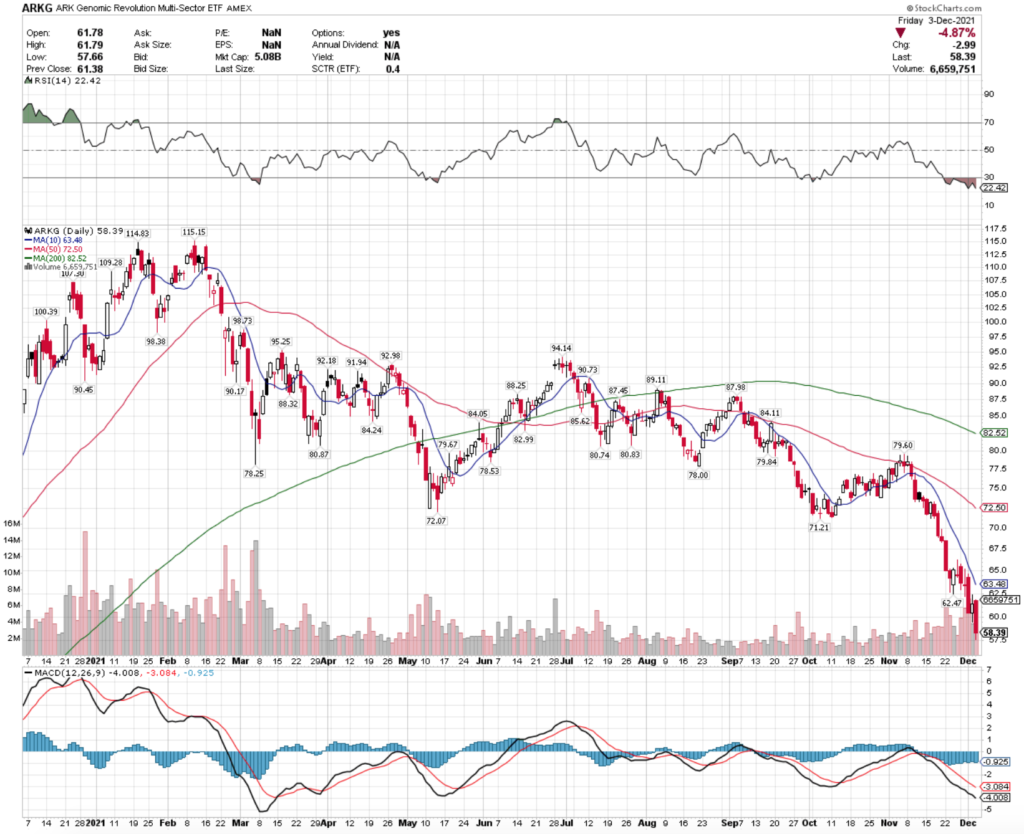
Their RSI is severely oversold, which may signal a coming rebound in the near-to-mid term.
However, like everything else, their volumes have recently been above average, signaling there will likely be more pain to come before the rebound.
DFEN ETF, which tracks aerospace & defense securities has also been underperforming.
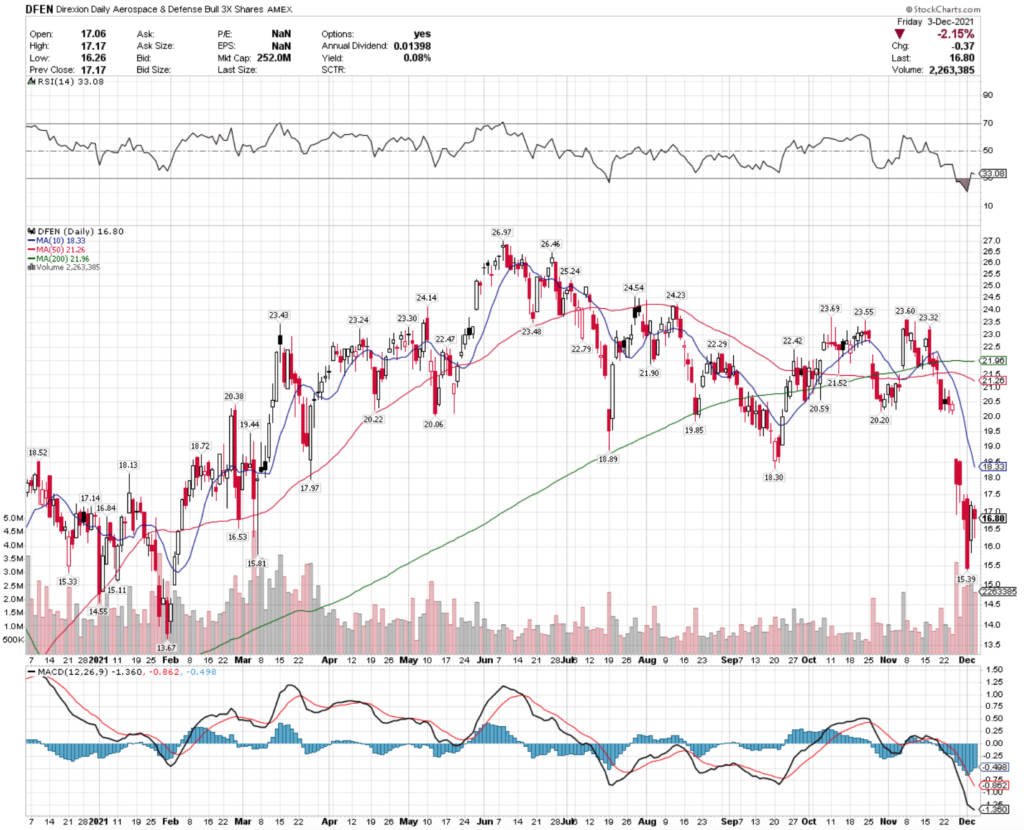
They too have an oversold RSI & higher than average volume.
However, their MACD looks to be turning, which may prove to be a reversal from their recent decline in price after multiple gap down days in the last couple of weeks.
BETZ, the Roundhill Sports Betting & iGaming ETF is another one with a heavily oversold RSI.
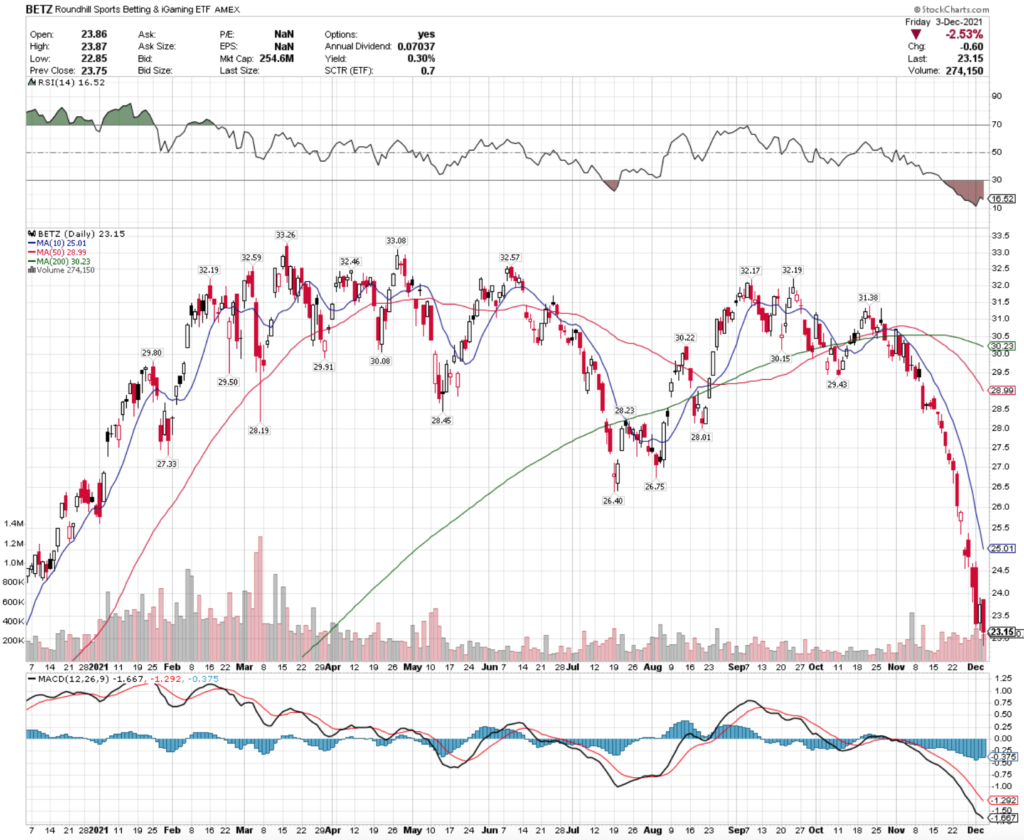
What’s remarkable here is that nearly every day since the end of October their share price has continued to fall.
With an RSI of 16, they should at least be able to begin establishing a new range here, unless broader market volatility sends them deeper into descent.
SUBZ, the Roundhill Streaming Services & Technology ETF has also been facing difficulty since launching last February.
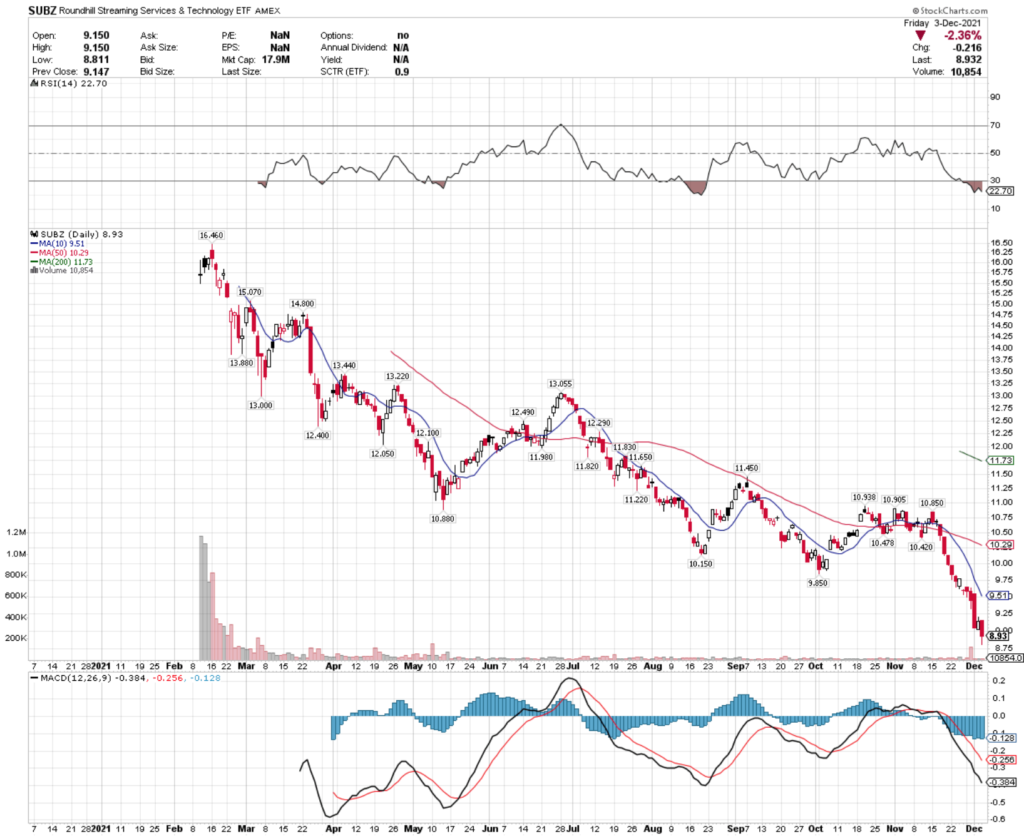
This is another name that has seen nearly all downward momentum over the last month, with an extremely oversold RSI.
They haven’t had much in terms of severe trading volume since they were first introduced to the market, which shows many investors are likely still weary of them & their holdings.
Tying It All Together
Next week looks to be interesting, as we await news about the omicron variant of COVID, as well as learn if there are more clues coming from the Federal Reserve about the expected taper pace.
Pending Home Sales, PMI Data & Unemployment Data will also be closely watched, after this week’s unemployment numbers left many folks scratching their heads.
Based on the technicals that we reviewed above, it looks like there will be a bit more volatility as we move closer to the end of 2021.