SPY, the SPDR S&P 500 ETF fell -1.01% last week, while the VIX closed at 16.43, indicating an implied one day move of +/-1.04% & an implied one month move of +/-4.75%.
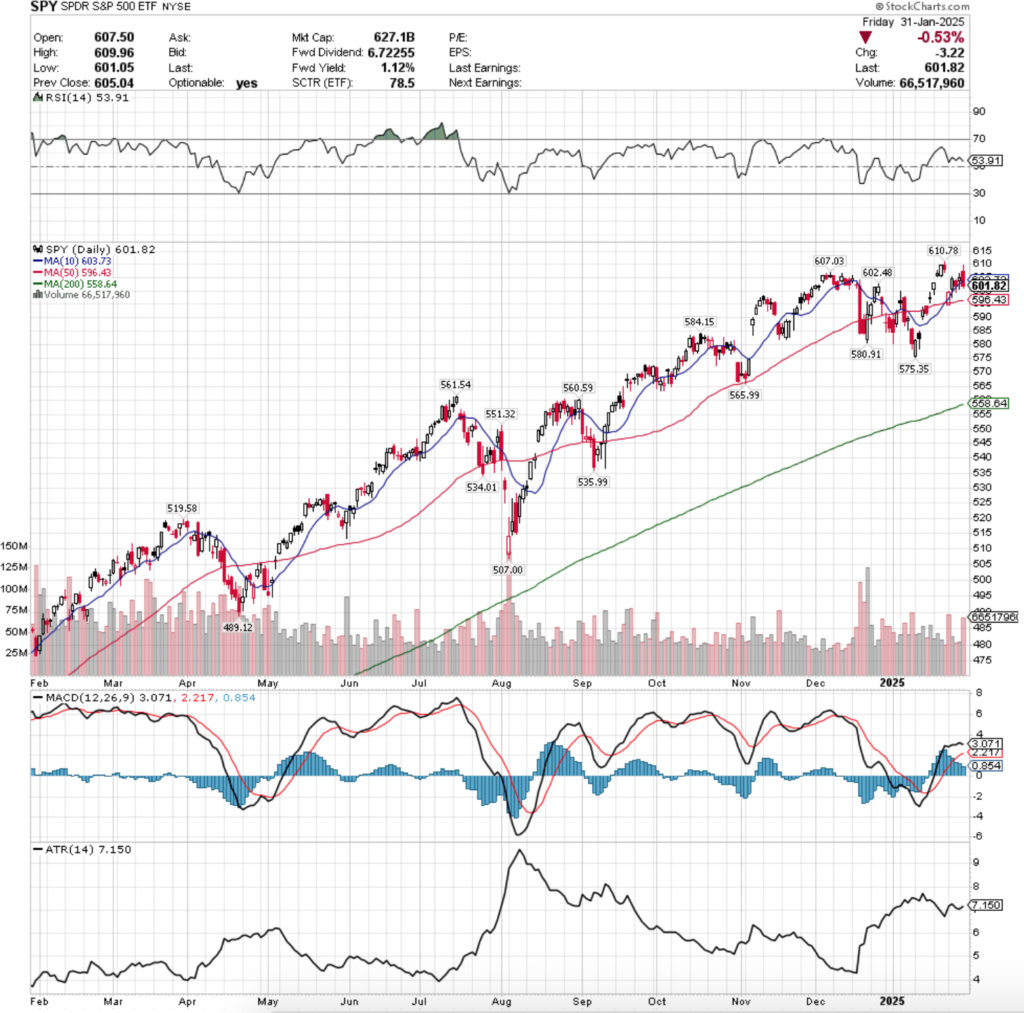
Their RSI is trending down towards the neutral level & sits currently at 53.91, while their MACD has curled over bearishly & looks set for a bearish crossover by the end of Tuesday’s session.
Volumes were -5.93% lower than the previous year’s average level (51,584,000 vs. 54,836,494), which is weak participation, but validates that there is indeed some risk aversion settling into stock prices in the near-term.
Monday, the week kicked off on a gap down that opened just below the resistance of the 50 day moving average, but throughout the day market participants rushed back in & managed to push SPY above both the 50 & 10 day moving averages.
Seller volume was the second highest it’s been so far in 2025, indicating that there was a severe urgency to sell SPY & its component stocks, but that there was also quite a few folks hopping back into the pool as well, given that the day ended higher than it opened.
Tuesday showed a glimmer of strength, where on the third highest volume of the week SPY managed to grind higher, but not without testing back below the 10 DMA’s support briefly.
Wednesday flashed the warning signals again, when on the week’s lightest volume SPY opened lower, tested again below the 10 DMA, only to settle in line with it’s support & form a bearish harami pattern with Tuesday’s candle.
Thursday managed to open higher, but again tested below the 10 DMA’s support before powering higher to close as an up day on light volume, indicating that there was not much strength of sentiment behind the move.
The spinning top candle also added a greater sense of uncertainty to SPY’s near-term performance, but the 10 day moving average continued to be straddled & a key area to watch.
Friday saw the brakes get slammed, as SPY opened higher, tested the $610/share limit, before being sent down & breaking through the support of the 10 DMA to close below it on a -0.53% session.
Friday’s volume was the second highest of the week, and third highest of the year, indicating that there was unease among market participants.
It should also be noted that Friday’s candle formed a bearish engulfing pattern with Thursday’s, another bit of negative near-term sentiment.
The coming week holds a plethora of earnings calls, with some of the most notable coming from Amazon, Alphabet & Disney.
Prices look ready to consolidate between the 10 & 50 DMAs until given a direction to break out in, which will likely come from the earnings reports of the week, else from any of the number of Fed speakers that are scheduled for the coming days.
As noted in prior weeks’ notes, any move to the upside will require a great deal of advancing volume to have sticking power, particularly as SPY is so close to all-time highs.
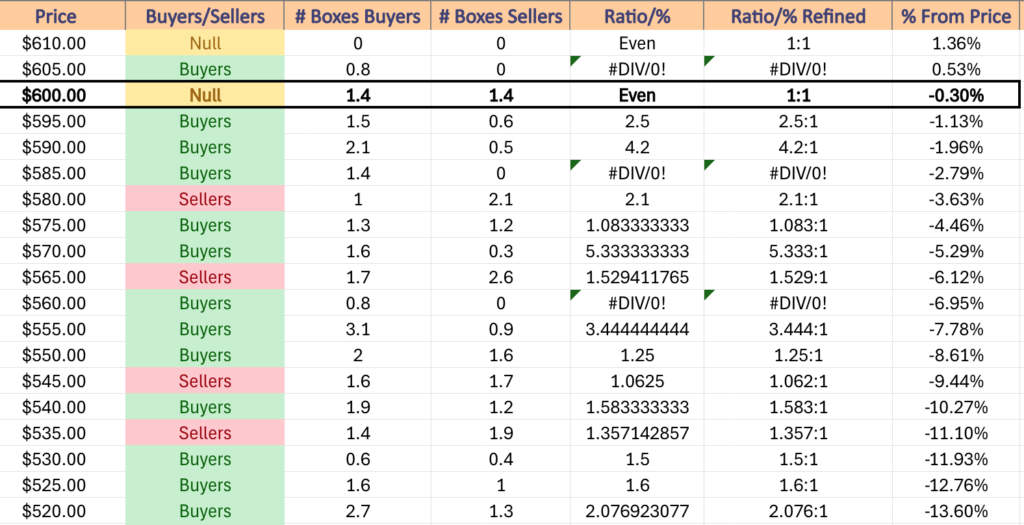
To the downside, if the 50 day moving average’s support doesn’t hold up, SPY may have some trouble as there are no support levels until $584.15/share.
The reason that this is troublesome is that while the price zones between there & Friday’s close are historically dominated by Buyers, the $580-584.99/share price zone is Seller dominated over the past 2-3 years, at a rate of 2.1:1.
If we see that break down there is not much strength of historic buyers until the $580-584.99/share price level, which contains two support levels.
Volume will be a key factor to watch in any market movement, as at these price levels it will be important to have confirmation by active market participation, as even in the event of a consolidation range continuing all week it will give clues into which way market participants are leaning, be it more risk-on or risk-off.
The chart below gives insight into volume sentiment at the price levels SPY has traded at over the past 2-3 years.
SPY has support at the $596.43 (50 Day Moving Average, Volume Sentiment: Buyers, 2.5:1), $584.15 (Volume Sentiment: Sellers, 2.1:1), $580.91 (Volume Sentiment: Sellers, 2.1:1) & $575.35/share (Volume Sentiment: Buyers, 1.08:1) price levels, with resistance at the $602.48 (Volume Sentiment: Even, 1:1), $603.73 (50 Day Moving Average, Volume Sentiment: Even, 1:1), $607.03 (Volume Sentiment: Buyers, 0.8:0*) & $610.78/share (All-Time High, Volume Sentiment: NULL, 0:0*) price levels.
QQQ, the Invesco QQQ Trust ETF declined -1.39% last week, as investors were most weary of the tech-heavy index out of the four major ETFs.
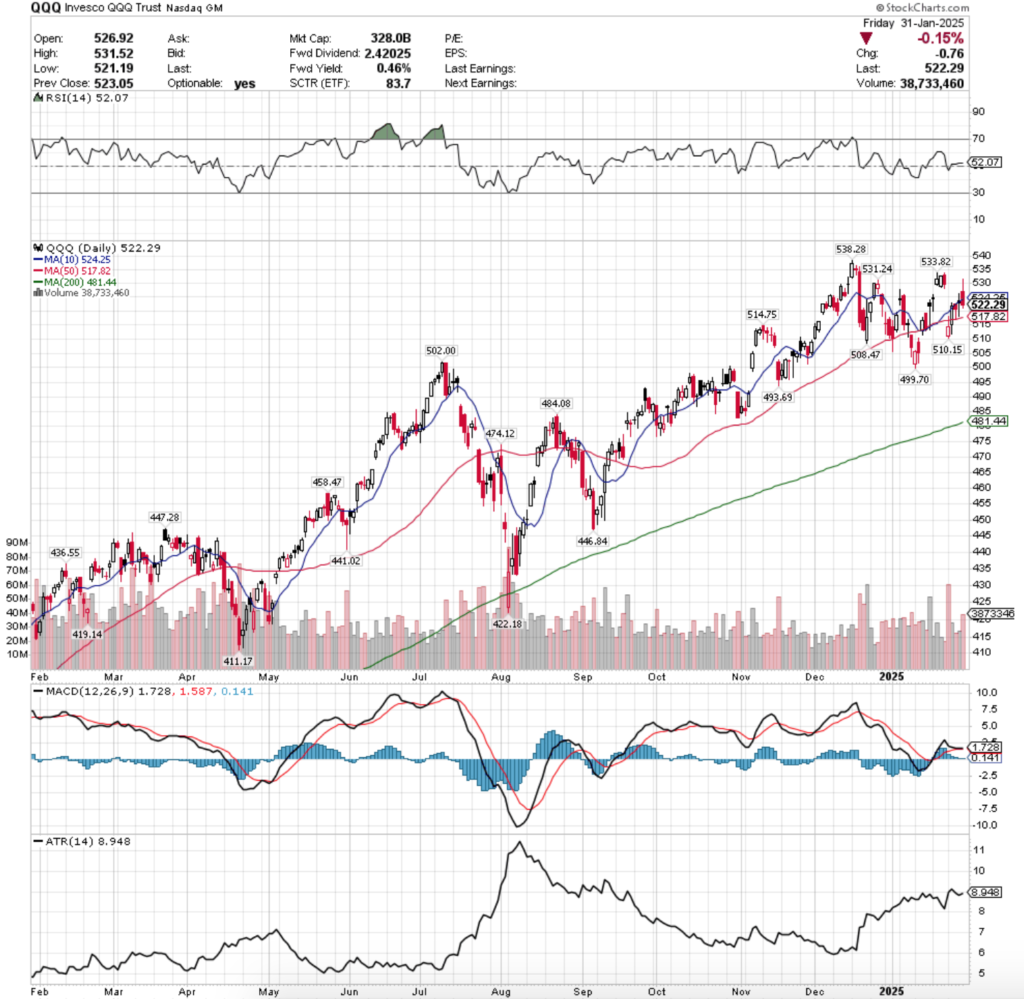
Their RSI has flattened out just above the neutral 50 mark at 52.07, while their MACD is still bullish but has also flattened out & their histogram indicates that there will be a bearish crossover by Tuesday.
Volumes were +3.59% higher than the previous year’s average (37,378,000 vs. 36,082,271), which is a slight cause for concern given that the week ultimately resulted in declines & the top two highest volume sessions were declining.
Much like SPY, QQQ opened the week on a gap down on the highest volume of the week, setting the stage for near-term weakness to set in.
QQQ however, opened below the 10 & 50 day moving averages, temporarily broke above them, before closing below both, but higher than the day opened, indicating that market participants were willing to accept some risk as the session went on.
Tuesday opened higher, retraced down almost to Monday’s opening level, before tearing above the 50 day moving average’s resistance & the 10 DMA’s resistance & managed to settle for the day atop both, with a small upper shadow indicating that there was a slight bit of more upside appetite.
On Wednesday reality set in to remind QQQ investors that it’s not out of the woods just yet, as the session opened slightly higher, before tumbling below the 10 day moving average’s support, going so far down as to test the 50 day moving average, before regaining some of its losses to close below the 10 DMA.
Volume on Wednesday was the lightest of the week, which is a bit alarming when you consider the wide range of prices that were touched intraday, as well as the fact that there were multiple tests & retests of the 10 & 50 DMAs.
Thursday the risk off sentiment continued, as despite gapping higher on the open, the day resulted in a spinning top candle that closed lower than its open, indicating that there was a bit on uneasiness in the market for QQQ, which when coupled with the week’s second lowest volume becomes even more apparent.
Friday, much like SPY, QQQ formed a bearish engulfing pattern after opening on a gap up, temporarily testing higher, before dropping to below the support of the 10 day moving average & closing below it.
Volume was second highest for the week on Friday, which when paired with Monday’s highest volume of the week session paints a bit of a bleak picture for QQQ in the near-term.
Much like SPY, this week expect to see QQQ oscillate between the support of the 50 day moving average & the resistance of the 10 day moving average until a catalyst pushes it to break out either up or down.
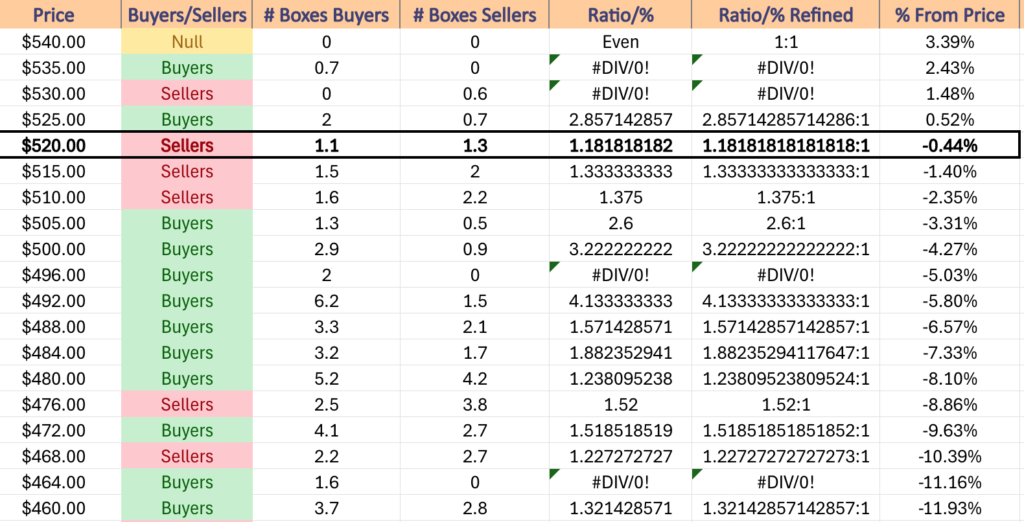
For any staying power to an upside move there will need to be volume as strong as this past week, if not stronger, especially given that their price is currently in a Seller dominated zone historically.
This will require a bit of an extra push to continue prices moving higher from, as the next resistance levels after the 10 DMA are all in Seller dominated zone as well, so there will need to be a great deal of added enthusiasm for QQQ to continue higher.
To the downside, there’s Seller pressure for the next -2.35% before the Buyers have historically stepped in.
However, if the $508.47/share level breaks down there will be additional losses given that the next support level doesn’t occur until $499.70.
QQQ has support at the $517.82 (50 Day Moving Average, Volume Sentiment: Sellers, 1.33:1), $514.75 (Volume Sentiment: Sellers, 1.38:1), $510.15 (Volume Sentiment: Sellers, 1.38:1) & $508.47/share (Volume Sentiment: Buyers, 2.6:1) price levels, with resistance at the $524.25 (10 Day Moving Average, Volume Sentiment: Sellers, 1.18:1), $531.24 (Volume Sentiment: Sellers, 0.6:0*), $533.82 (Volume Sentiment: Sellers, 0.6:0*) & $538.28/share (All-Time High, Volume Sentiment: Buyers, 0.7:0*) price levels.
IWM, the iShares Russell 2000 ETF dropped -0.97% last week, as even small cap names were shunned by market participants.
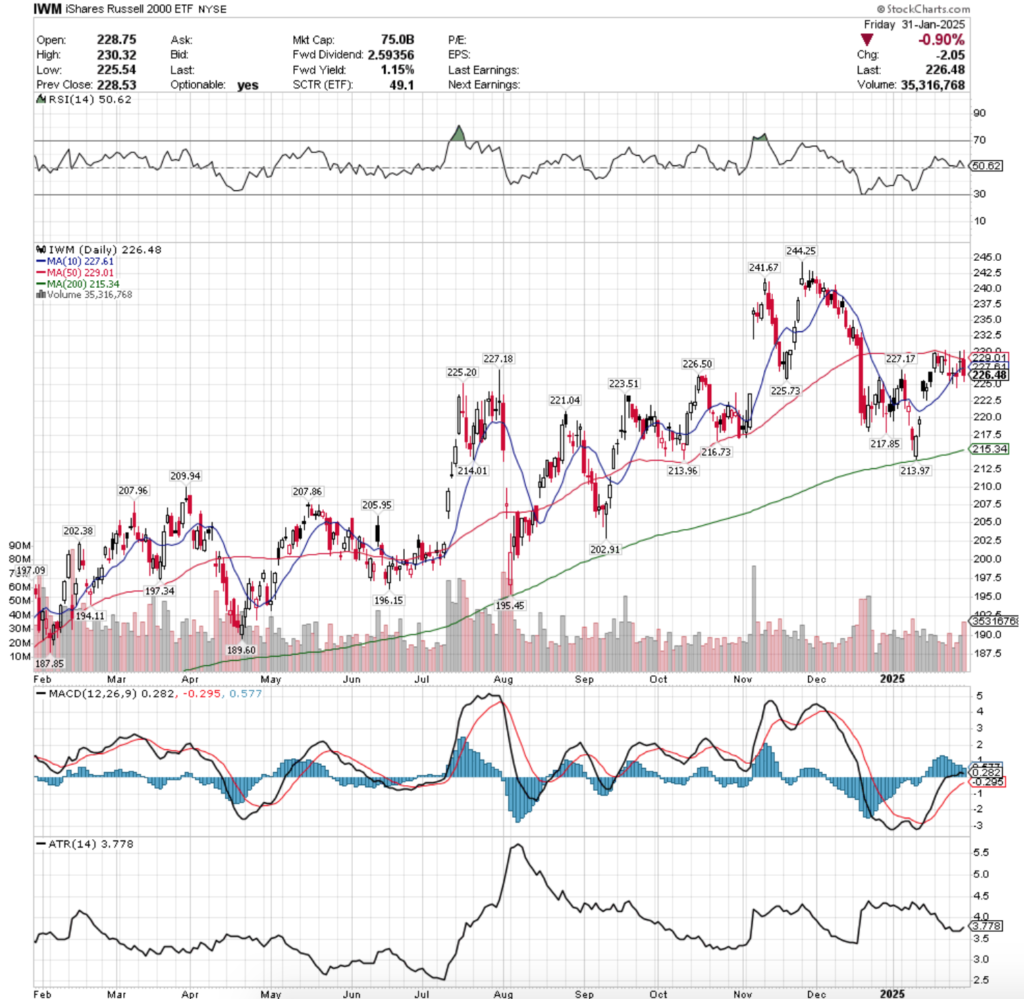
Their RSI is about to cross down through the neutral 50 level & currently is at 50.62, while their MACD has curled over bearishly & should cross through the signal line by mid-week.
Volumes were -16.66% lower than the prior year’s average (25,104,000 vs. 30,121,000), as there was muted participation among investors for IWM.
Monday began on a cautious note, as the day tested the 10 day moving average’s support, as well as the 50 day moving average’s resistance, but ultimately settled as a spinning top candle on the second highest volume of the week after opening on a gap down.
Tuesday opened higher, tested higher, then temporarily went below the support of the 10 day moving average, in a session that closed as a doji on the week’s lowest level of volume.
This signaled that there was bearish sentiment on the horizon, but prices managed to close above the 10 DMA.
Wednesday this theme of weakness carried on, as on lackluster volume the day resulted in a high wave spinning top candle that opened in line with the 10 DMA, but closed below it, indicating that there was a lot of confusion and speculation about where to value IWM, but at the end of the day the result was resoundingly lower.
Thursday opened on a gap higher, but uneasiness was abound as the high wave candle broke above the 50 DMA’s resistance & below the 20 DMA’s support, only to close in-line with its opening price.
Friday opened on a gap higher & went above the 50 DMA again & also briefly crossed $230/share again, but ultimately was unable to find any footing & on the week’s strongest volume IWM declined through the 10 DMA’s support to close below it.
For this coming week expect to see IWM continue to straddle the 10 day moving average until there is a catalyst that pushes it higher or lower.
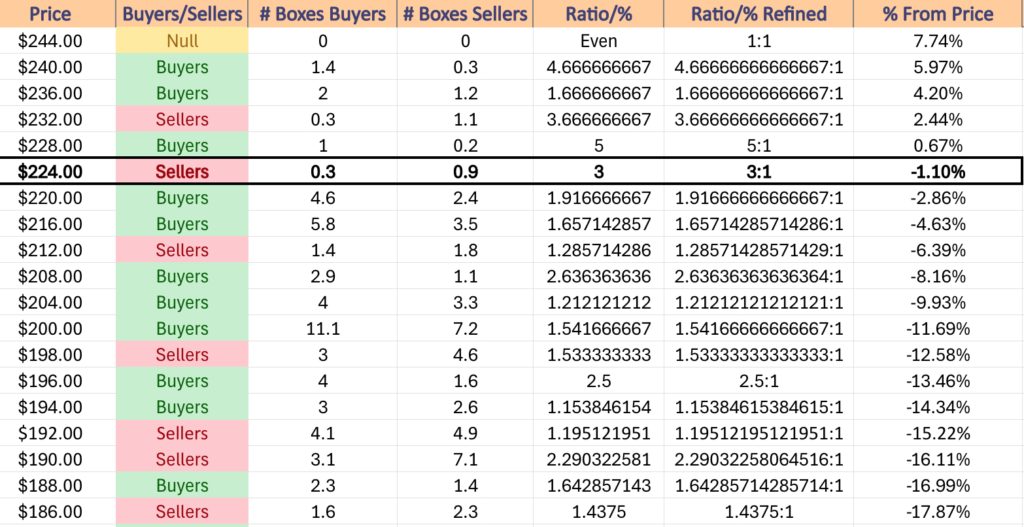
Much like SPY & QQQ, any upside movement will require a large increase in volume, as IWM is currently in a Seller dominated zone & will enter another in the event that they advance +2.44%.
A unique trouble for IWM though is that in this current price zone sit the next four resistance levels & the $227.17-18 mark will require a large push to break through & stay above.
To the downside there is some Buyer pressure once the $23.99 share price is hit, but if IWM loses -4.63% from Friday’s close it will find itself in another Seller zone & the strength of the Buyers on the two zones in between will become more diluted (unless they are completely gapped over, which will present a unique set of challenges).
Also, the current price is 5.2% above the long-term trend (200 DMA) & that will become something to begin thinking about in the next two weeks, especially if there is no catalyst higher, as the 200 DMA is currently in a Seller dominated zone 1.29:1, which increases the risk of the long-term trend breaking down for IWM.
IWM has support at the $225.73 (Volume Sentiment: Sellers, 3:1), $225.20 (Volume Sentiment: Sellers, 3:1), $223.51 (Volume Sentiment: Buyers, 1.92:1) & $221.04/share (Volume Sentiment: Buyers, 1.92:1) price levels, with resistance at the $226.50 (Volume Sentiment: Sellers, 3:1), $227.17 (Volume Sentiment: Sellers, 3:1), $227.18 (Volume Sentiment: Sellers, 3:1) & $227.61/share (10 Day Moving Average, Volume Sentiment: Sellers, 3:1) price levels.
DIA, the SPDR Dow Jones Industrial Average ETF advanced +0.29% last week, as the blue chip index was the only major index that market participants viewed favorably.
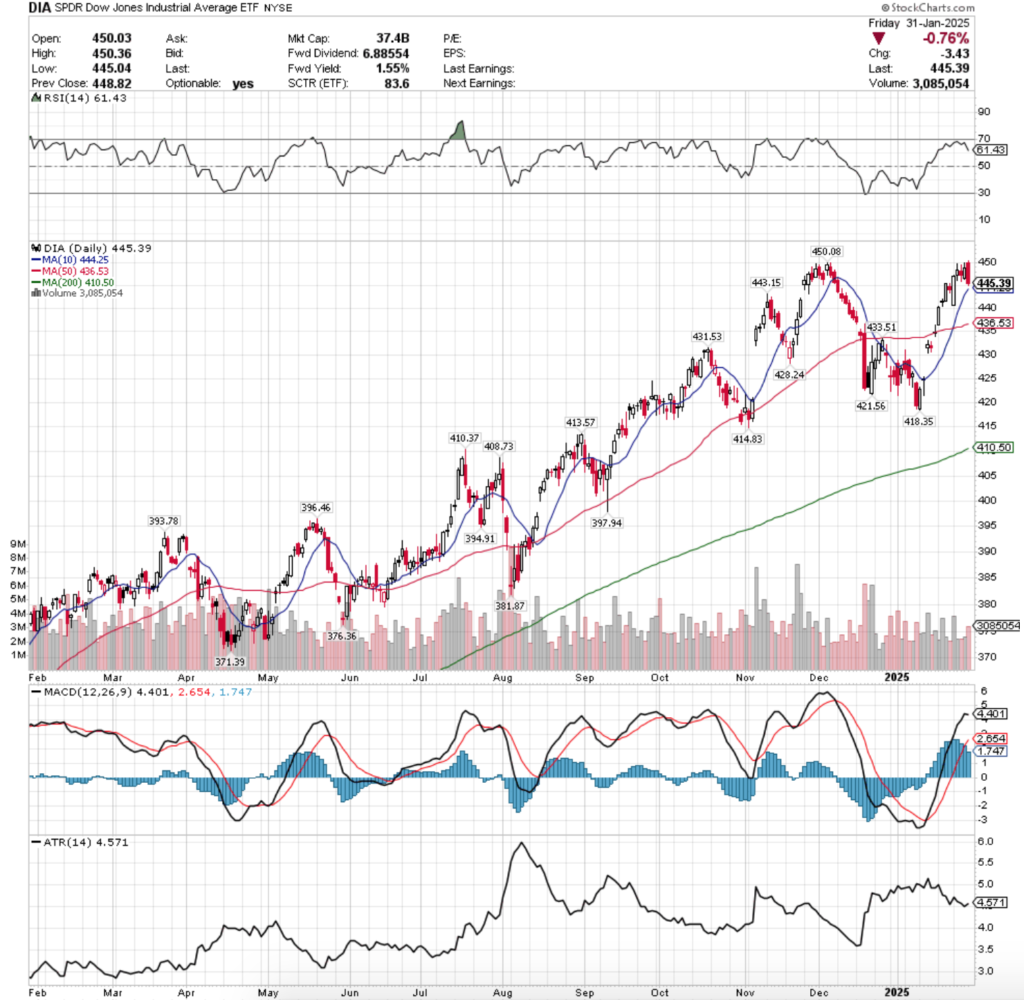
Their RSI is trending back towards neutral after flirting with the overbought 70 level & sits currently at 61.43, while their MACD has curled over bearishly & their histogram has begun to wane, indicating that there is likely going to be a bearish crossover by mid-week.
Volumes were -16.99% lower than the prior year’s average level (2,738,000 vs. 3,298,566), which makes the small weekly gain rather insignificant.
Most of DIA’s gains for the week can be attributed to Monday’s performance, which resulted in a bullish engulfing candle that set up the rest of the week for a bit of floundering & consolidation.
Monday had the highest volume of the week, which also speaks to the true strength of the move, as there was not much eagerness for market participants to ride the wave higher during the rest of the week.
Tuesday opened on a gap higher, but the enthusiasm waned quickly as the week’s lightest volume session pushed higher, but was rejected at the $450/share price level & closed at $448.41.
Wednesday the cracks began to show in DIA, as while the day’s candle did not result in a bearish engulfing pattern, it was close to one & ultimately the day ended as a declining spinning top on low volume, showing a severe level of confusion lack of interest among market participants.
Thursday resulted in a bullish engulfing candle, but again the volume came in very underwhelming & yet again the $450/share price level held up, making a run at the all-time high seem less & less likely.
Friday wiped any potential enthusiasm away though, with a gap up open that led to a -0.76% declining session on the week’s second highest volume, as the all-time high held up & the day’s candle created a bearish engulfing pattern.
This week all eyes will be on whether or not the all-time high holds up or if the $450/share gets rejected once & for all & a double top forms.
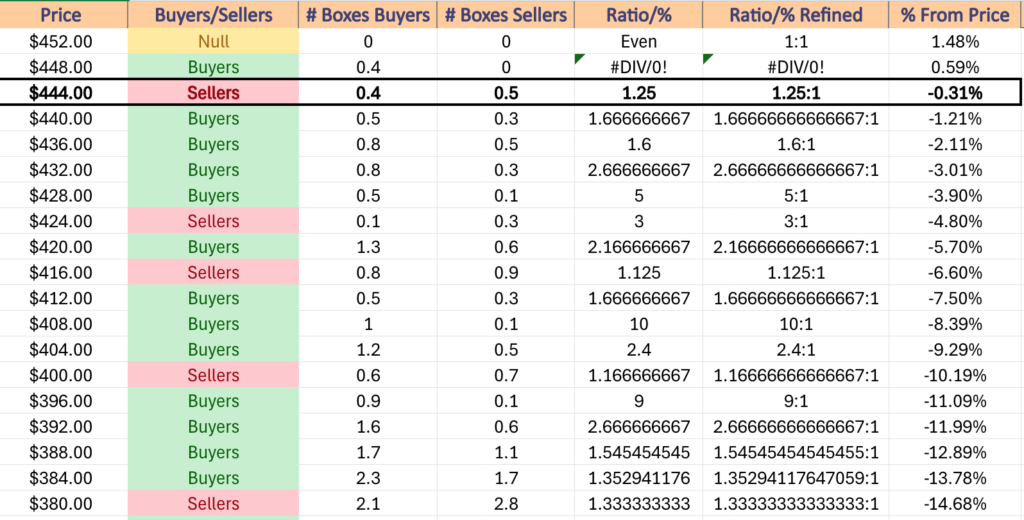
Should this occur, keep in mind that DIA’s current price & first level of support (the 10 DMA) are both in a Seller dominated zone.
While Buyers have historically stepped in for the next -3.9% from Friday’s closing price, if the 50 day moving average breaks down the $428.24/share price level will become the next-most important place to watch, as it leads into another historically Seller dominated zone (3:1).
Without a major surge in volume & should there be no major splashes due to earnings, expect prices to consolidate between the 10 & 50 day moving averages until there is a reason for a breakout.
Once there is a breakout, ensure that there is proper volume supporting the move, given that DIA is just off of all-time highs.
DIA has support at the $444.25 (10 Day Moving Average, Volume Sentiment: Sellers, 1.25:1), $443.15 (Volume Sentiment: Buyers, 1.67:1), $436.53 (50 Day Moving Average, Volume Sentiment: Buyers, 1.6:1) & $433.51/share (Volume Sentiment: Buyers, 2.67:1) price levels, with resistance at the $450.08/share (All-Time High, Volume Sentiment: Buyers, 0.4:0*) price levels.
The Week Ahead
Monday the week begins with S&P Final U.S. Manufacturing PMI data at 9:45 am, followed by Construction Spending & ISM Manufacturing data at 10 am & Fed President Bostic speaking at 12 pm.
IDEXX Laboratories, Napco Security Systems, Saia, Twist Bioscience & Tyson Foods all report earnings before Monday’s opening bell, with AECOM, BellRing Brands, Cabot, Capital Southwest, Clorox, Equity Residential, Fabrinet, Healthpeak Properties, J&J Snack Foods, Kforce, Kyndryl, MGIC Investment, NJ Resources, NXP Semiconductors, Palantir Technologies, Rambus, Tempus AI & Woodward scheduled to report after the session’s close.
Job Openings & Factory Orders data are released Tuesday at 10 am, followed by Fed President Bostic speaking on Housing at 11 am, Fed President Daly speaking at 2 pm & Fed Vice Chairman Jefferson speaking at 7:30 pm.
Tuesday morning’s earnings calls include Amcor, Ametek, Aramark, Archer-Daniels-Midland, ATI Inc., Atkore International, Ball Corp, Berry Global, Centene, CNH Industrial, Colliers International Group, Cummins, Energizer, Enterprise Products, Estee Lauder, Ferrari, Fox Corp, Gartner, Graphic Packaging, Hamilton Lane, Hubbell, Ingredion, InMode, Jacobs Solutions, Kiniksa Pharmaceuticals, KKR, Lancaster Colony, Marathon Petroleum, Merck, MPLX LP, MSG Sports, Oaktree Specialty Lending Corp, PayPal Holdings, Pentair, PepsiCo, Pfizer, PJT Partners, Silicon Labs, Spotify Technology, Transdigm Group, UBS, UL Solutions, WEC Energy Group, Willis Towers Watson & Xylem, before Alphabet, 8×8, A10 Networks, Advanced Micro Devices, Allegiant Travel, Amdocs, American Financial Group, Amgen, Artisan Partners Asset Management, Aspen Technology, Atmos Energy, AZEK, Carlisle Companies, Chipotle Mexican Grill, Cirrus Logic, Columbia Sportswear, Douglas Emmett, DXC Technology, Electronic Arts, Enova International, Enphase Energy, Essex Property, Fair Isaac, FMC Corp, Golub Capital, H & R Block, Hanover Insurance, ICHOR Corp, IDEX Corp, Intapp, Jack Henry, Juniper Networks, Kulicke & Soffa, Lumen Technologies, Match Group, Mattel, Mercury, Modine Manufacturing, Mondelez International, Mueller Water, NOV Inc., O-I Glass, Omnicom, Oscar Health, Prudential, Rush Enterprises, Simon Properties, Skyline Champion, Snap, Unum Group, Varonis Systems, Veralto, Voya Financial, Western Union & Zurn Elkay Water Solutions report following the session’s closing bell.
Wednesday morning features ADP Employment data at 8:15, followed by U.S. Trade Deficit data at 8:30 am, Fed President Barkin speaking at 9 am, S&P Final U.S. Services PMI data at 9:45 am, ISM Services data at 10 am, Fed President Goolsbee speaking at 1 pm, Fed Governor Bowman speaking at 3 pm & Fed Vice Chairman Jefferson speaking at 7:30 pm.
Walt Disney, Ares Capital, Ares Management, ATS Corp, Azenta, Bio-Techne, Boston Scientific, Bunge, Capri Holdings, CDW, Cencora, Centuri Holdings, Criteo, Dayforce, Emerson, Evercore, FirstService, Fiserv, Gildan Activewear, GlaxoSmithKline, Griffon, Harley-Davidson, Illinois Tool Works, Johnson Controls, Kennametal, KinderCare Learning Companies, New York Times, Old Dominion Freight Line, Performance Food Group, Reynolds Consumer Products, RXO, South Bow, Spire, StandardAero, Stanley Black & Decker, T. Rowe Price, Timken, Uber Technologies, Vishay & Yum! Brands are all due to report earnings before Wednesday’s opening bell, followed by Aflac, Align Technology, Allstate, Alpha and Omega Semiconductor, Amentum Holdings, Arm Holdings, ASGN Inc, AvalonBay, Black Hills, BrightView, Central Garden, Cognizant Technology Solutions, Coherent, CONMED, Corpay, Corteva, Crown Holdings, CSG Systems, Curbline Properties, Deluxe, DHT, Digi International, Digital Turbine, Enersys, Envista, Equitable Holdings, First Industrial Realty, Ford Motor, FormFactor, Franco-Nevada, Globe Life, Hillenbrand, Hologic, Horace Mann, Impinj, Kemper, LandBridge, LiveRamp, Manulife Financial, McKesson, MetLife, MicroStrategy, Mid-America Apartment Communities, Moelis, Molina Healthcare, Murphy USA, Netgear, News Corp., O’Reilly Automotive, Omega Healthcare Investors, Paycor, PTC, Qiagen, Radian Group, Rayonier, Regal Rexnord, Rexford Industrial Realty, Safehold, Silicon Motion, SiTime, Skyworks Solutions, Steris, Stewart Information Services, Suncor Energy, Symbotic, Tenable Holdings, TTM Technologies, UDR, UGI Corp, Viking Therapeutics & WEX after the session’s close.
Initial Jobless Claims & U.S. Productivity data are released Thursday at 8:30 am, followed by Fed Governor Waller speaking at 2:30 pm & Fed President Logan speaking at 5:10 pm.
Thursday morning’s earnings calls include Advanced Drainage Systems, AGCO Corp, Air Products and Chemicals, AllianceBernstein, Aptiv, ArcelorMittal, Arrow Electronics, AstraZeneca, BCE Inc, Becton Dickinson, Belden, BorgWarner, Bristol-Myers Squibb, Canada Goose, Clearfield, CMS Energy, ConocoPhillips, Eli Lilly, Embecta, Entegris, Equifax, Equinox Gold, First Majestic Silver, Gates Industrial, Haemonetics, Hershey Foods, Hilton, Honeywell, Huntington Ingalls, Insight Enterprises, InterDigital, IQVIA, ITT, Kellanova, Kelly Services, Kenvue, Labcorp Holdings, Lightspeed, Lincoln National, Linde, MACOM Technology Solutions, MarketAxess, MasterCraft, MDU Resources, nVent Electric, Omnicell, Open Text, Patrick Industries, Peabody Energy, Peloton Interactive, Prestige Consumer, Ralph Lauren, Roblox, Snap-On, Spectrum Brands, Tapestry, Thomson Reuters, Tradeweb Markets, Under Armour, Valvoline, Warner Music Group, Xcel Energy, XPO, Yum China & Zimmer Biomet, beforeAffirm Holdings, Amazon, AptarGroup, Bill.com, Boyd Gaming, Camden Property, Cloudflare, CNO Financial, COPT Defense Properties, Cousins Properties, Doximity, e.l.f. Beauty, EastGroup, Encompass Health, ESCO Technologies, Expedia Group, Exponent, Fortinet, Fortune Brands Innovations, Genpact, GoPro, Hub Group, Illumina, Innovex International, Leslie’s, Lions Gate Entertainment, Lumentum, Mettler-Toledo, Microchip, Minerals Technologies, Mohawk Industries, Monolithic Power, NMI Holdings, Onto Innovation, Paylocity, Phillips Edison, Pinterest, Post, Powell Industries, Principal Financial Group, PROS Holdings, Qualys, QuinStreet, Regency Centers, Reinsurance Group of America, Skechers USA, Sonos, SS&C Technologies, StepStone Group, Synaptics, Take-Two Interactive Software, Varex Imaging, VeriSign, Victory Capital, WEBTOON Entertainment, Werner Enterprises, Wheaton Precious Metals report following the session’s close.
Friday the week winds down with U.S. Employment Report, U.S. Unemployment Rate, U.S. Hourly Wages & Hourly Wages Year-over-Year data at 8:30 am, followed by Fed Governor Bowman speaking at 9:25 am, Wholesale Inventories data & Consumer Sentiment (prelim) at 10 am & Consumer Credit data at 3 pm.
Avantor, Cboe Global Markets, Construction Partners, Flowers Foods, Fortive, Frontier Group Holdings, Green Plains, Kimco Realty, Newell Brands, Perella Weinberg Partners, Plains All American, Protolabs & Telus all report earnings before Friday morning’s opening bell.
See you back here next week!
*** I DO NOT OWN SHARES OR OPTIONS CONTRACT POSITIONS IN SPY, QQQ, IWM OR DIA AT THE TIME OF PUBLISHING THIS ARTICLE ***