SPY, the SPDR S&P 500 ETF fell -2.28% last week, while the VIX closed at 21.77 at the end of Friday’s session, indicating an implied one day move of +/-1.37% & a one month move of +/-6.29%.
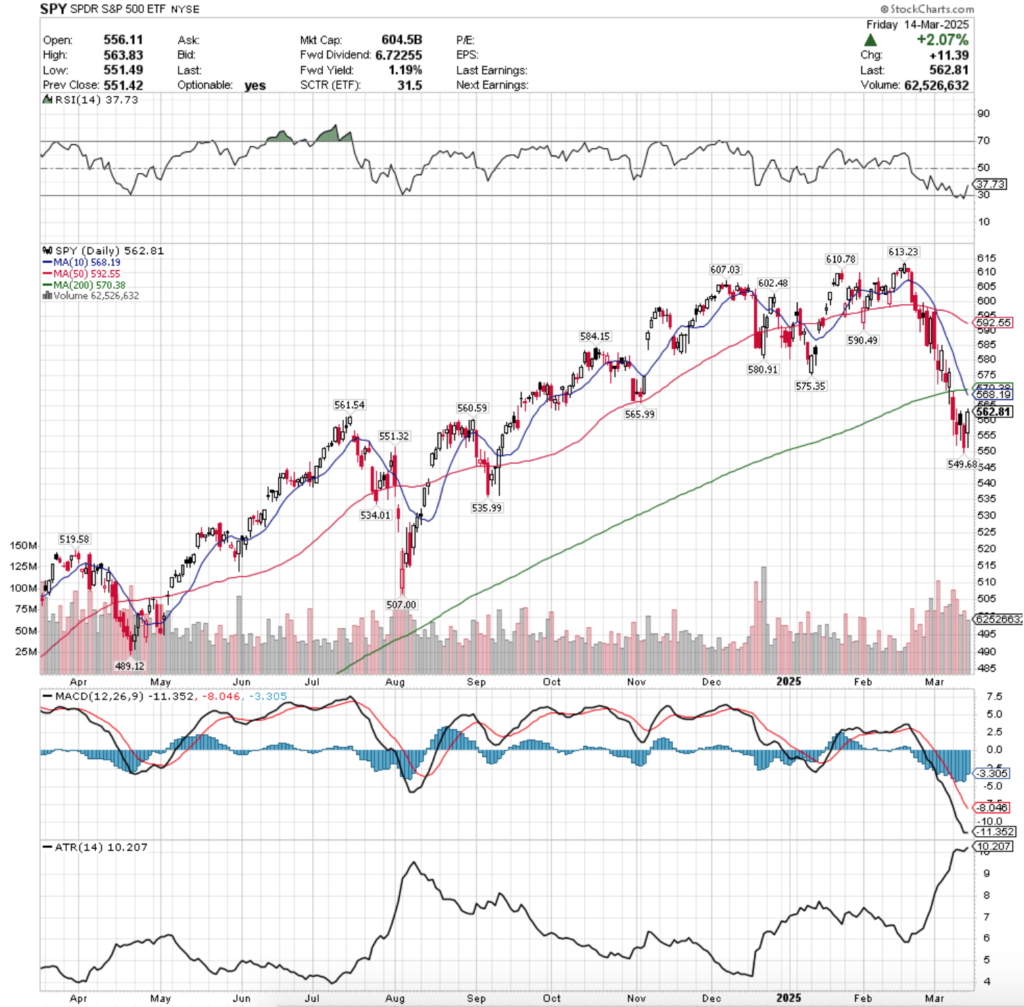
Their RSI has bounced back above the oversold 30 level after Friday’s advancing session & sits currently at 37.73, while their MACD is still bearish but has flattened out & is moving towards the signal line.
Volumes were +48.21% above the previous year’s average level (78,752,000 vs. 53,134,498), as for the second straight week sellers have snapped the weak volume of the past year.
Week-over-week volume declined -4.28%, but that isn’t reason to start celebrating just yet (last week’s note).
Monday kicked the week off on a bearish note, as a gap down open below the 200 day moving average was unable to break back above its resistance on the week’s highest volume session.
While the decline was unable to break down the $555/share mark, it showed that there was plenty of interest for prices to be pushed down to test it later in the week.
Tuesday saw the declines continue with another gap lower on the open on a high wave candle that temporarily broke down below the $555/share mark, while also attempting to test but falling short of the $565/share level.
Wednesday the sellers took a short breather & the day resulted in an advancing session, however it should be noted that the session began on a gap up, before breaking down below the $555/share price level & recovering to close below its opening price at $558.87/share.
Wednesday’s volume would be the second lowest of the week, which is important to note as the only day with less volume was Friday, the other advancing session of the week.
Thursday opened on another gap lower, before testing all the way down to below the $550/share price level, but was able to close above the session’s low of $549.68/share.
Friday the week wound down on a positive note, but under the hood there was still signs of trouble.
Firstly, the ten day moving average bearishly crossed through the 200 DMA & secondly the volume of the session in relation to the day’s wide trading range were also cause for concern.
Friday’s session managed to advance +2.07%, which brought the total declines of the week up to -2.28%, which does not inspire much confidence.
For the week ahead, any upside movement will require strong volume with it in order to prove sustainable & inspire confidence to the upside, especially given how steep the declines of the past month have been.
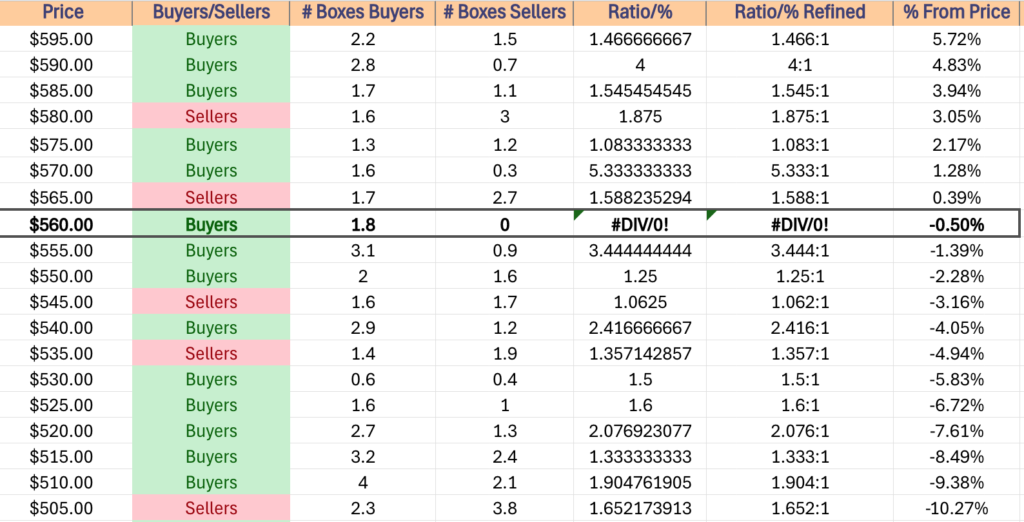
Historically SPY’s next two resistance levels occur in a Seller dominated price zone (1.59:1), which will make it even more imperative to have strong upside volume in the near-term to see any advances that are sustainable.
There’s a chance of a consolidation range within the body of Friday’s candle as we head towards Wednesday’s FOMC Interest Rate announcement, which would provide some seller volume in the price zone that currently is Buyers 1.8:0*
Should we get that consolidation & lackluster advancing volume the $549.68/share price level will be a key place to keep your eyes on, as it’s currently the support level that was most recently hit in the past week.
It also resides in a Seller zone, indicating that if it gets retested & broken through that there will be further declines on the horizon, as the next support level lives -2.49% below it & also happens to be within a Seller zone, along with the next lowest support level at $534.01.
If these break down the next support level is -2.7% lower at $519.58/share.
SPY has support at the $561.54 (Volume Sentiment: Buyers, 1.8:0*), $560.59 (Volume Sentiment: Buyers, 1.8:0*), $551.32 (Volume Sentiment: Buyers, 1.25:1) & $549.68/share (Volume Sentiment: Sellers, 1.06:1) price levels, with resistance at the $565.99 (Volume Sentiment: Sellers, 1.59:1), $568.19 (10 Day Moving Average, Volume Sentiment: Sellers, 1.59:1), $570.38 (200 Day Moving Average, Volume Sentiment: Buyers, 5.33:1) & $575.35/share (Volume Sentiment: Buyers, 1.08:1) price levels.
QQQ, the Invesco QQQ Trust ETF dropped -2.47% as investors fled the tech heavy index for a second consecutive week.
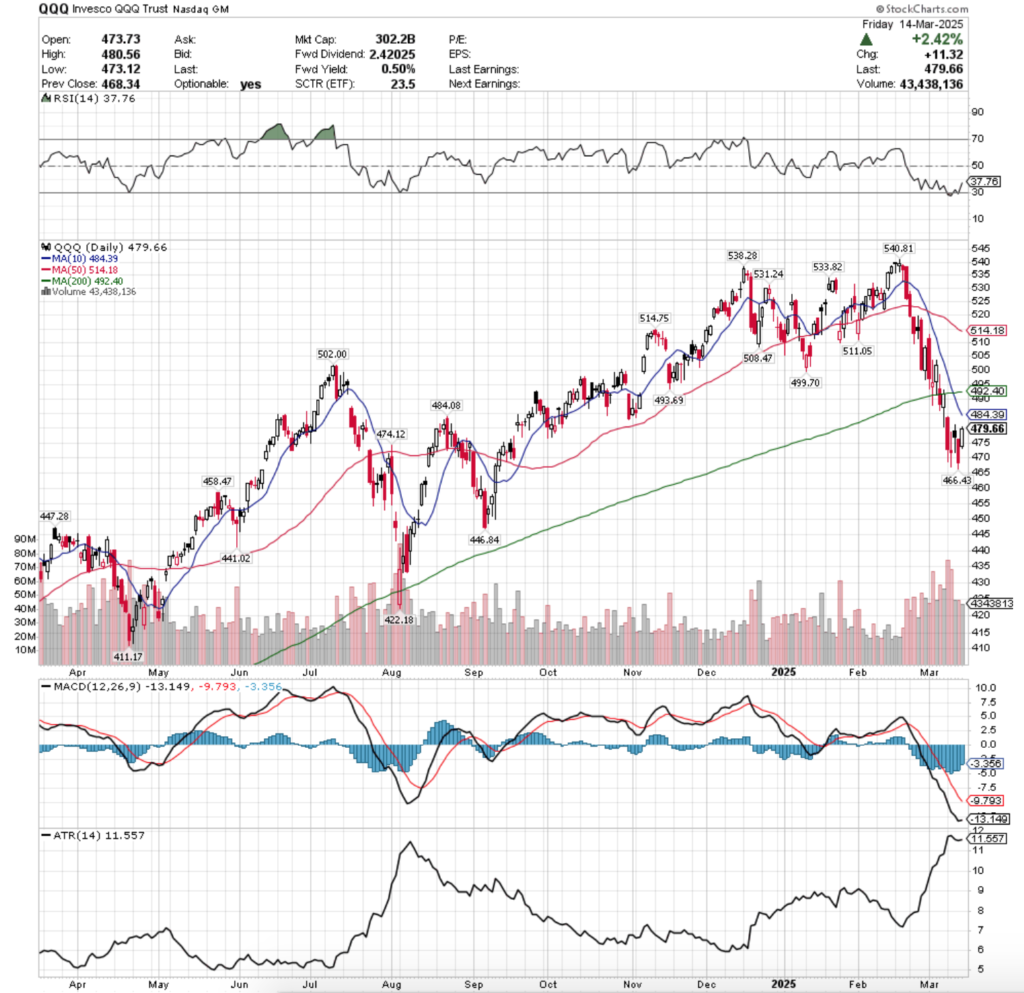
Their RSI has also just crossed back above the oversold 30 level & sits at 37.76, while their MACD is also bearish, but has flattened out & is moving towards the signal line.
Volumes were +60.5% above the prior year’s average level (56,504,000 vs. 35,204,137), and were +5.17% above last week’s QQQ volume, which should be approached with caution in the coming week.
QQQ’s week resembled SPY’s, as it kicked off with a gap lower on the week’s highest volume on Monday, with the $470/share level temporarily broken down through intraday.
Tuesday opened on a gap lower & resulted in a high wave candle that broke down through the $470/share level to the downside, and fell just short of the $480/share level to the upside, closing the day as a spinning top candle.
This symbol of uncertainty combined with the week’s second highest volume on a declining session is not reason to inspire confidence in the near-term.
Wednesday saw a gap up open that briefly crossed above the $480/share level, but that quickly deflated to dip beneath the $475/share price level before finally closing lower than it opened at $476.92.
While volumes were still eclipsing the rest of 2025’s levels, Wednesday & onward was very tame for QQQ compared to Monday & Tuesday.
Thursday the declines continued, as the day opened with a gap down & the declines continued to below the $470/share mark.
Friday offered a +2.42% advance, helping trim the week’s total losses to -2.47%.
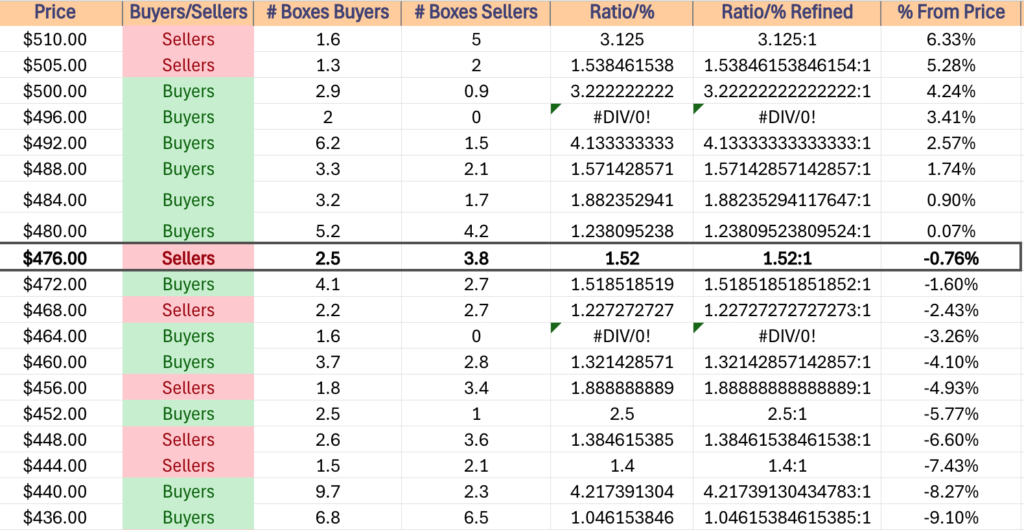
Much like SPY, the only way that there will be a sustainable recovery to the upside for QQQ will require there to be a major increase in advancing volume & any up days that don’t show that should be viewed with a suspicious eye.
This is especially true given that Friday’s closing price falls in a Seller dominated zone at a ratio of 1.52:1, so an increase in volume will be needed to trump historic Seller senitment.
This week there will likely be a consolidation within the price range of the latter portion of last week, as the 10 day moving average catches up to QQQ’s price, which may then lead to oscillation around the short-term trend line.
The downside case for QQQ is not a particularly rosy picture, as while there has been plenty of Buyer support at their next three support levels, they’ve also been relatively untested & the fourth support level requires a -6.6%+ drop before it can be tested, where it enjoys a Seller:Buyer ratio of 1.4:1.
Should this occur, it will be time to focus on the $441.02/share support level, where Buyers have historically been victorious at a clip of 4.22:1.
QQQ has support at the $474.12 (Volume Sentiment: Buyers, 1.52:1), $466.43 (Volume Sentiment: Buyers, 1.6:0*), $458.47 (Volume Sentiment: Sellers, 1.89:1) & $447.28/share (Volume Sentiment: Sellers, 1.4:1) price levels, with resistance at the $484.08 (Volume Sentiment: Buyers, 1.88:1), $484.39 (10 Day Moving Average, Volume Sentiment: Buyers, 1.88:1), $492.40 (10 Day Moving Average, Volume Sentiment: Buyers, 4.13:1) & $493.69/share (Volume Sentiment: Buyers, 4.13:1) price levels.
IWM, the iShares Russell 2000 ETF shed only -1.49% last week, as the small cap index outperformed the rest of the pack after three months of steady declines.
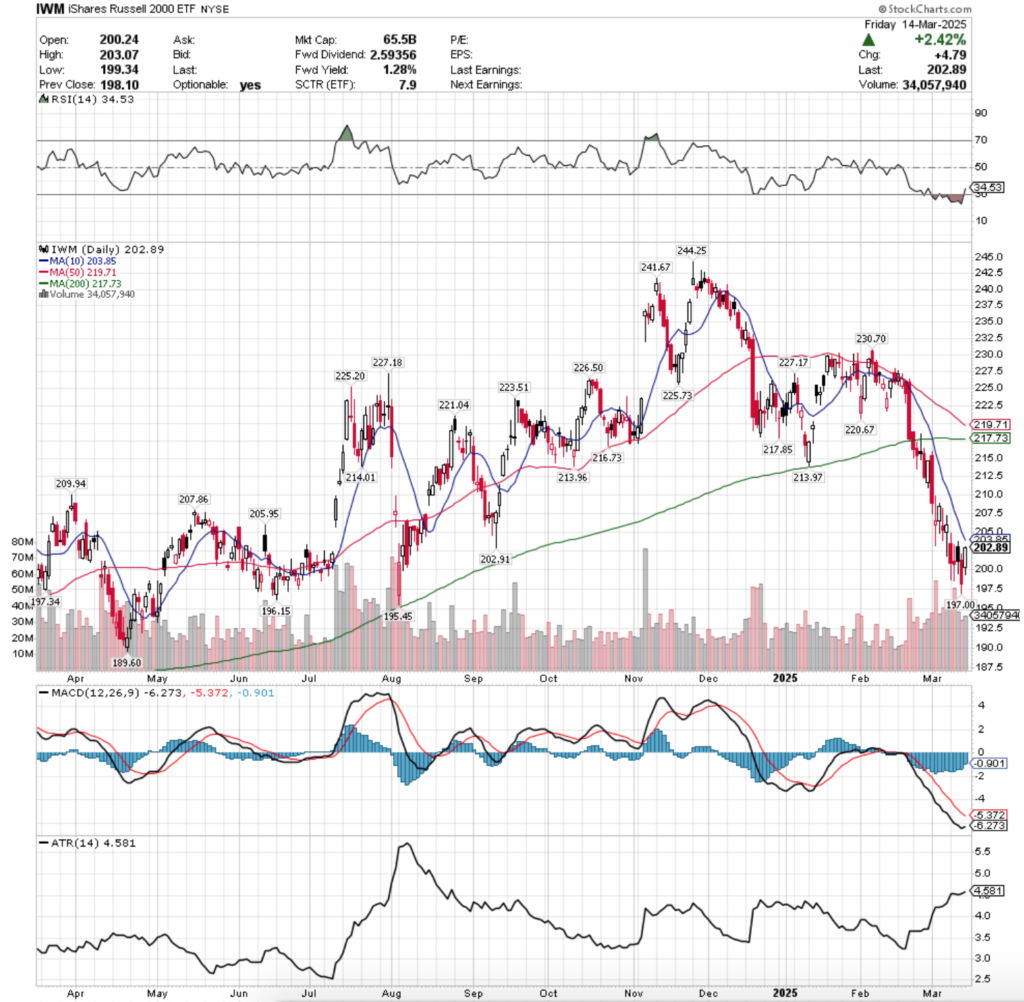
Their RSI has also just peeked its head back up above the oversold 30 mark & is currently at 34.53, while their MACD is bearish, but moving towards the signal line following the range of the past week that IWM stayed within.
Volumes were +33.63% above the previous year’s average level (38,652,000 vs. 28,924,779), which doesn’t inspire much confidence, given that Friday’s +2.42% session brought the total week’s losses to -1.49%.
Monday kicked the week off on a gap down for IWM on the week’s second highest volume of the week, where the upper shadow of the day’s candle couldn’t break above the $205/share level, while the lower range of the day indicated that there was appetite below the $200/share level.
Tuesday also did not inspire confidence for IWM, as the week’s highest volume session resulted in a high wave spinning top candle, where the day’s high did not break above Monday’s opening price & the day’s low almost matched Monday’s low, all the while the day closed as a declining day.
Wednesday opened on a gap up, before retreating to temporarily trade below $200/share & ultimately closed lower than it opened, indicating that there was still a lot of negative sentiment in the market for the small cap index.
Thursday provided the week’s weakest volume, but also provided the local downside support level at $197/share based on the day’s low, while Friday managed to close out the day for an advancing session.
The coming week will be interesting for IWM, as any type of advance will require an uptick in volume to be taken seriously & should be viewed skeptically if there is no volume improvement.
We will likely see some form of consolidation heading into mid-week, where the $197 support level gets retested & price oscillates around the 10 day moving average until we get a greater catalyst to the upside or downside.
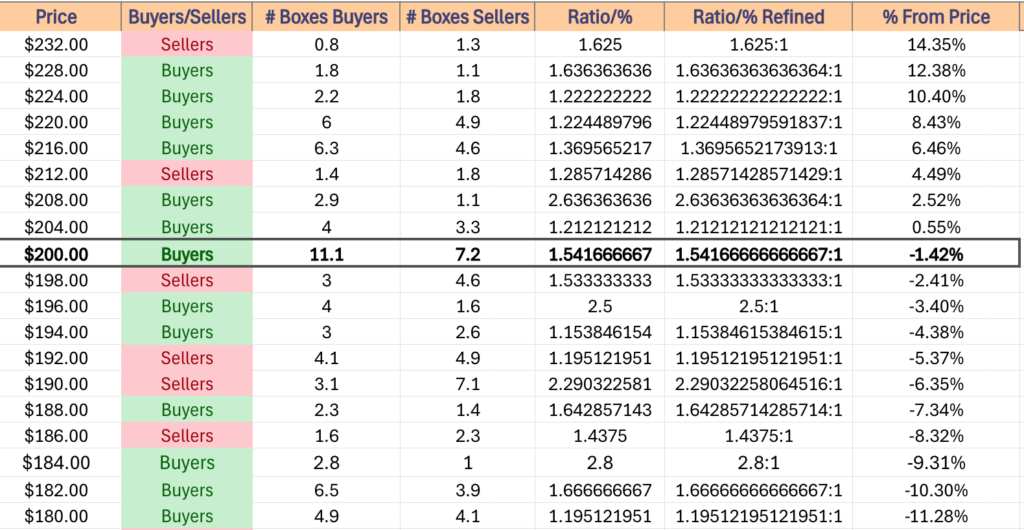
As for downside risks, IWM currently only has 5 support levels below Friday’s closing price on their one year chart, the lowest of which is $189.60/share.
What makes this significant is that the current support zone beneath IWM’s Friday close are the only 2 Buyer dominated zones that occur before historic Seller volume leads prices towards that retest.
The table below will be important to review in the coming weeks with regards to IWM’s price movement.
IWM has support at the $197.34 (Volume Sentiment: Buyers, 2.5:1), $197 (Volume Sentiment: Buyers, 2.5:1), $196.15 (Volume Sentiment: Buyers, 2.5:1) & $195.45/share (Volume Sentiment: Buyers, 1.15:1) price levels, with resistance at the $202.91 (Volume Sentiment: Buyers, 1.54:1), $203.85 (10 Day Moving Average, Volume Sentiment: Buyers, 1.54:1), $205.95 (Volume Sentiment: Buyers, 1.21:1) & $207.86/share (Volume Sentiment: Buyers, 1.21:1) price levels.
DIA, the SPDR Dow Jones Industrial Average ETF declined -3.01% last week, faring the worst of the major index ETFs as investors dumped names in the blue chip index.
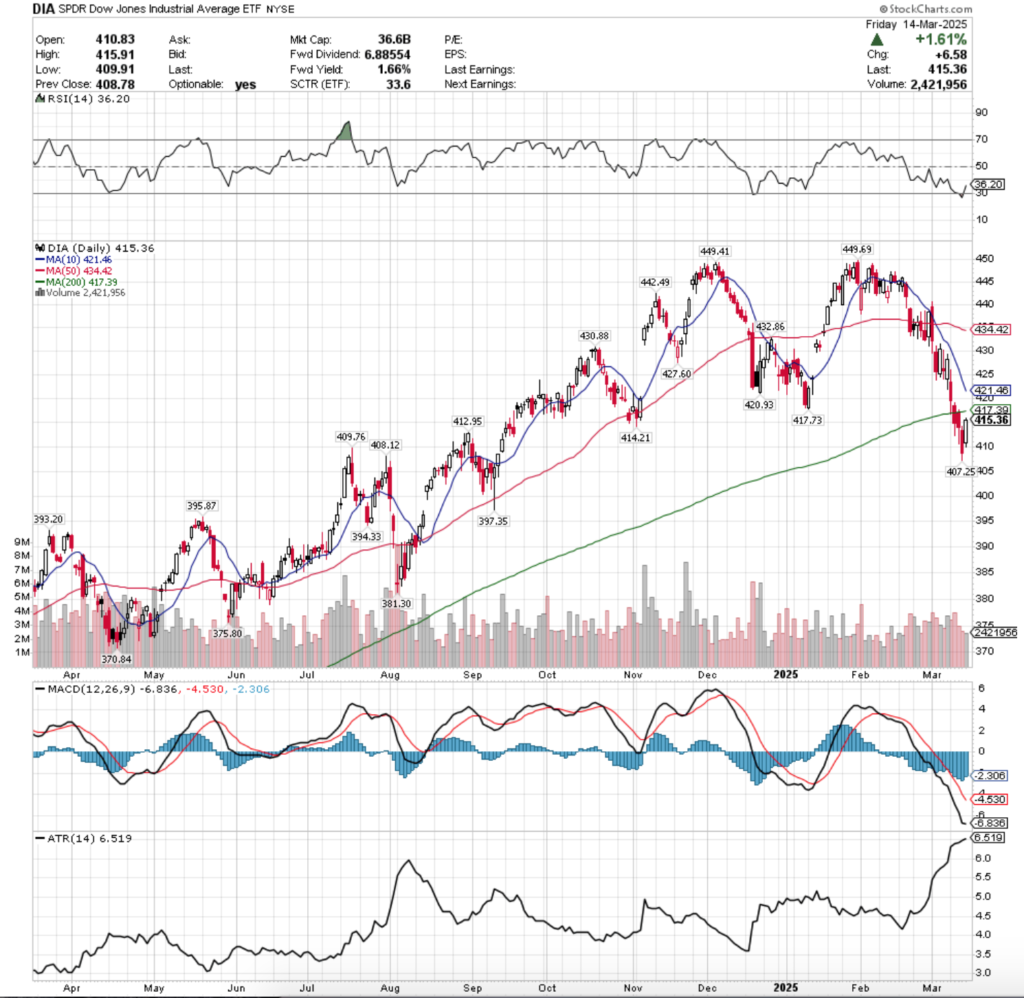
Their RSI has just came back from oversold territory & sits at 36.2, while their MACD is still bearish, but has flattened & may approach the signal line in the coming week.
Volumes were -5.56% lower than the previous year’s average (3,054,000 vs. 3,233,896), bucking the trend of higher volumes, despite losing the most on the week out of the major index ETFs.
While DIA has been the most resilient of the major index ETFs, the blue chip names have begun to show cracks as their long-term trend line broke down last week.
Monday DIA opened on a gap down, where the day’s high occurred above $425/share, but the day’s low went down to test the support of the 200 day moving average.
Tuesday the negative sentiment continued, as the highest volume session of the week opened on a gap lower & broke through the 200 DMA’s support & continued lower, closing below the $515/share mark.
Wednesday this trend continued, as DIA opened in-line with the 200 DMA, tried to poke its head out higher, but was rejected & broke down to approach the $410/share level & closed lower on the day.
Thursday opened on another gap down for the third of the week & declined all the way down to the new $407.25/share support level before recovering a little bit & closing at $413.95.
Friday’s +1.61% advance cut DIA’s weekly losses to -3.01%, indicating that there is still quite a bit of bearish sentiment in the markets right now.
Much like the aforementioned three indexes, DIA will require a spike in advancing volume in order to recover from the past few weeks in a sustainable manner.
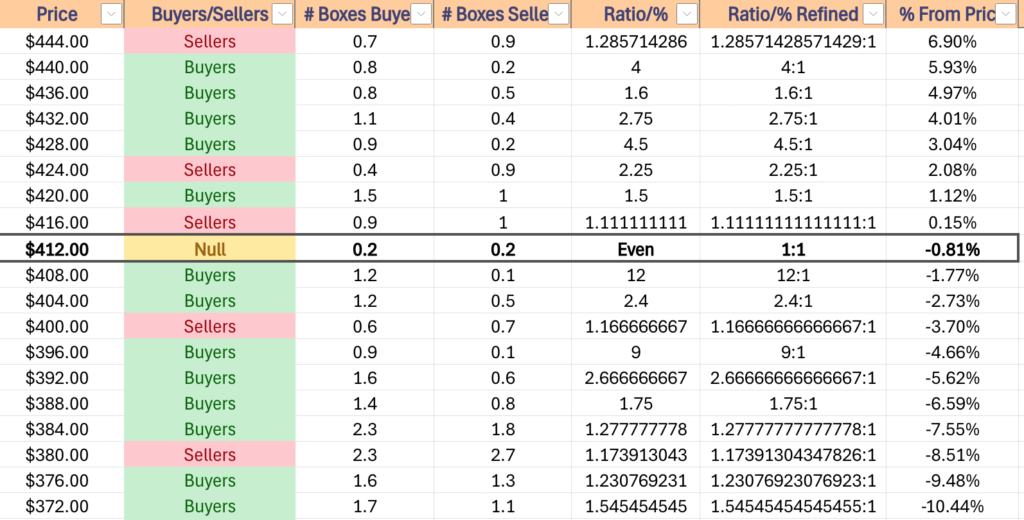
They’re also in a unique position, in that their current price level is in a price zone where buyers & sellers have met at a ratio of 1:1 in the last 4-5 years, but their next two resistance levels occur in a zone that has gone to the sellers at a rate of 1.1:1.
With the 10 day moving average fast approaching the 200 DMA there is still some downside pressure on DIA’s price, but it seems likely that there will be at least a short-term consolidation that oscillates between the $407.25/share mark & the 200 day moving average.
Another area of worry for DIA is in the event that their prices do break down, as the $408-411.99/share zone has seen limited downside volume & that ratio will likely be diluted further down from 12:1.
Should it break down & the $407.25/share support level can’t hold up, there isn’t a local support level until $397.35/share, which is -2.43% lower & enters another relatively overly bullish ratio zone.
The table below will be valuable in the coming week(s) to gain insight into DIA’s potential price movements based on historic volume data.
DIA has support at the $414.21 (Volume Sentiment: Even, 1:1), $412.95 (Volume Sentiment: Even, 1:1), $409.76 (Volume Sentiment: Buyers, 12:1) & $408.12/share (Volume Sentiment: Buyers, 12:1) price levels, with resistance at the $417.39 (200 Day Moving Average, Volume Sentiment: Sellers, 1.11:1), $417.73 (Volume Sentiment: Sellers, 1.11:1), $420.93 (Volume Sentiment: Buyers, 1.5:1) & $421.46/share (10 Day Moving Average, Volume Sentiment: Buyers, 1.5:1) price levels.
The Week Ahead
Monday the week kicks off with U.S. Retail Sales, Retail Sales minus Autos & Empire State Manufacturing Survey data at 8:30 am, followed by Business Inventories & Home Builder Confidence Index data at 10 am.
Science Applications & Textron report earnings before Monday’s opening bell, with Getty Images & Open Lending scheduled to report after the session’s close.
Housing Starts, Building Permits, Import Price Index & Import Price Index minus Fuel data are all released at 8:30 am, before Industrial Production & Capacity Utilization data is released at 9:15 am.
Tuesday morning’s earnings calls include HUYA, KE Holdings & Tencent Music, followed by Maravai LifeSciences & ZTO Express after the closing bell.
Wednesday afternoon features the FOMC Interest-Rate Decision at 2pm & Fed Chair Powell’s Press Conference at 2:30 pm.
General Mills, Kingsoft Cloud, Ollie’s Bargain Outlet, Signet Jewelers & Sportradar Group report Wednesday morning before the session opens, followed by Super Micro Computer, Five Below & Worthington Steel after the session’s close.
Initial Jobless Claims & Philadelphia Fed Manufacturing Survey data are released Thursday morning at 8:30 am, followed by Existing Home Sales & U.S. Leading Economic Indicators data at 10 am.
Thursday morning’s earnings calls include Academy Sports + Outdoors, Commercial Metals, Darden Restaurants, Designer Brands, FactSet, Jabil, Shoe Carnival & ZEEKR Intelligent, with FedEx, Lennar, KinderCare Learning Companies, Luminar Technologies, Micron, NIKE & Torrid reporting after the closing bell.
Friday features no major economic data announcements & NIO & Carnival will report earnings before the opening bell.
See you back here next week!
*** I DO NOT OWN SHARES OR OPTIONS CONTRACT POSITIONS IN SPY, QQQ, IWM OR DIA AT THE TIME OF PUBLISHING THIS ARTICLE ***