SPY, the SPDR S&P 500 ETF ended the week -1.48% lower, while the VIX closed the week at 21.65, indicating an implied one day move of +/-1.36% & an implied one month move of +/-6.26%.
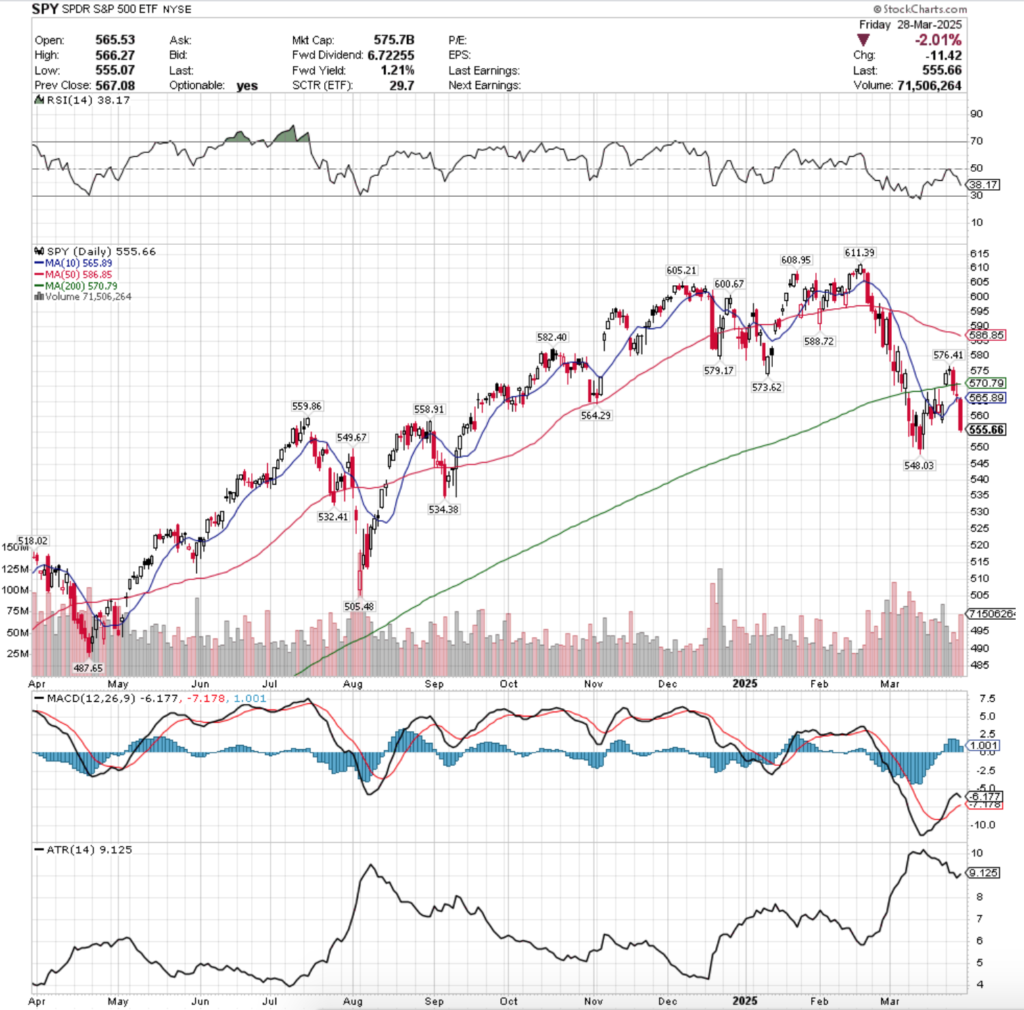
Their RSI is trending down towards oversold levels & currently sits at 38.17, while their MACD is bullish, but has curled over bearishly & looks primed to cross the signal line on Tuesday.
Volumes were -0.08% lower than the prior year’s average (52,636,000 vs. 52,680,680), which shows a lack of investor optimism based on the three day decline streak that ended the week.
Monday the week kicked off on a gap up session to open & remain above the support of the 200 day moving average on the week’s second highest volume.
This pump was short lived though, as Tuesday went on to show that there were no legs supporting that one day rally when the week’s lowest volume session opened on a gap up & closed setting up for an evening doji star reversal.
Wednesday opened slightly lower than Tuesday, but selling pressure mounted & the 200 day moving average’s support broke down & SPY managed to close beneath it, setting the stage for the declines of the rest of the week.
Thursday SPY opened on a gap down, briefly tested the 200 DMA’s resistance overhead, but was rejected & closed as a doji just above the 10 DMA’s support.
Friday SPY’s short term trend broke down, as it opened on a gap lower & declined -2.01% on the week’s strongest volume, indicating that there was not much appetite for holding risk heading into the weekend.
For the week ahead, much of last week’s note is still in play, given how close their week-over-week closing levels were.
There is still no base forming for SPY & uncertainty seems to be lingering longer than many had thought.
Extreme caution should follow any movements to the upside without stronger than average volume attached to them, as was shown by Monday & Tuesday’s sessions of last week.
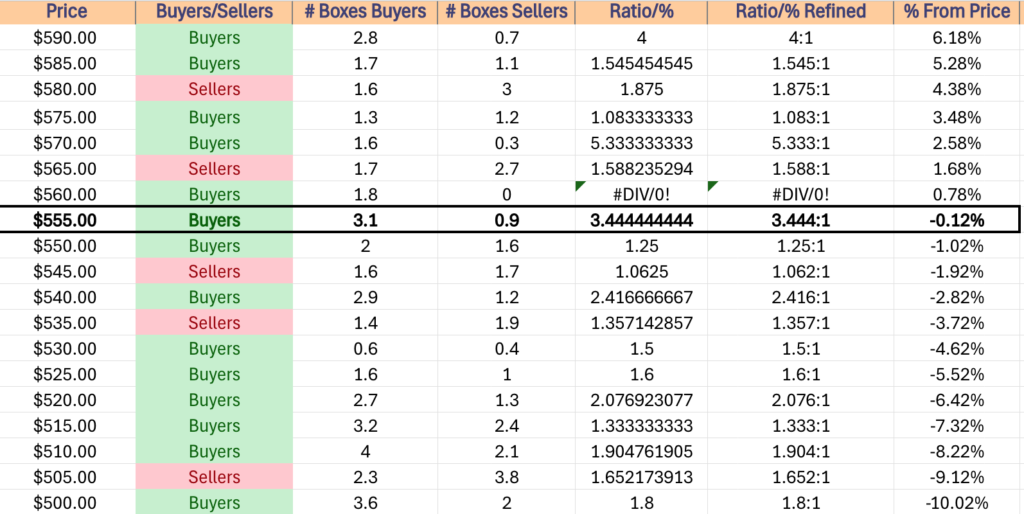
If SPY is able to consolidate within the range it is in & maintain above $548.03 we may witness the 200 DMA become a stronger level for support which would help move SPY higher.
However, the longer it takes for that to occur the less likely it becomes, given that the 50 day moving average is moving bearishly towards the 200 DMA.
In the event of further declines that $548.03 level will be imperative for SPY to keep its head above, as otherwise it lacks any support until $534.38, and it has zones of historic selling pressure to help lower it down there based on investor behavior over the past ~2-3 years.
Look for continued oscillations around the 10 day moving average moving into the week as SPY tries to establish a base, else that $548.03/share level.
SPY has support at the $549.67 (Volume Sentiment: Sellers, 1.06:1), $548.03 (Volume Sentiment: Sellers, 1.06:1), $534.38 (Volume Sentiment: Buyers, 1.5:1) & $532.41/share (Volume Sentiment: Buyers, 1.5:1) price levels, with resistance at the $558.91 (Volume Sentiment: Buyers, 3.44:1), $559.86 (Volume Sentiment: Buyers, 3.44:1), $564.29 (Volume Sentiment: Buyers, 1.8:0*) & $570.79/share (200 Day Moving Average, Volume Sentiment: Buyers, 5.33:1) price levels.
QQQ, the Invesco QQQ Trust ETF declined -2.47% last week, as the tech-heavy index fared the worst of the major four.
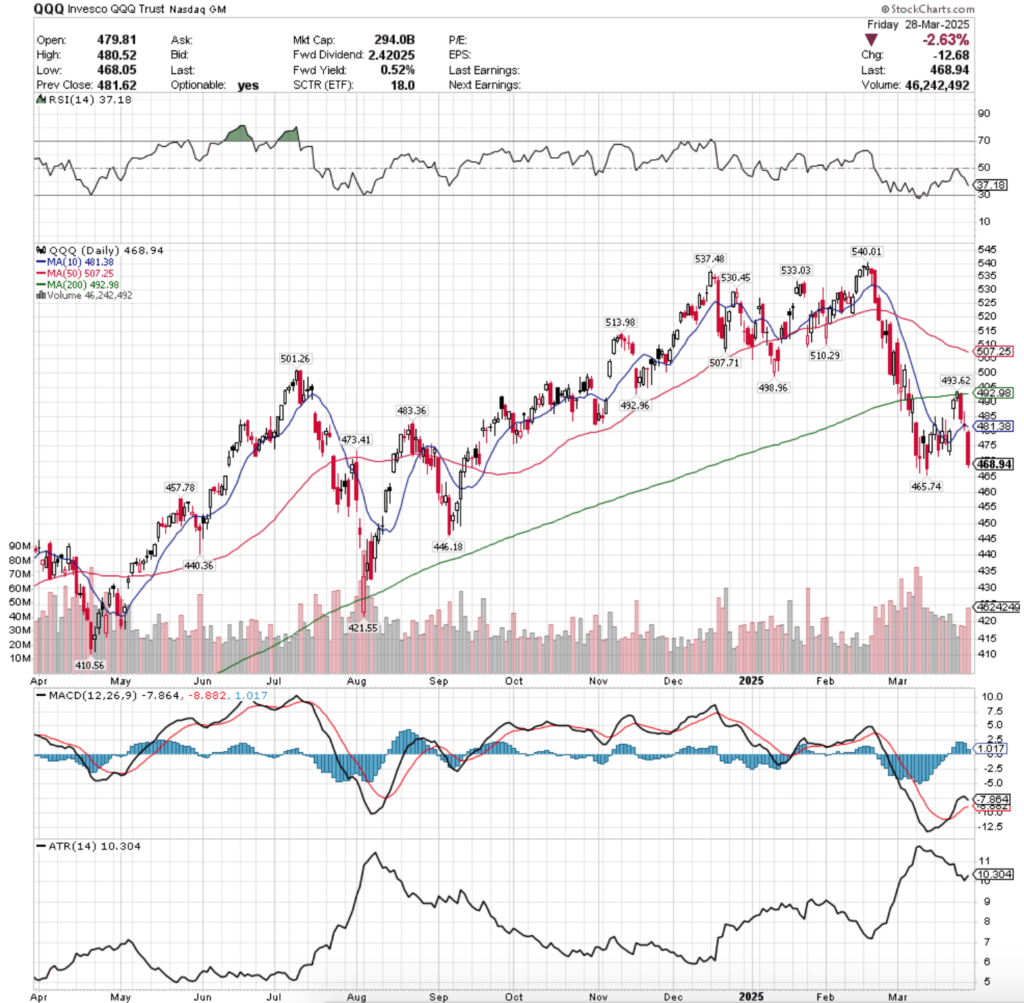
Their RSI is declining towards the oversold 30 mark & sits currently at 37.18, while their MACD is still bullish, but should be crossing bearishly through the signal line by Wednesday.
Volumes were -0.29% lower than the prior year’s average (35,096,000 vs. 35,199,440), which confirms that the long-term trend has broken yet again for QQQ after Tuesday’s attempt to break out above it.
Monday opened QQQ’s week up on a gap up, but intraday the $485/share level was briefly broken through to the downside, before investors piled in to push it higher to close the day.
Tuesday opened with another gap up, a brief dip lower before breaking out above the 200 day moving average to close above the long-term trend line.
However, Tuesday carried the week’s weakest volume, making it clear that there was not a lot of bullish sentiment behind the false breakout.
Wednesday confirmed this when QQQ opened in-line with the 200 DMA & then sunk to below the $485/share level.
Thursday opened on a gap lower to be in-line with the 10 day moving average, temporarily was squeezed above the $485/share level, before breaking back below the 10 day moving average temporarily & closing in-line with it as a doji candle.
This didn’t just signify indecision, but also would set the stage for how QQQ’s short-term trend-line is viewed by market participants, which they voiced their opinions of on Friday.
Friday opened with a gap down & the highest volume session of the week resulted in a -2.63% decline for QQQ.
Like SPY, QQQ is in relatively the same position it was in last week.
There will be no lasting upside movements without a major influx in advancing volume that occurs for many days, not just a session or two & a base will need to form to act as support as well.
In the event of consolidation, expect to see prices oscillate around the 10 day moving average while waiting to observe if a base that can provide actual support forms.
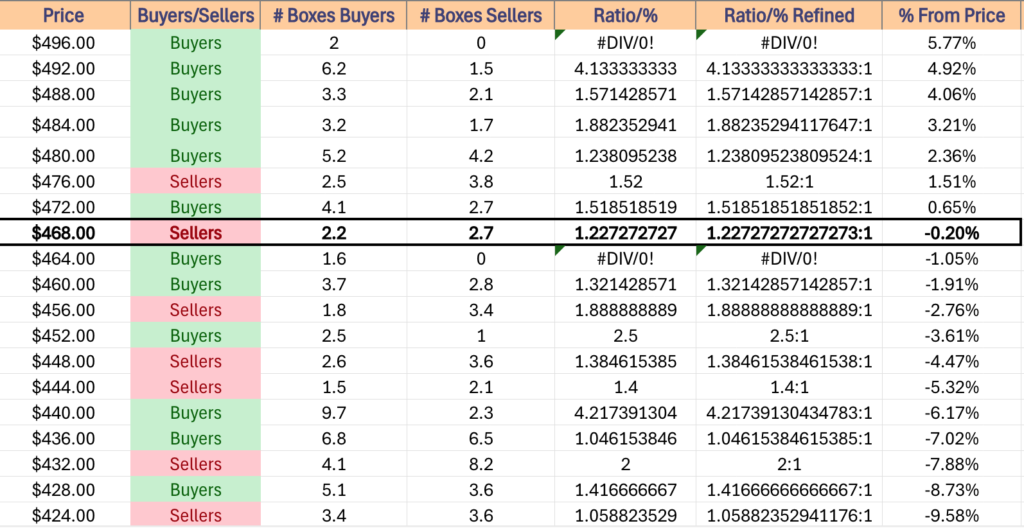
In the event of further declines, the $446.18/share support level should be watched, as if that breaks down the $440.36 level will become a new downside frontier.
While it resides in a Buyer heavy zone, such a heavy ratio may mean that there will be more sellers stepping in to dilute the ratio, which will be an area to watch in the event that the level is approached.
QQQ has support at the $465.74 (Volume Sentiment: Buyers, 1.6:0*), $457.78 (Volume Sentiment: Sellers, 1.89:1), $446.18 (Volume Sentiment: Sellers, 1.4:1) & $440.36/share (Volume Sentiment: Buyers, 4.22:1) price levels, with resistance at the $473.41 (Volume Sentiment: Buyers, 1.52:1), $481.38 (10 Day Moving Average, Volume Sentiment: Buyers, 1.24:1), $483.36 (Volume Sentiment: Buyers, 1.24:1) & $492.96/share (Volume Sentiment: Buyers, 4.13:1) price levels.
IWM, the iShares Russell 2000 ETF fell -1.64% last week, as small cap names were the second least favorite by index.
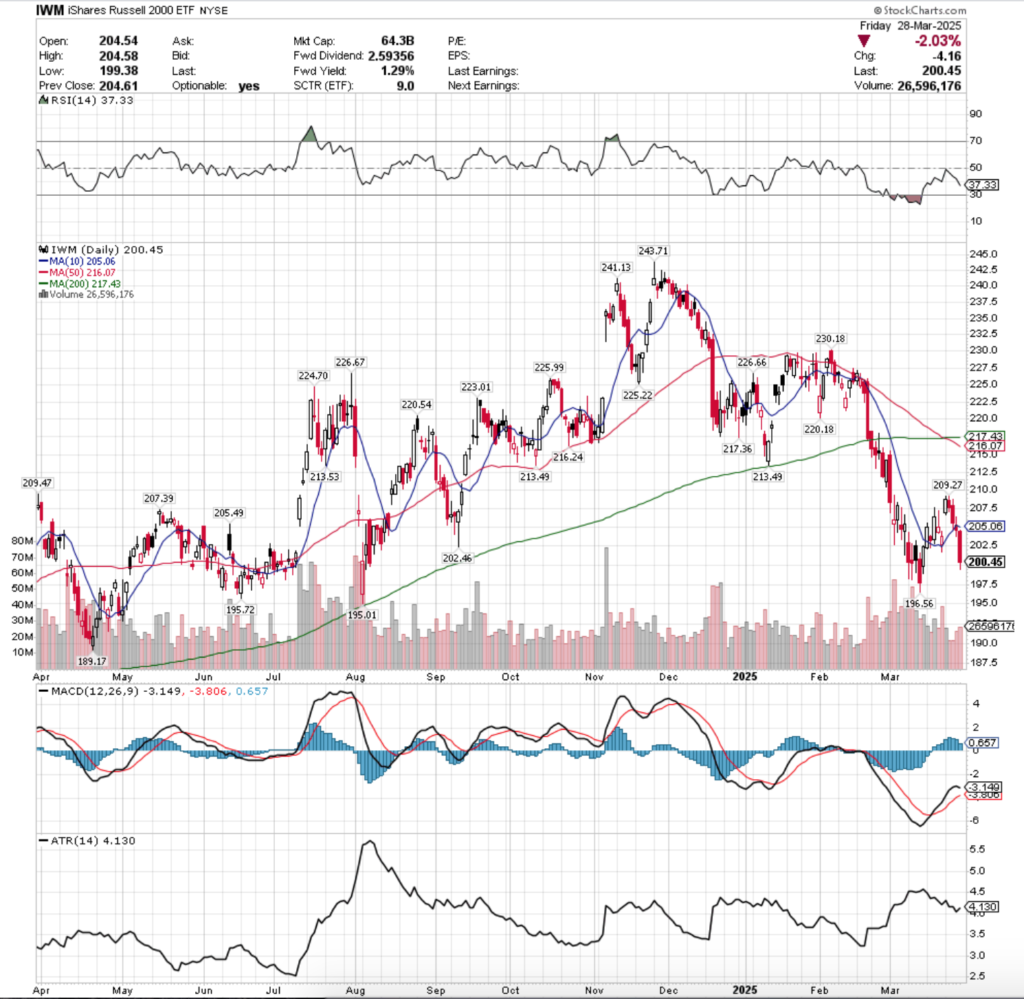
Their RSI is is declining towards the oversold level of 30 & sits currently at 37.33, while their MACD looks ready to cross bearishly through the signal line by Wednesday.
Volumes were -20.67% lower than the prior year’s average (22,730,000 vs. 28,651,440), as while the index fell, there was a more cautious approach to selling compared to what we saw with SPY & QQQ.
Monday the week began just like SPY & QQQ’s with a giant gap up on muted volume.
Tuesday showed even lower volume, but the day resulted in decline that formed a bearish harami pattern with Monday’s candle, setting the stage for the declines of the rest of the week.
Wednesday the low volume trend continued as IWM slid to test the 10 day moving average’s support briefly intraday, but managed to close above it.
Thursday opened on a gap down in-line with the 10 day moving average, tested higher & below it before closing below the 10 DMA’s resistance, indicating that there was a loss of faith in the short-term trend line.
The subdued volume that was the second highest of the week, paired with the spinning top candle indicated that there’s still a bit of uncertainty about the near-term for IWM & the small caps, but that people aren’t inclined to be holding much risk at the moment.
Friday morning brought us another gap down open, and the week’s highest volume session resulted in a decline of -2.03%, as it was made clear that no one was overly keen on the thought of carrying risk into the weekend.
Much like SPY & QQQ, IWM’s short-term advances should be viewed skeptically in the near-term.
Without a dramatic uptick in volume that lasts for many sessions IWM is still sitting on unsteady ground.
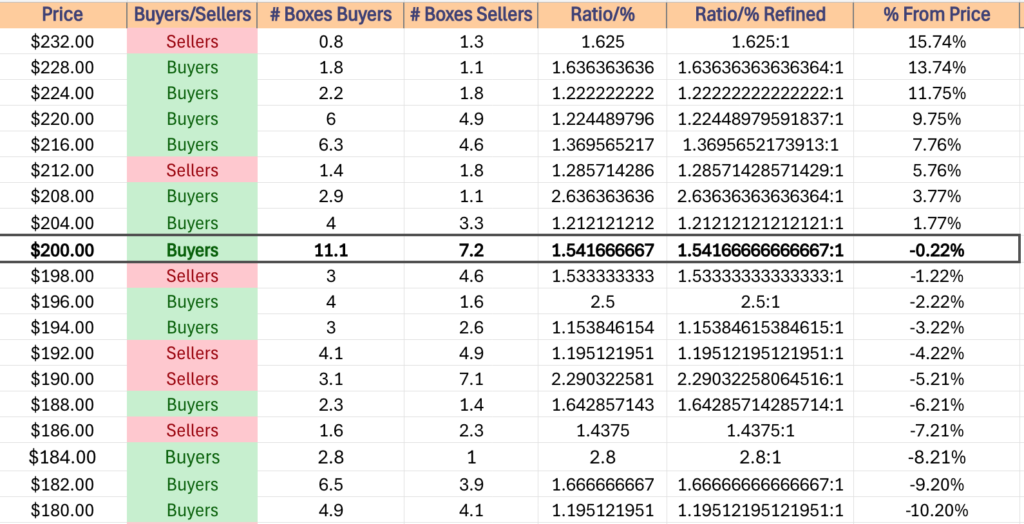
If the $195.01-196.56 support zone holds up we may be able to find a short term consolidation that could serve as a base, but if that doesn’t occur IWM enters deeper into Seller dominated territory & additional losses should be expected, until the $189.17/share support level.
IWM has support at the $196.56 (Volume Sentiment: Buyers, 2.5:1), $195.72 (Volume Sentiment: Buyers, 1.15:1), $195.01 (Volume Sentiment: Buyers, 1.15:1) & $189.17/share (Volume Sentiment: Buyers, 1.64:1) price levels, with resistance at the $202.46 (Volume Sentiment: Buyers, 1.54:1), $205.06 (10 Day Moving Average, Volume Sentiment: Buyers, 1.21:1), $205.49 (Volume Sentiment: Buyers, 1.21:1) & $207.39/share (Volume Sentiment: Buyers, 1.21:1) price levels.
DIA, the SPDR Dow Jones Industrial Average ETF dipped -0.95% last week, as the blue chip index was able to tread water in comparison to the other major four indexes.
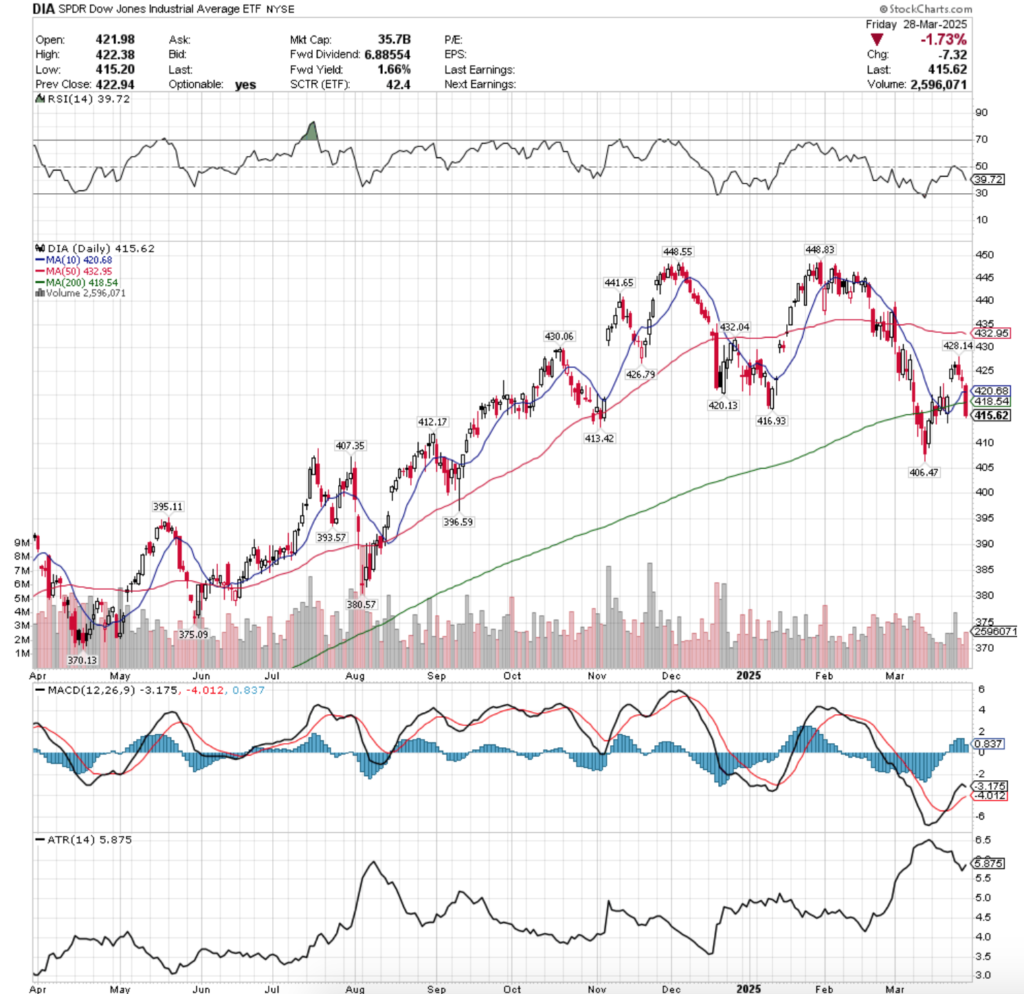
Their RSI is declining towards the oversold mark & sits currently at 39.72, while their MACD looks primed to cross over bearishly by mid-week.
Volumes were -17.45% lower than the prior year’s average (2,632,000 vs. 3,188,480), which shows that market participants were taking a bit of a wait & see approach to the blue chip index.
In a rare event, SPY, QQQ, IWM & DIA all began the week in the same manner, gap up opens on weak volume.
Tuesday opened on another gap up, but this time there was a healthy dose of volume with it, but there was still hints of bearishness creeping in by the close of trading.
The session resulted in a hanging man candle, with an additional hint of bearish sentiment in their close being lower than their open.
Wednesday is when things began breaking down, as while the $128.14/share level was tested to the upside, it was abruptly denied & the session closed below the $425/share level.
Thursday the bearish sentiment continued with a gap down open, a brief attempt to trade above $425/share that did not last long, before declining further to end the day as a spinning top candle.
Friday DIA emerged with a gap down open that then proceeded to decline below the support of both the 10 & 200 day moving averages before closing -1.73% on the week’s second highest volume as there was limited risk appetite over the weekend among market participants.
Like the previous three index ETFs, dramatic upside advancing volume will be required before DIA can begin climbing sustainably, and all near-term advances should be treated with caution & skepticism.
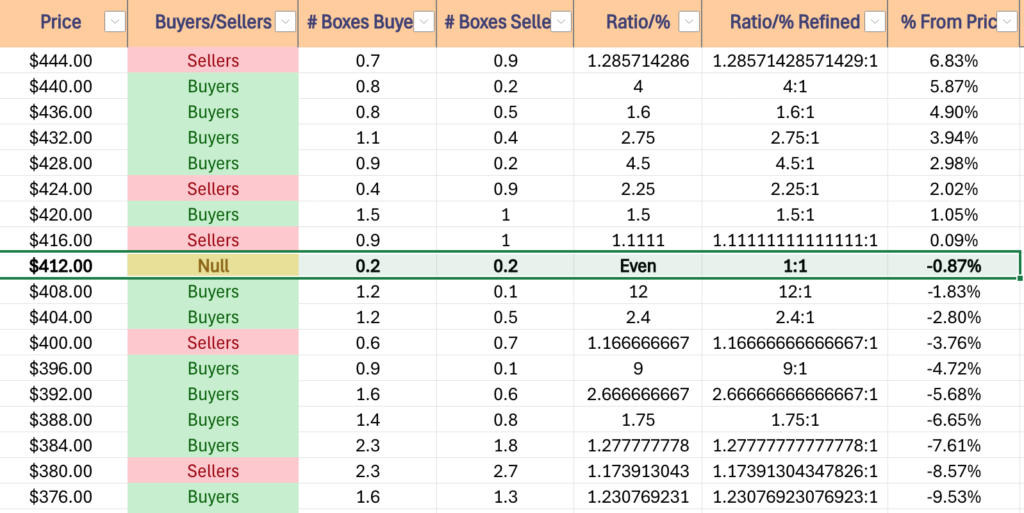
A consolidation featuring oscillations around the 200 DMA while market participants decide how much faith they still have in the long-term trend line is also a possibility on the near-term menu, particularly as the volume sentiment in DIA’s current price zone has historically been Even 1:1 between Buyers:Sellers over the past ~4-5 years.
DIA’s remained resilient relatively speaking compared to the other index ETFs, but it is not immune from declines, particularly if the right macro catalyst comes along, such as a reaction to new tariffs.
In the event DIA begins to decline, the table below is a good place to review how market participants may step in or out based on their price level.
DIA has support at the $413.42 (Volume Sentiment: Even, 1:1), $412.17 (Volume Sentiment: Even, 1:1), $407.35 (Volume Sentiment: Buyers, 2.4:1) & $406.47/share (Volume Sentiment: Buyers, 2.4:1) price levels, with resistance at the $416.93 (Volume Sentiment: Sellers, 1.11:1), $418.54 (200 Day Moving Average, Volume Sentiment: Sellers, 1.11:1), $420.13 (Volume Sentiment: Buyers, 1.5:1) & $420.68/share (10 Day Moving Average, Volume Sentiment: Buyers, 1.5:1) price levels.
The Week Ahead
Monday the week begins with the Chicago Business Barometer (PMI) at 9:45 am.
Loar Holdings reports earnings before Monday’s opening bell, followed by PVH & Tech Target after the session’s close.
S&P Final U.S. Manufacturing PMI data is released Tuesday at 9:45 am, followed by Construction Spending, ISM Manufacturing & Job Openings data at 10 am & Auto Sales data TBD.
Tuesday afternoon brings us earnings from nCino.
Wednesday morning begins with ADP Employment data at 8:15 am, before Factory Orders data at 10 am & Fed Governor Kugler speaking at 4:30 pm.
AngioDynamics, Cognyte Software & UniFirst report earnings before Wednesday’s opening bell, before RH, BlackBerry & Penguin Solutions report after the session’s close.
Initial Jobless Claims & U.S. Trade Deficit data come out at 8:30 am on Thursday, followed by S&P Final U.S. Services PMI data at 9:45 am, ISM Services data at 10 am, Fed Vice Chairman Jefferson speaking at 12:30 pm & Fed Governor Cook speaking at 2:30 pm.
Thursday’s before the bell earnings calls include Acuity, Conagra, Lamb Weston, Lindsay Corp & MSC Industrial, followed by Guess? & Simulations Plus after the closing bell.
Friday the week winds down with U.S. Employment Report, U.S. Unemployment Rate, U.S. Hourly Wages & Hourly Wages Year-over-Year data at 8:30 am, Fed Chairman Powell speaking at 11:25 am, Fed Governor Barr speaking at 12 pm & Fed Governor Waller speaking at 12:45 pm.
Greenbrier reports earnings before Friday morning’s opening bell.
See you back here next week!
*** I DO NOT OWN SHARES OR OPTIONS CONTRACT POSITIONS IN SPY, QQQ, IWM OR DIA AT THE TIME OF PUBLISHING THIS ARTICLE ***