SPY, the SPDR S&P 500 ETF closed the week down -9.07% while the VIX closed the week out at 45.31, indicating an implied one day move of +/-2.86% & an implied one month move of +/-13.1%.
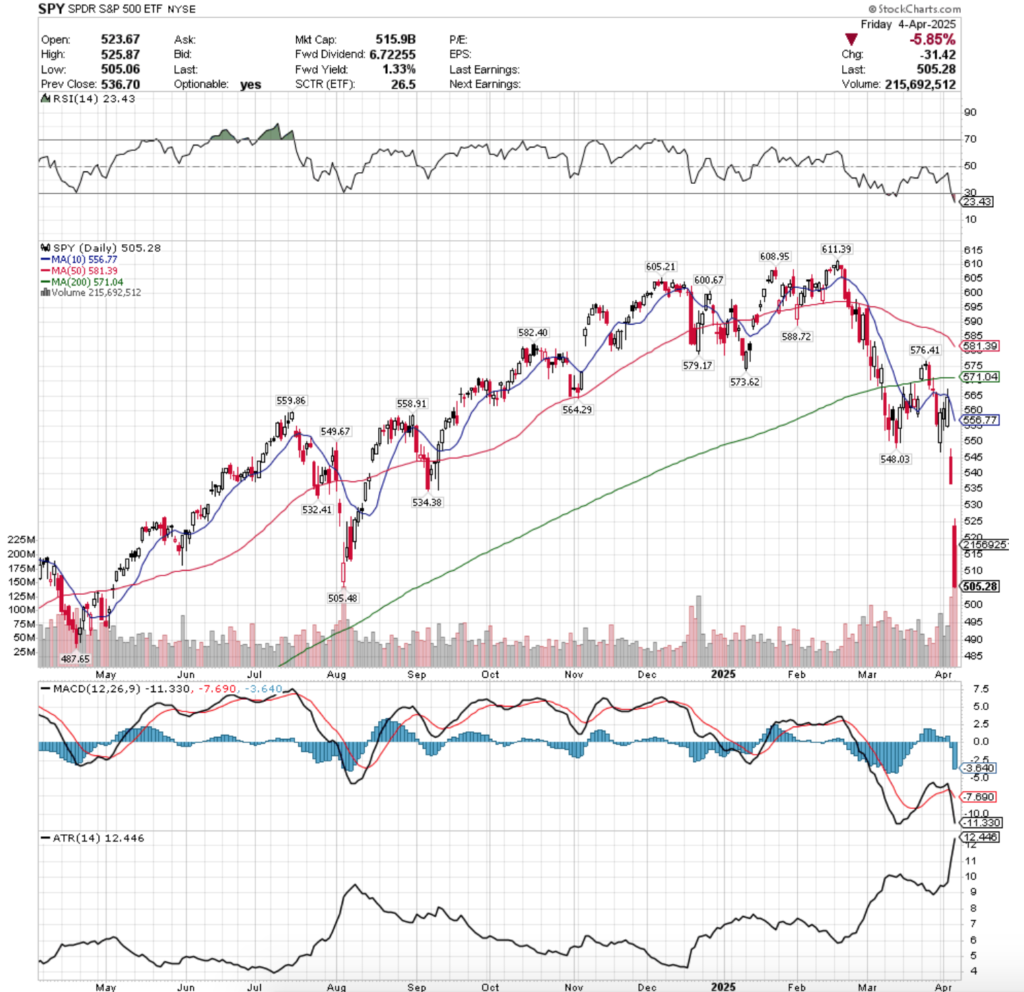
Their RSI dropped into oversold territory & is currently at 23.43, while their MACD is deeply bearish, despite taking until Thursday to cross over.
Volumes were +112.07% above the prior year’s average (113,982,000 vs. 53,746,865), which shouldn’t be a surprise that it’s problematic given how Thursday & Friday’s declining volume eclipse most of the previous years’ levels.
Monday the week kicked off with a gap down open below the $550/share level, with a brief test lower towards $545, before the squeeze came along & the week’s third highest volume led to an advance that tested above the $560/share level, but managed to close at $559.39/share for the day.
Tuesday SPY opened lower, tested beneath the $555/share level, but managed to softly creep higher to close at $560.97 on the week’s lowest volume, a longer lower shadow than higher shadow & fear clearly setting in among market participants.
Wednesday opened lower at $555.05/share, briefly dipped below the $550/share level, before on the week’s second weakest volume climbing up to briefly break above the 10 day moving average’s resistance & the $565/share price level, & settling for the day in-line with the 10 DMA at $564.52/share.
While this may have been seen by some as a bullish head-fake, anyone who’s been following out notes over the past month know that the 10 DMA was going to be respected, if not oscillated around (last week’s note here).
Trouble set in on Thursday, when a gap down open to $536.70/share lead to a brief advance to a high of $547.97/share, before being pummeled down to $536.70/share at the close on the week’s second highest volume; setting the stage for a heavily “risk off into the weekend” Friday.
Friday didn’t disappoint for those who were watching the volume sentiment analyses posts, as a gap down open on the highest level of volume in the past 2+ years led to a large sell off heading into the weekend .
What’s more important than Friday’s eclipsing volume & -5.85% decline for the day is this week’s data set up.
Wednesday we get a hint into what March’s FOMC discussions looked like when the meeting minutes are released in the afternoon, which may lead to possible consolidation/a light, volume-less pump for the beginning of the week (unlikely, but possible), as market participants hope for near-term profits before more market catalyst news.
This is not the most likely, nor most important thing to focus on, but worth having in mind.
Thursday we get CPI data & Friday PPI data, which is more likely to be when we see meaningful market movements.
Oscillators such as RSI & MACD are currently both stretched bearishly to a point that they may continue downward (which will on Monday/Tuesday be more contingent on international markets or news we haven’t seen yet as of Sunday evening), but a breather on declines as mentioned above could be in the mix on two days of mostly unimportant earnings & limited market data being released.
But Wednesday will be a time to begin paying attention, as whatever is released in the minutes notes will be directly applicable to Thursday/Friday’s data & be something to focus on for formulating a near-to-mid-term hypothesis about where SPY goes next.
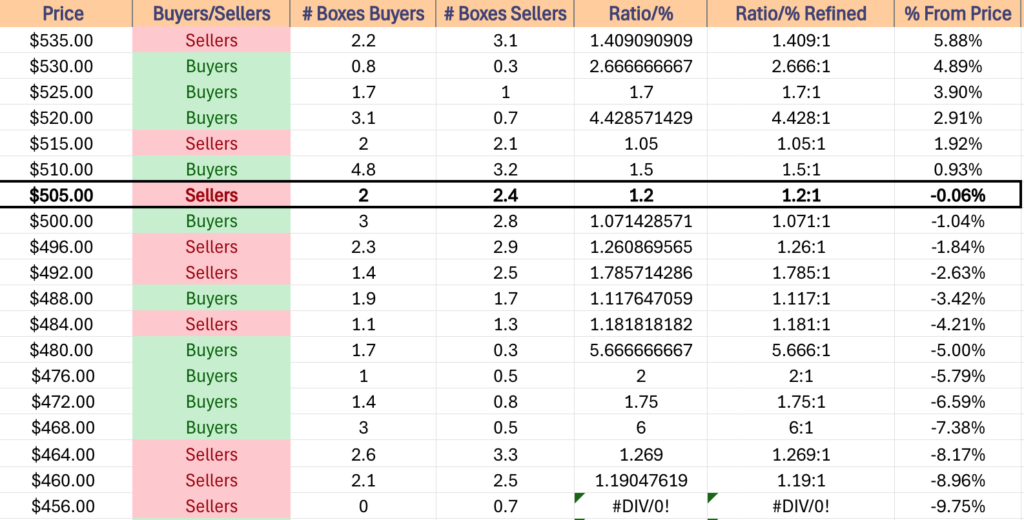
Thus far, volume sentiment tables like the one below have served good use, and look to continue to be reliable in the coming weeks.
In the coming week, we still are at the base case that any upward movement without substantial volumes behind it is nothing to think much of until there has been multiple sessions with above average advancing volume that establish an actual base.
Until then, treat all upside moves (particularly today, Tuesday 4/8’s) with a skeptical brow furrowed, as there will be short-term squeezes meant to bait market participants back into the pool for other folks to unload their shares on.
It is most likely that we see oscillations around the 10 DMA heading into mid-week, before the FOMC minutes & CPI/PPI nudge SPY in one direction or another heading into the latter half of the week.
Given how far off the 10 DMA is currently from Friday’s closing price, it is not unreasonable to expect to see prices squeeze up to attempt to fill the window created by Friday’s gap down open, but otherwise consolidation within the range of Friday’s large candle body will likely play out to be par for the course.
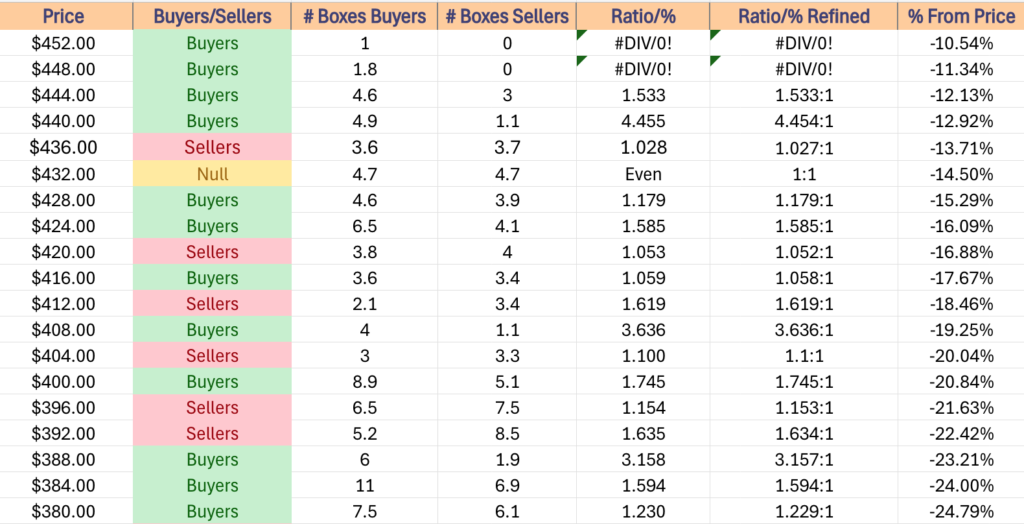
Given that the one year support levels are all almost exhausted, it is time to begin looking at the table below in relation to SPY’s 2 year support levels, as the volume sentiments that those levels have traded at are still relevant to the table data below & in the link to the broader volume sentiment analysis article.
SPY has support at the $505.48 (Volume Sentiment: Sellers, 1.2:1), $487.65 (Volume Sentiment: Sellers, 1.18:1), $448.85 (2 Year Chart, Volume Sentiment: Buyers, 1.8:0*) & $443.22/share (2 Year Chart, Volume Sentiment: Buyers, 4.45:1) price levels, with resistance at the $532.41 (Volume Sentiment: Buyers, 2.67:1), $534.38 (Volume Sentiment: Buyers, 2.67:1), $548.03 (Volume Sentiment: Buyers, 1.44:1) & $549.67/share (Volume Sentiment: Buyers, 1.44:1) price levels.
QQQ, the Invesco QQQ Trust ETF declined -9.87%, as the tech heavy index took the biggest beating of the major four in this week’s carnage.
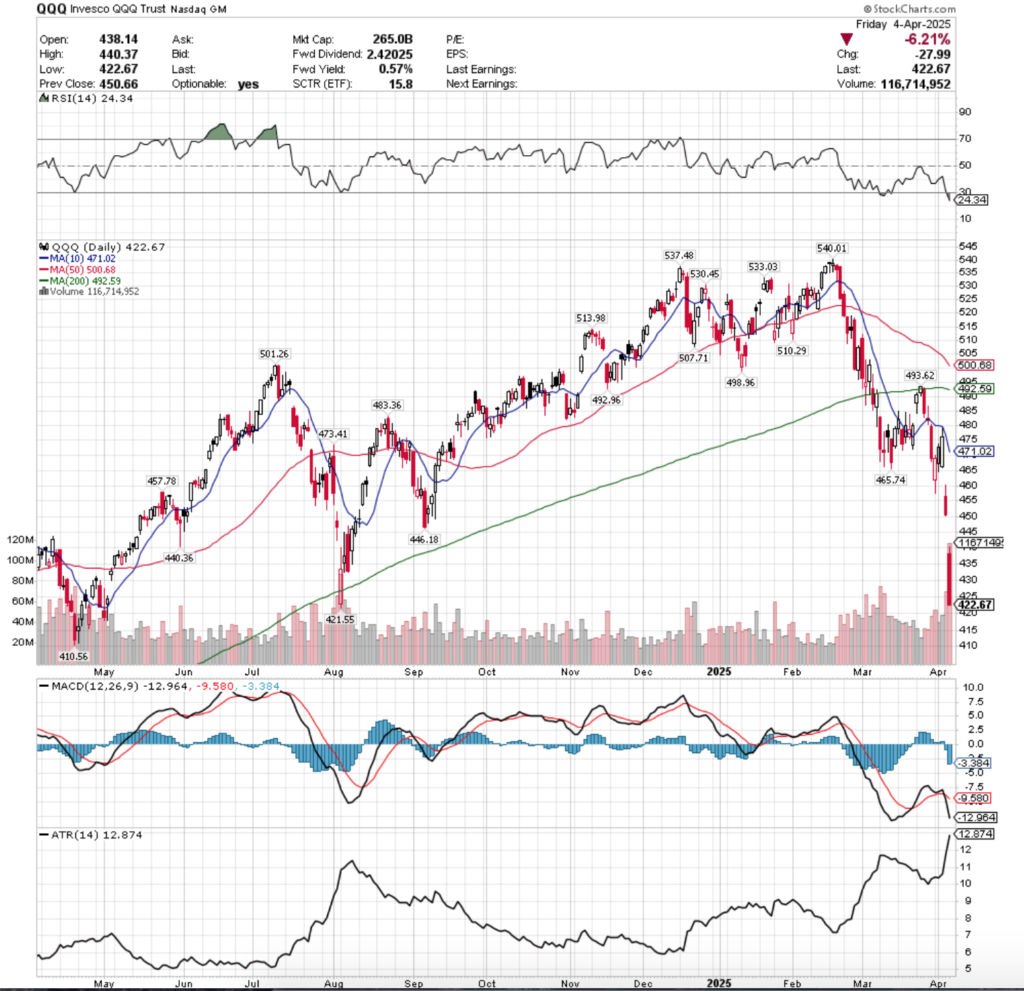
Their RSI is in oversold territory at 24.34, while heir MACD also crossed over bearishly on Thursday & is deeply bearish.
Volumes were +85.52% above the prior year’s average level (66,320,000 vs. 35,748,095), which should be setting off warning bells among even the most passive of market participants, as something a lot of folks have omitted from discussion recently is that for all of the passive retail investor moves out of tech, the ETF exposure to them will have to follow suit & sell.
While a handful of folks out there have been addressing this, it’s still not being discussed as much as you’d think, given the prominence of ETFs & the exposure they are able to give anyone to instruments that the average investor shouldn’t be playing with.
There’s also likely in the event of a major declining move going to be an interesting discussion in the events of bailouts, as should an ETF holding systemically important derivatives somehow earns being bought out, rather than allowed to fail, despite holding unique levered contracts on tech companies (based on ETF landscape, but not targeting tech specifically, just more likely to hit the sector than others based on how many ETFs there are out there/their focuses).
Monday the week began on a note of bearish uncertainty, when the session opened on a gap down at the third highest volume of the week, broke below the $460/share level, before rebounding & closing higher than the open, but two pennies shy of Friday’s close.
Tuesday the shaky upward movement continued on the week’s lowest volume, followed by a bullish engulfing candle from Wednesday’s session.
Wednesday had some bearish sentiment aside from the second lowest volume of the week too though, as the day’s high tested the resistance of the 10 DMA & the short-term trend line said no, which set the stage for the rest of the week.
Thursday opened on a gap down, temporarily ripped above the $460/share level, before declining lower on the second highest volume of the week to close at $450.66/share, setting the stage for a very bearish Friday.
Friday the risk off sentiment carried on, opening on a gap down, briefly testing higher, before declining-6.21%, and the declining volume bar is taller than the day’s candle, indicating a severe loss of confidence in QQQ.
Much like SPY, there’s going to need to be a significant improvement in sentiment before there is any chance of a reversal for QQQ, so we’re not going to get into the bullish case.
The bearish case will also be intriguing, as like SPY, QQQ is now moving into the 2 year chart in terms of support levels.
Their consolidation case will likely remain within the body of Friday’s candle until the 10 DMA catches up below, after which it will begin to oscillate around that support/resistance level while we await new news or technical indicators changing.
The table below & a two year support/resistance level chart will be of value in the coming week while QQQ gets itself sorted out.
QQQ has support at the $421.55 (Volume Sentiment: Sellers, 1.5:1), $410.56 (Volume Sentiment: Buyers, 4:1), $383.59 (2 Year Chart, Volume Sentiment: Buyers, 2.63:1) & $376.52/share (2 Year Chart, Volume Sentiment: NULL, 0:0*) price levels, with resistance at the $440.36 (Volume Sentiment: Buyers, 3.27:1), $446.18 (Volume Sentiment: Sellers, 2:1), $465.74 (Volume Sentiment: Buyers, 2:1) & $473.41/share (Volume Sentiment: Sellers, 1.19:1) price levels.
IWM, the iShares Russell 2000 ETF fell -9.61% last week, as small cap names were the second most dumped during the massive sell off.
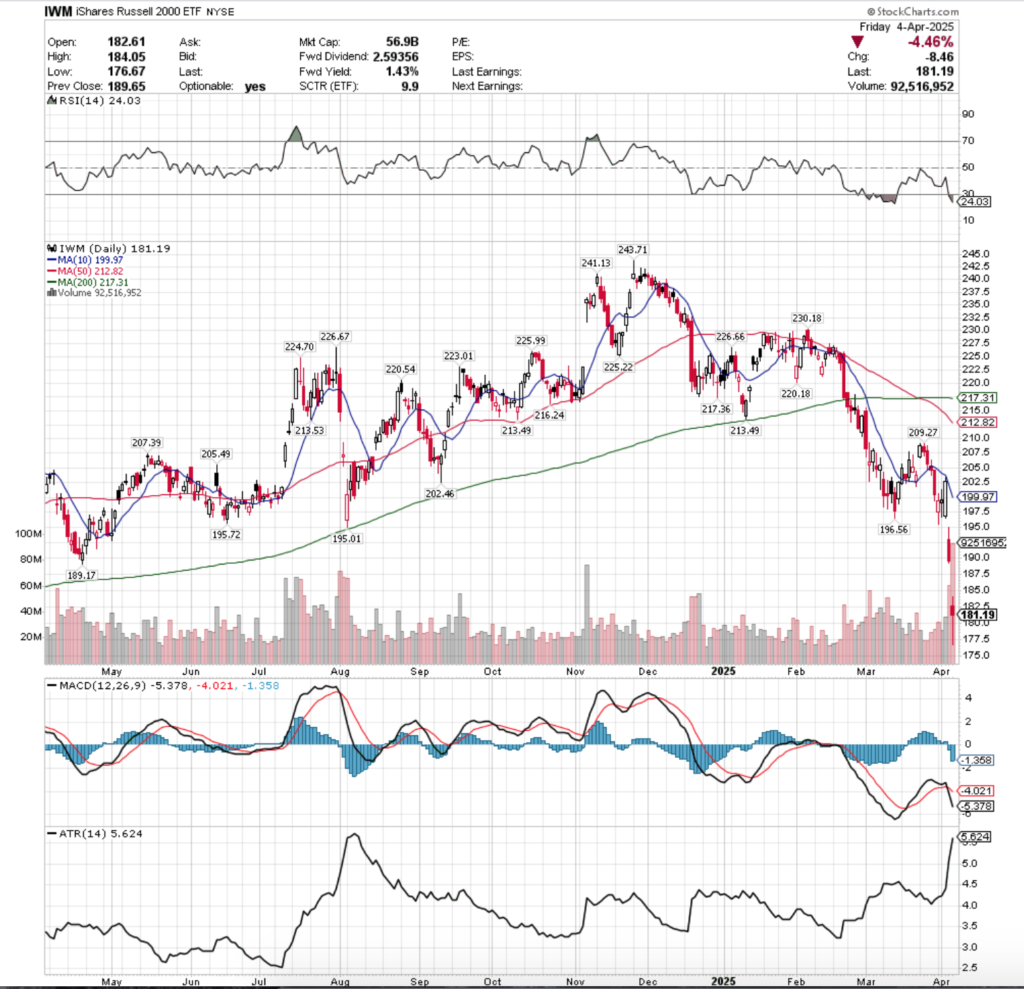
Their RSI oversold at is 24.03, while their MACD crossed over bearishly on Thursday.
Volumes were +70.77% above the prior year’s average (49,612,000 vs. 29,052,579), mostly due to Thursday & Friday’s declining sessions that eclipsed most of the past year.
The week started off on a sour note for IWM, as a gap down open on Monday dipped below the $197.50/share level before powering higher, but volume was so light that there was not much bullish sentiment behind the move up to close higher than the session’s open.
Tuesday saw the week’s weakest volume for IWM, on a high wave spinning top candle, which left market participants with a taste of bearish uncertainty.
Wednesday also saw weak volume compared to the end of the week, but a bearish engulfing candle opened lower & closed above Tuesday’s close, but was unable to break above the 10 day moving average’s resistance.
From here it all literally tumbled downhill.
Thursday opened on a gap down, attempted to climb higher, but the $195/share level is where it met its match & it slid to <$190/share by the close on the week’s second highest volume.
Friday showed the same sentiment, where even higher volumes lead to a -4.46% decline heading into the weekend, and the downside $177.50/share level was temporarily broken.
As noted in SPY & QQQ above, IWM has no base case at the moment for advancing, so until there is a sustainable level of higher volumes consistently attained it’s not worth looking into from a long-term perspective.
They’ve exhausted all of their support on the one year chart, so the table data below is best applied to their 2 year charts for seeing how they may ease their way into further declines (or not).
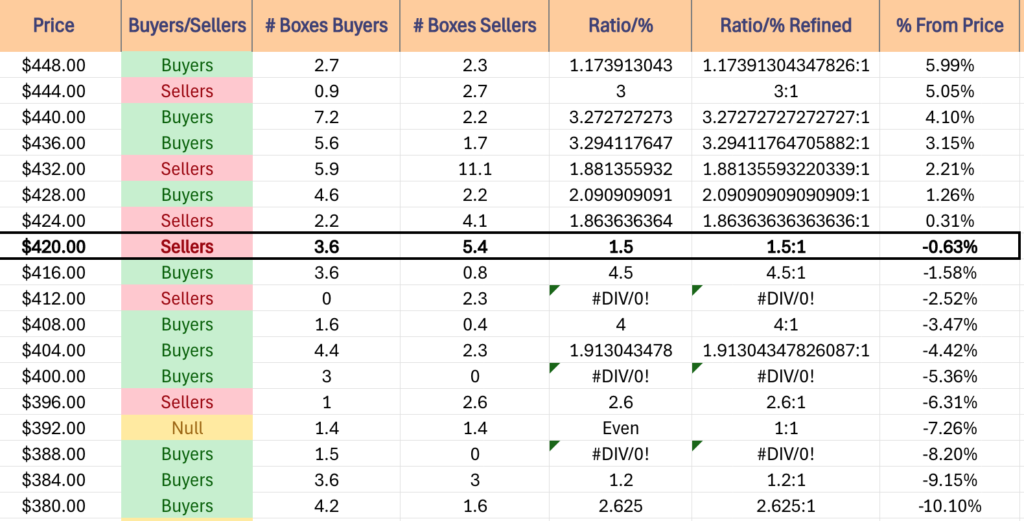
IWM has support at the $181.12 (2 Year Chart, Volume Sentiment: Sellers, 1.35:1), $164.61 (2 Year Chart, Volume Sentiment: Sellers, 1.4:0*), $158.85 (2 Year Chart, Volume Sentiment: NULL, 0:0*) & $157.17/share (3 Year Chart, Volume Sentiment: NULL, 0:0*) price levels, with resistance at the $189.17 (Volume Sentiment: Buyers, 1.32:1), $195.01 (Volume Sentiment: Buyers, 1.47:1), $195.72 (Volume Sentiment: Buyers, 1.47:1) & $196.56/share (Volume Sentiment: Buyers, 2:1) price levels.
DIA, the SPDR Dow Jones Industrial Average ETF fared the best of the majors, only losing -7.8% for the week as the blue chip index was still the favorite option among market participants.
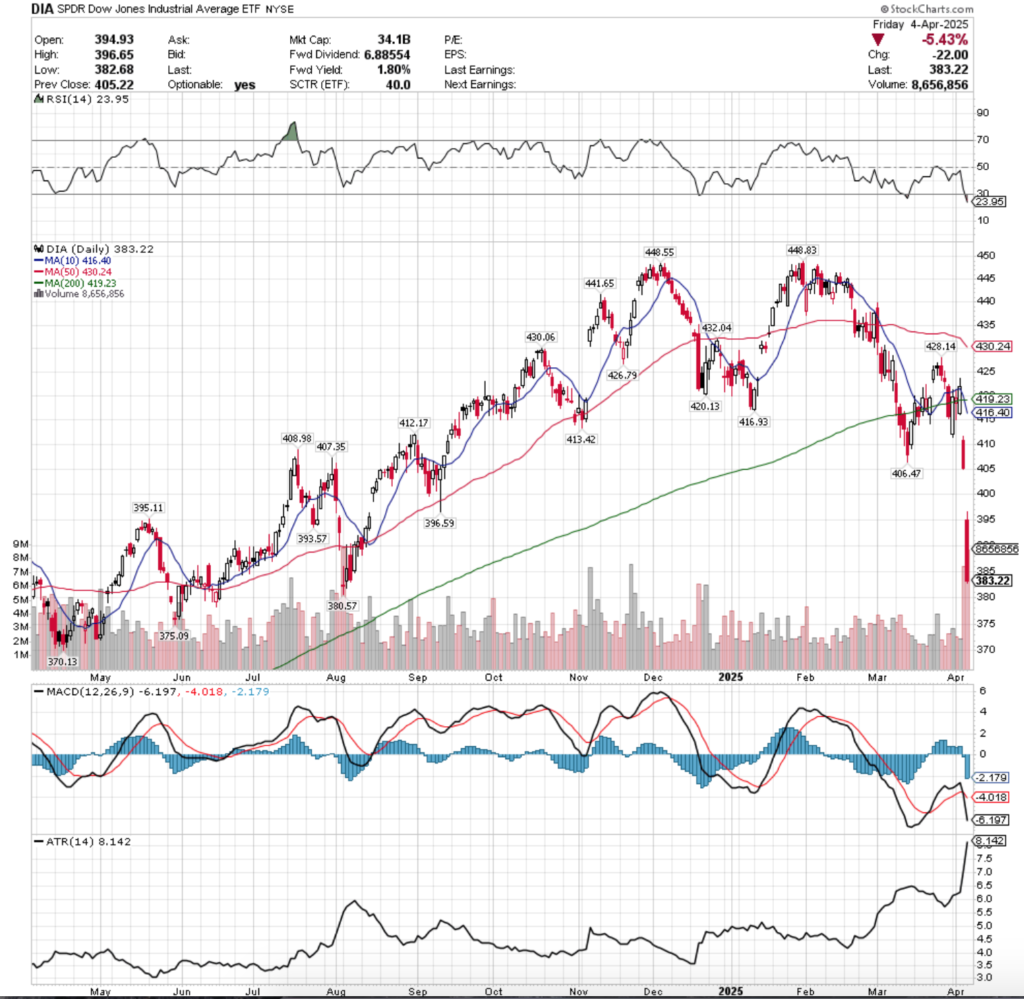
Their RSI is in oversold territory at 23.95, while their MACD is bearish since Thursday.
Volumes were +48.06% above the prior year’s average (4,756,000 vs. 3,212,262), as even the blue chip index is beginning to see the lights turn on & folks head home.
Rather than dive into the day-over-day analysis, in DIA’s case here it is really all boiling down to Thursday & Friday’s outflow volume.
While the blue chip names have remained a favorite among market participants vs. their peers, this too has begun to unwind & we’re now looking at their 2 year chart to find support levels.
Their relatively less intense declines by both price & volume are troubling here, as if the markets actually get really spooked on Wednesday/heading into the weekend the tidal wave that DIA outflows causes across other names will be noteworthy & something to watch.
In the meantime, this is something to consider, as any weakness in DIA in the coming week(s) will send shock waves across the other major indexes & cause larger issues across the board, particularly given that bank earnings kick off on Friday in addition to the other previously mentioned potential catalysts.
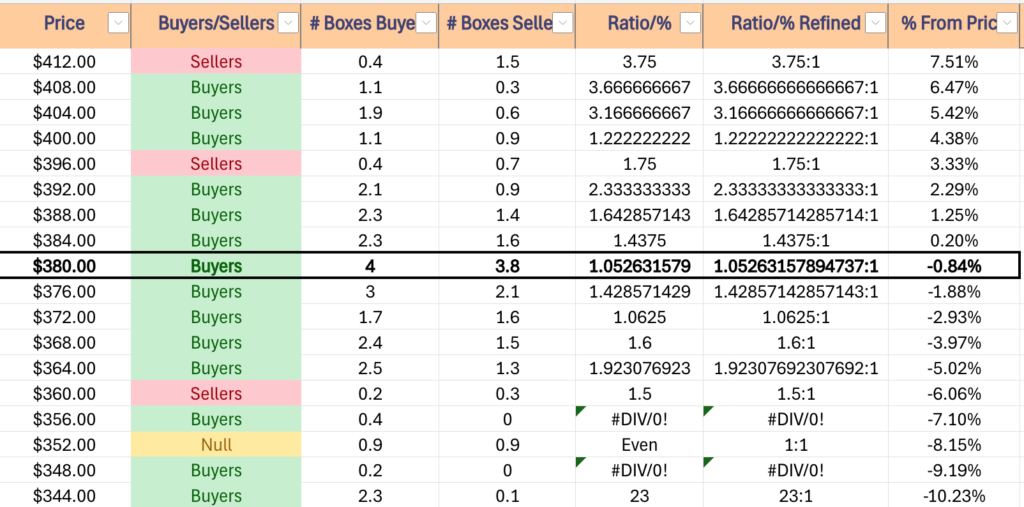
A two year chart for DIA & the table below are worth examining heading into the rest of the week.
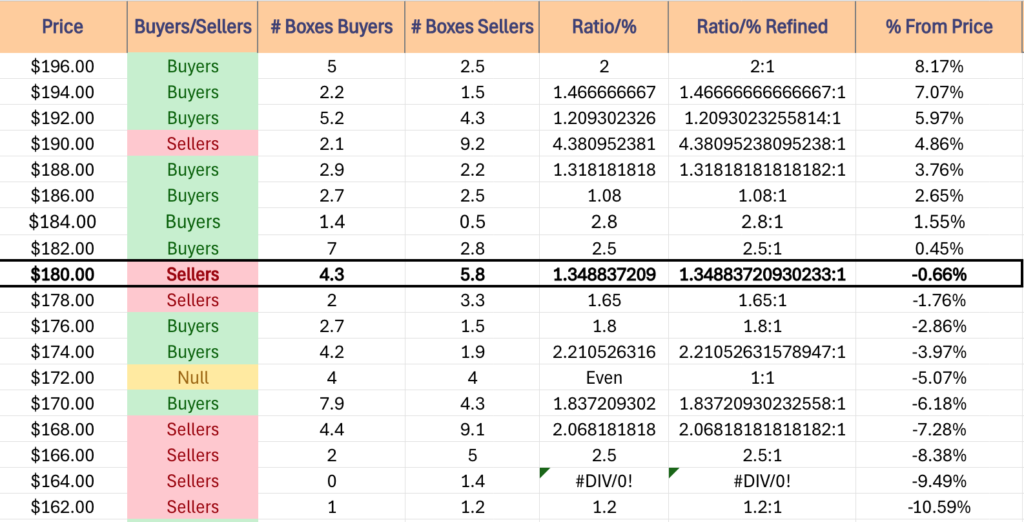
DIA has support at the $380.57 (Volume Sentiment: Buyers, 1.05:1), $375.09 (Volume Sentiment: Buyers, 1.06:1), $370.13 (Volume Sentiment: Buyers, 1.6:1) & $346.30/share (2 Year Chart, Volume Sentiment: Buyers, 23:1) price levels, with resistance at the $393.57 (Volume Sentiment: Buyers, 2.33:1), $395.11 (Volume Sentiment: Buyers, 2.33:1), $396.59 (Volume Sentiment: Sellers, 1.75:1) & $406.47/share (Volume Sentiment: Buyers, 3.17:1) price levels.
The Week Ahead
Monday the week begins with Consumer Credit data at 3 pm.
Dave & Busters, Greenbrier & Levi Strauss all report earnings after Monday’s closing bell.
NFIB Optimism Index data comes out Tuesday at 6 am.
Tuesday morning begins with earnings from WD-40, RPM & Tilray, followed by Cal-Maine Foods after the session’s close.
Wednesday brings us Wholesale Inventories data at 10 am, followed by the Minutes of March’s FOMC Meeting at 2 pm.
Delta Airlines, Neogen & Simply Good Foods report earnings before Wednesday’s opening bell, before Constellation Brands & PriceSmart report after the session’s close.
Initial Jobless Claims, Consumer Price Index, CPI Year-over-Year, Core CPI & Core CPI Year-over-Year data are released Thursday at 8:30 am, before Fed President Goolsbee speaks at 12 pm & Monthly U.S. Federal Budget data gets released at 2 pm.
Thursday morning’s earnings calls include CarMax & Lovesac, with no noteworthy reports after the closing bell.
Friday the week winds down with Producer Price Index, Core PPI, PPI Year-over-Year & Core PPI Year-over-Year data at 8:30 am, followed by Consumer Sentiment (prelim) at 10 am & Fed President Williams speaking at 11 am.
JP Morgan Chase, Blackrock, BNY Mellon, Fastenal, Morgan Stanley & Wells Fargo all report earnings before Friday mornings opening bell.
See you back here next week!
*** I DO NOT OWN SHARES OR OPTIONS CONTRACT POSITIONS IN SPY, QQQ, IWM OR DIA AT THE TIME OF PUBLISHING THIS ARTICLE ***