SPY, the SPDR S&P 500 ETF fell -0.89% last week, performing second best behind QQQ for the week as bearish sentiments began to creep into the markets.
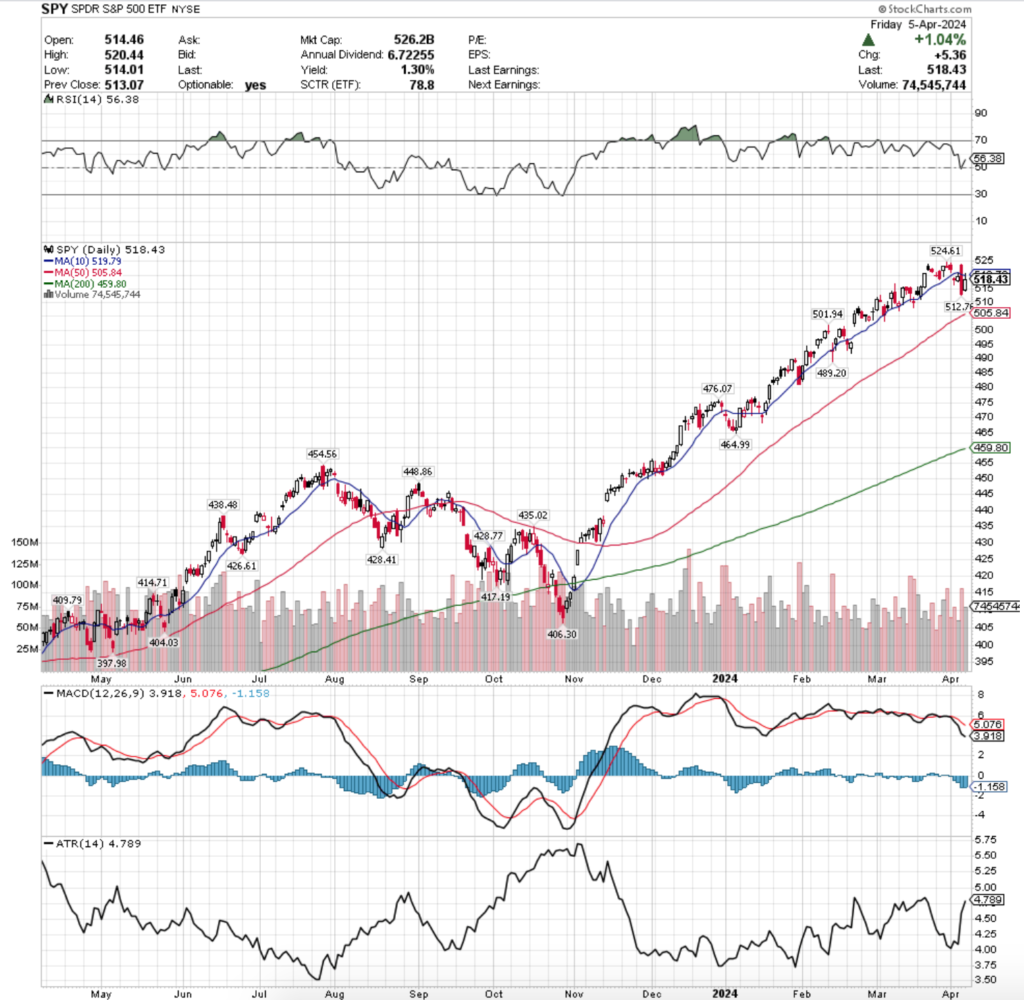
Their RSI is currently trending towards overbought after recently bouncing off of the neutral level & sits at 56.38, while their MACD is bearish in the wake of Tuesday’s gap down session.
Volumes were -5.6% below average last week compared to the year prior (73,416,960 vs. 77,775,567), and likely would have been lower had Thursday’s wide-range volatile session not taken place.
Monday kicked the week off with a bearish note, as a bearish engulfing candle resulted from the second-lowest volume session of the week.
While they declined, the price remained firmly above the 10 day moving average’s support (a key area we’ve mentioned over the past few weeks to keep an eye on) & prices were able to close above the lows of the day’s session.
Tuesday the narrative changed dramatically, as a gap down session broke through the 10 DMA‘s support on 18.8% higher volume than the day prior, as market participants began to get worries & looking for the exits.
There was marked indecision as the session resulted in a spinning top candle, but the open-close price action stayed on the higher end of the session’s candle, indicating that there was still some bullish appetite, but that it was becoming markedly more bearish than the last couple of months.
Wednesday confirmed this, as there was a daily advance on the session, but the resistance of the 10 day moving average was unable to be broken & help up, with the real body of the candle forming a tight range with Tuesday’s.
The lack of certainty & confidence in the market was also confirmed, as the session resulted in a spinning top, on the weakest volume of the week (-20.5% volume decline day-over-day), as market participants signaled they clearly were not sure what is coming in the near-term, leading to a chaotic Thursday.
The session opened on a large gap up, clearing the resistance of the 10 day moving average, but signaled that the uncertainty was being replaced by fear as the day declined on a wide range bearish engulfing candlestick that went up to just shy of the all-time high price level, but ultimately was sold off into violently.
The declining volume of Thursday was +64.1% higher than the lowest volume of the week which occurred the day prior & marked a significant shift in investor confidence in the near-term.
While Friday was able to hold on to a +1.04% advance for the day, the theme of the week remained in tact as prices tested higher, broke above the 10 DMA’s resistance briefly, but wound up settling below it & just barely above the 20 day moving average (not pictured in the chart above).
This is going to be an area to keep an eye on heading into this week, as while the price of SPY was able to briefly test over the 10 DMA, the support of the 20 DMA will be tested & if broken all eyes move down ~3% to where the 50 DMA is currently.
While the is one other support level along the way from the current price to the 50 DMA, it’s hard to gauge what its strength will be at these high price levels for SPY & given that it is the point that Thursday’s declining session established when it pivoted off of its daily low it is too soon to tell how strong it will hold up.
If SPY breaks towards the downside, the 10 & 20 DMAs will be applying downwards pressure on their price, which will also result in trouble for their price.
This is especially true given how we’ve been recently consolidating after many months of advancing prices that have left a small number of support levels in its wake.
Another area to keep an eye on now is their Average True Range, a measure of volatility that has advanced to the high level where it has pivoted back from over the past couple of months.
While Monday will be a light day on the news front (which may see an additional advancing pump, else most likely a muted session), the rest of the week may find the ATR continuing higher once we receive the reads on CPI & PPI data.
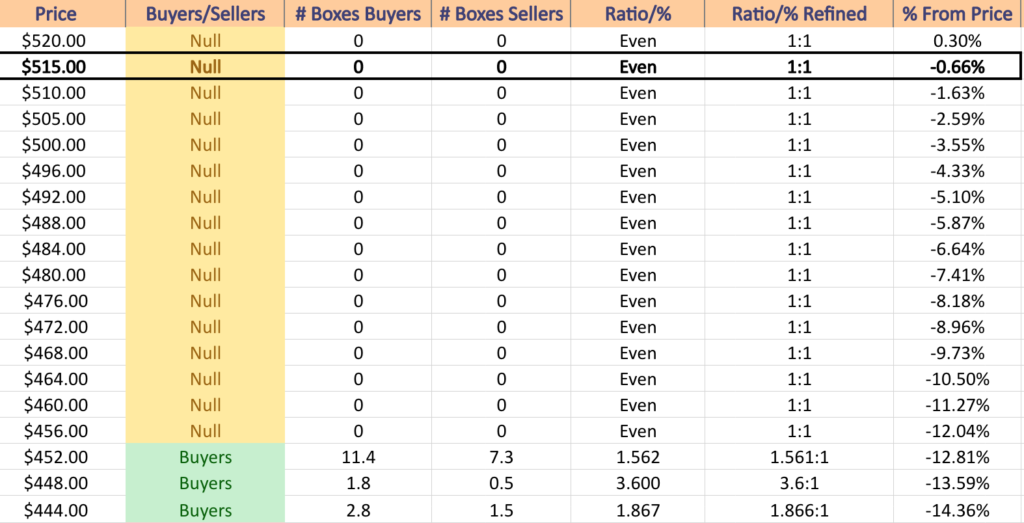
Due to prices being near all-time highs, much of the data below is currently NULL for the neighboring price levels of SPY’s current price,as volatility amps up & there begin to be more tests of these price levels there will be more complete data, which will be published in the coming week(s).
SPY has support at the $512.76 (Volume Sentiment: NULL, 0:0*), $505.84 (50 Day Moving Average, Volume Sentiment: NULL, 0:0*), $501.94 (Volume Sentiment: NULL, 0:0*) & $489.20/share (Volume Sentiment: NULL, 0:0*) price levels, with resistance at the $ 519.79 (10 Day Moving Average, Volume Sentiment: NULL, 0:0*) & $524.61/share (All-Time High, Volume Sentiment: NULL, 0:0*) price level.
QQQ, the Invesco QQQ Trust ETF that tracks the NASDAQ 100 dipped -0.8% this past week, faring the best of the four major indexes in the wake of a week that featured a lot of bearish sentiment in markets.
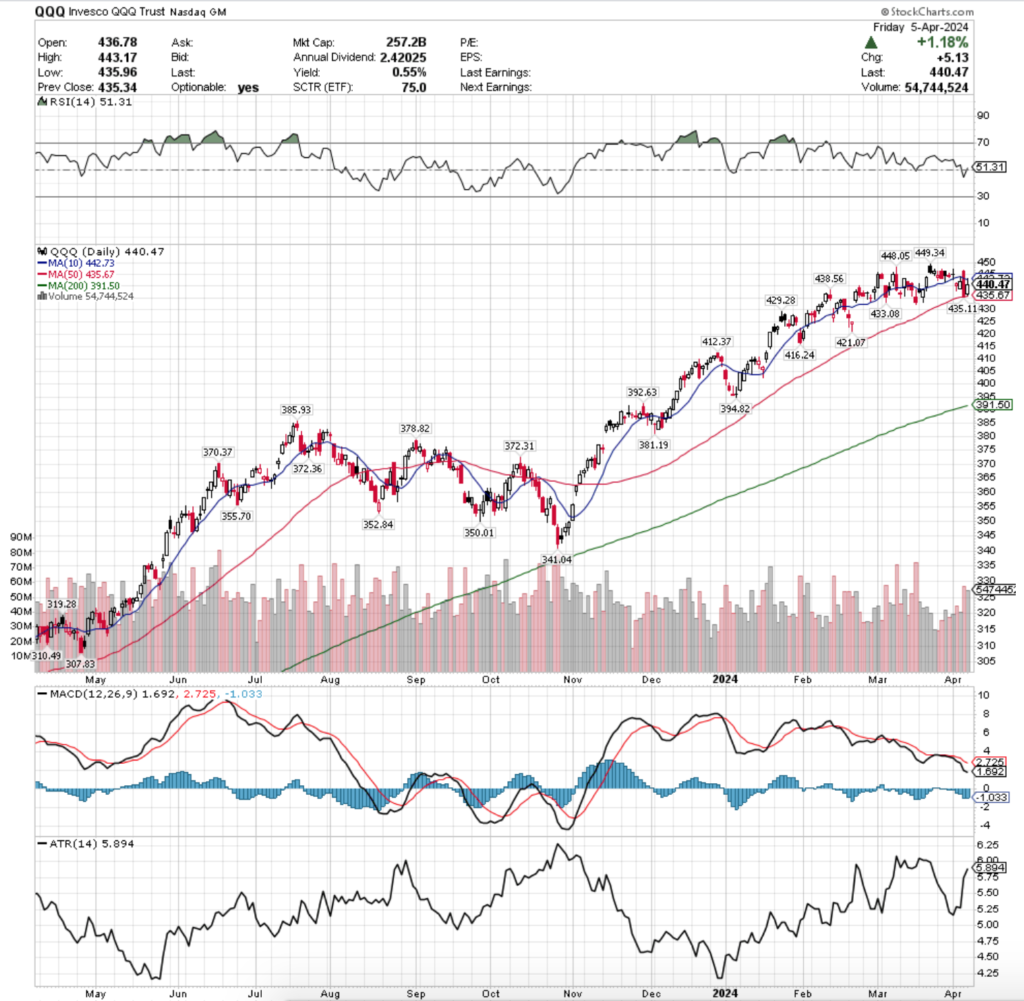
Their RSI is currently at 51.3 & is climbing higher, while their MACD is in bearish decline.
Volumes were -4.31% below average last week compared to the year prior (46,956,000 vs. 49,072,125), which is a bit troubling given that three of the sessions were advances & does not inspire much near-term confidence.
Monday started off on an uncertain note, as the session advanced slightly with a doji candle, signaling uncertainty & that in the moment the market participants viewed it as being in equilibrium, but without much conviction given the low volume of the session.
Tuesday confirmed that with a gap down session that broke the 10 DMA’s support & tested lower trying to reach the 50 day moving average, also on low volume, which kept the uncertainty narrative alive & well given it resulted in a spinning top candle.
Wednesday is where things got more interesting, where the session’s candle resulted in a bullish engulfing pattern, however its upper shadow was unable to test the 10 day moving average’s resistance & its day-over-day advance was only +0.11%.
Much like SPY, QQQ had a large bearish engulfing candlestick pattern emerge following the wake of Thursday’s wide-range session.
QQQ declined -1.22% on Thursday on the week’s highest volume, opening above the 10 DMA, before ultimately diving through it & finally settling atop the 50 DMA’s support.
Friday’s session opened just above the 50 DMA, climbed back +1.18% to form a bullish harami pattern, but was unable to press above the 10 DMA & wound up resting right beneath their 20 DMA (not pictured*) on the second highest volume session of the week.
This volume trend is going to result in an interesting week for QQQ, as it is clearly signaling that the price belongs beneath the 10 & 20 DMAs, but that the 50 DMA’s support is still valid & well.
Unless Monday’s session results in a doji where the candle’s real body can still fit between all of these points, there will need to be a breakout one way or another.
While Friday’s candle created a bullish two day pattern, it directly followed a much more violent two day pattern where the majority of the volume went on the declining side.
Pair this with the downwards pressure being applied by the 10 & 20 DMAs while the 50 DMA is currently rising still & looks to be the start of a volatile week for QQQ.
With that said, their Average True Range has been climbing over the past few days & is nearing where it has peaked twice in March, which will be another area to keep an eye on as an indicator of increased volatility.
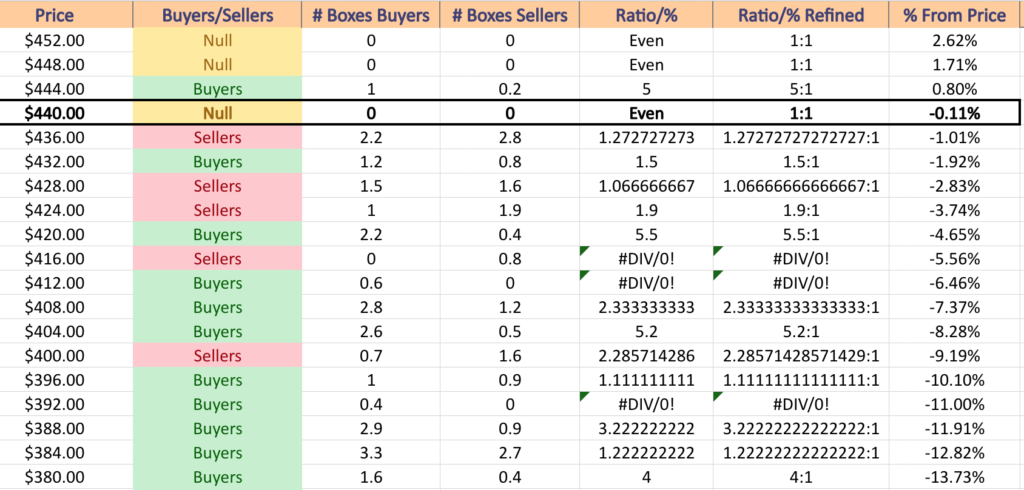
Their Price Level:Volume Sentiment table below should also be read with a grain of salt as we are currently near all-time highs, meaning that there is limited data on the volumes at these prices currently, leading to the NULL values, as well as some values that are more stretched in one direction than the other due to a low sample size of trades at each price.
The extreme values will be retested & in the process become more diluted upon a correction/shake off in QQQ’s price.
QQQ has support at the $438.56 (Volume Sentiment: Sellers, 1.27:1), $435.67 (50 Day Moving Average, Volume Sentiment: Buyers, 1.5:1), $435.11 (Volume Sentiment: Buyers, 1.5:1) & $433.08/share (Volume Sentiment: Buyers, 1.5:1) price levels, with resistance at the $442.73 (10 Day Moving Average, Volume Sentiment: NULL, 0:0*), $448.05 (Volume Sentiment: Buyers, 5:1) & $449.34/share (All-Time High, Volume Sentiment: Buyers, 5:1) price level.
IWM, the iShares Russell 2000 ETF declined -2.78% last week, as market participants took profits off of the table following a strong weekly performance for the small cap index during the week prior.
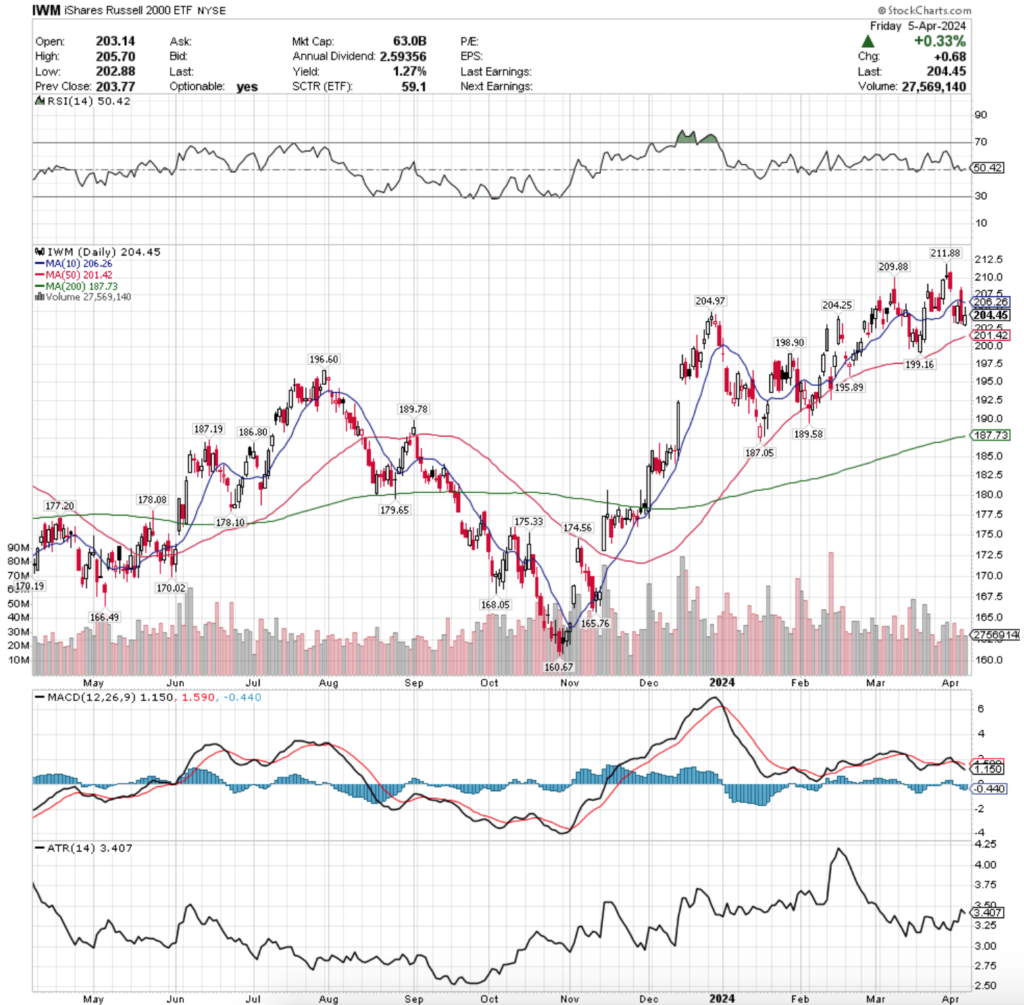
Their RSI is currently neutral at 50.42, as over the past week it reverted back to the mean from approaching overbought territory near the end of March, while their MACD is bearish following the cool-off period that brought their RSI back to neutral.
Volumes were -12.83% lower than average last week compared to the year prior (29,888,040 vs. 34,286,871), with the two highest days coming on declines, followed by the two advancing days & the weakest volume session being Monday’s.
Monday set the stage for the rest of the week’s declines, when a bearish engulfing pattern emerge over the Thursday prior’s doji candle, signaling that market participants were ready for a bit of profit taking & getting out of the pool.
It should be noted that the low volume on this session would normally signal uncertainty & a lack of strong conviction in the move downward, but the rest of the week’s bearish sentiments overcloud that.
Tuesday saw a gap down beneath the support of the 10 day moving average that continued to test lower, as shown by the lower shadow of the candle on the highest volume of the week, adding conviction to Monday’s bearish sentiment.
Wednesday showed my inclination to take risk with a bullish engulfing candle pattern emerging in the wake of the window down, however, the weak volume is not indicative of much strength behind the move, which made the head-fake of Thursday’s gap up open easy to see through.
Thursday gapped up on the open to above the 10 DMA’s resistance, tested slightly higher (upper shadow) before crashing down through the 10 DMA & settling just above the open of Wednesday on the second highest volume of the week.
Friday resulted in a +0.33% advance on similar volume to Wednesday’s, indicating weak demand.
Another bearish implication from Friday is that the session opened lower than Thursday’s close, tested a little lower before powering higher but was unable to come near the 10 DMA.
Atop that, the day’s close is ~50% of the way through the entire day’s price range as you can see in the long upper shadow.
Pair this with the 10 DMA that has already curled over to apply bearish pressure downward on price & the fact that the 50 DMA is still ~1% below the Friday’s closing price & there looks to be bearish expectations for IWM this week.
Like SPY & QQQ, IWM’s moving averages listed above will play a similar role to what has been outlined above, but the volumes in IWM’s case will likely be a more determining factor in terms of how the week performs.
With more support & resistance levels nearby the current price for IWM, the tug of war this week will likely be won based on the volume, particularly given how last week the bearish volume outperformed bullish.
If that makes investors less eager to hop back in the pool then expect to see the week end in declines for IWM.
Their Average True Range is currently declining but is about at the middle range, and will likely begin climbing again as this week does not appear to be a placid one on the horizon.
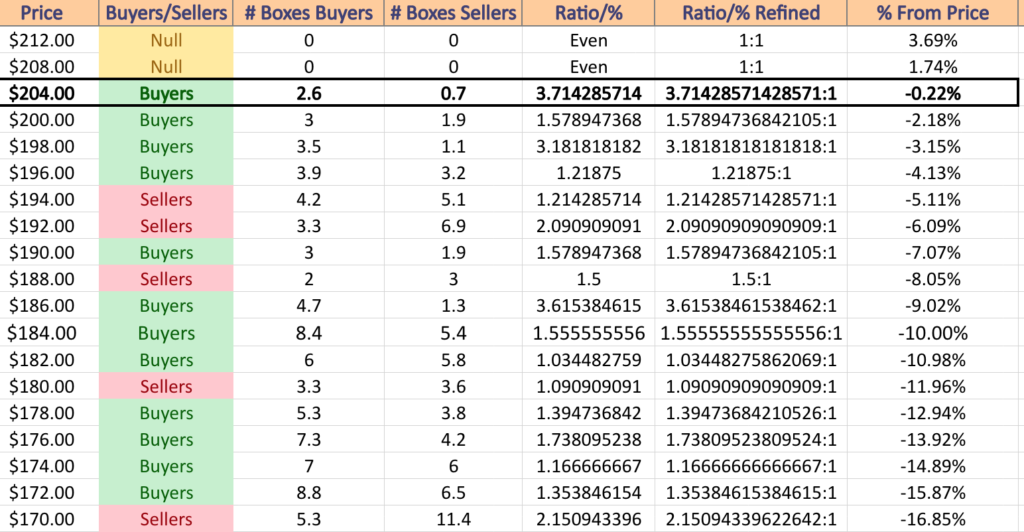
IWM has support at the $204.25 (Volume Sentiment: Buyers, 3.71:1), $201.42 (50 Day Moving Average, Volume Sentiment: Buyers, 1.58:1), $199.16 (Volume Sentiment: Buyers, 3.18:1) & $198.90/share (Volume Sentiment: Buyers, 3.18:1) price levels, with resistance at the $204.97 (Volume Sentiment: Buyers, 3.71:1), $206.26 (10 Day Moving Average, Volume Sentiment: Buyers, 3.71:1), $209.88 (Volume Sentiment: NULL, 0:0*) & $211.88/share (52-Week High, Volume Sentiment: NULL, 0:0*) price level.
DIA, the SPDR Dow Jones Industrial Average ETF fell -2.24% last week, faring second worse of the four major indexes, only behind IWM, as the largest & small cap names were all viewed unfavorably.
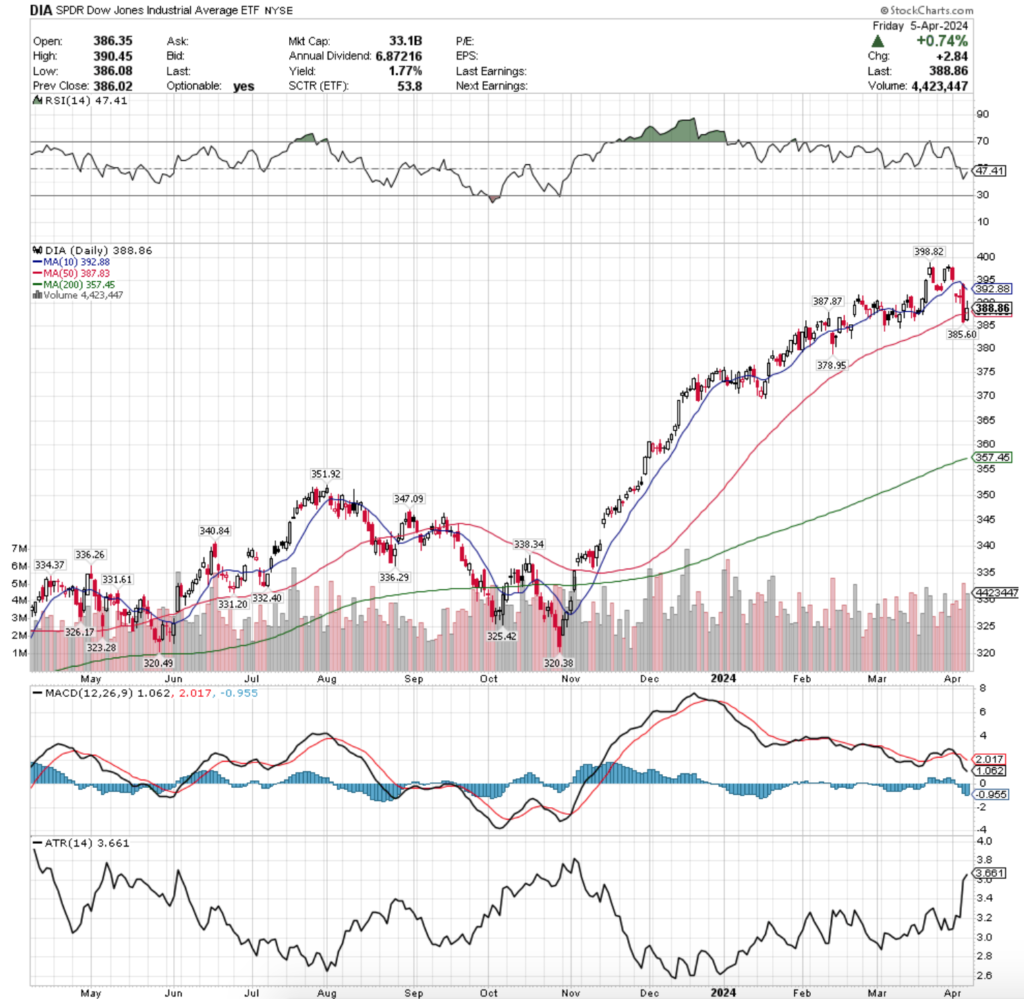
Their RSI is trending back towards neutral & currently sits at 47.41, while their MACD is still bearish following last week’s declines.
Volumes were +21.39% above average last week compared to the year prior (4,171,780 vs. 3,436,708), which is a strong signal of caution given that four of the five sessions resulted in declines.
As noted last week, the evening star pattern was completed with Monday’s declining session, paving the way for the rest of the week’s declines.
Tuesday followed the same gap down story as the other major indexes as market participants were eager to get chips taken off of the table.
Tuesday’s hammer behaved more like a hanging man (hanging man would be the name if it occurred in an uptrend), as DIA continued to sink lower throughout the week, with a long-legged doji on Wednesday & a bearish engulfing candle on Thursday’s wide range declines, which kicked off at the 10 DMA & declined all the way below the support of the 50 DMA.
SPY, QQQ & IWM were not able to break through the 50 DMA to the downside, which given the velocity of how DIA climbed from November until its all-time high in March should have market participants alert & thinking of taking more risk off of the table this week.
Friday saw a high volume bullish session that resulted in a bullish harami pattern where the open was near the close of Thursday but the session closed above the 50 DMA.
While the volume on Friday was almost as high as Thursday’s declining volumes, it’s not a strong sentiment indicator in this instance as the three beginning days of the week had strong bearish volumes.
The 50 DMA & the $387.87 & $385.60/share price levels will be a key area of support to watch this week, particularly as if the 50 DMA’s support is broken there will be downside pressure from both that & the 10 DMA with only one other support level before the 200 DMA, which is currently ~8% below the closing price of Friday’s session.
Their Average True Range is still climbing as volatility has increased in the wake of a relatively smooth four month ascent & will be important to watch when prices break to one side or the other this upcoming week.
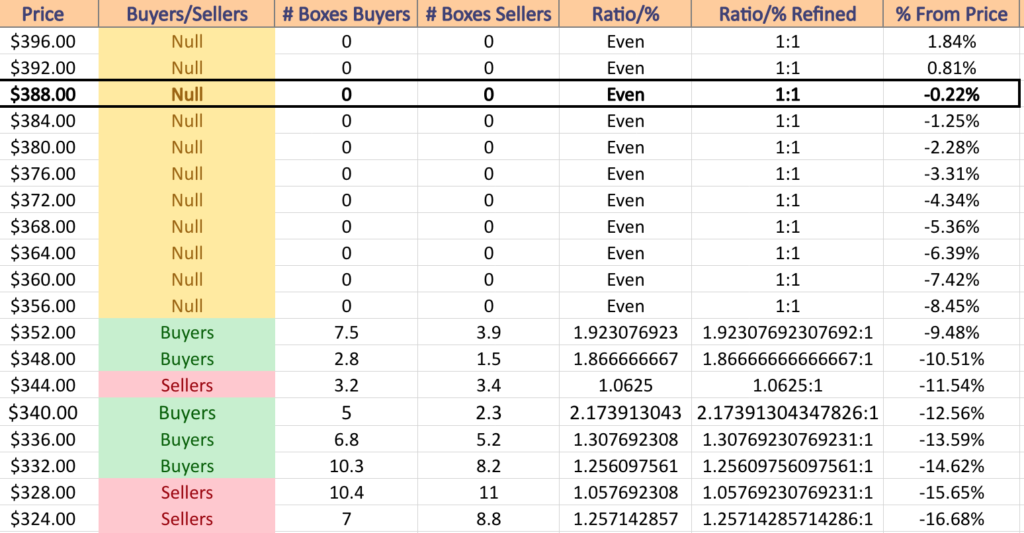
DIA has support at the $387.87 (Volume Sentiment: NULL, 0:0*), $387.83 (50 Day Moving Average, Volume Sentiment: NULL, 0:0*), $385.60 (Volume Sentiment: NULL, 0:0*) & $378.95/share (Volume Sentiment: NULL, 0:0*) price levels, with resistance at the $392.88 (10 Day Moving Average, Volume Sentiment: NULL, 0:0*) & $398.82/share (All-Time High, Volume Sentiment: NULL, 0:0*) price level.
The Week Ahead
Monday does not feature any major economic data releases or Fed speakers, nor will any noteworthy earnings reports be released.
NFIB Optimism Index data is released Tuesday at 6 am.
Tuesday morning kicks off with earnings from Cognyte Software, Neogen & Tilray before the opening bell, before PriceSmart, SMART Global & WD-40 report after the session’s close.
Consumer Price Index, Core CPI, CPI Year-over-Year & Core CPI Year-over-Year data are scheduled to be announced on Wednesday morning at 8:30 am, followed by Wholesale Inventories data at 10 am, Boston Fed President Collins speaking at 12 pm & the Minutes of the March FOC Meeting & Monthly U.S. Federal Budget data at 2pm.
Wednesday will feature Delta Airlines’s earnings call.
Thursday morning begins with Initial Jobless Claims, Producer Price Index, Core PPI, PPI Year-over-Year & Core PPI Year-over-Year at 8:30 am, followed by Chicago Fed President Goolsbee speaking at 12:45 pm & Atlanta Fed President Bostic speaking at 1:30 pm.
CarMax, Constellation Brands, Fastenal & Lovesac will all report earnings before the opening bell on Thursday.
The week winds down with Import Price Index & Import Price Index minus Fuel data at 8:30 am on Friday, before Consumer Sentiment (prelim) at 10 am, Atlanta Fed President Bostic speaking at 2:30 pm & San Francisco Fed President Daly speaking at 3:30 pm.
Friday features JP Morgan Chase’s earnings, as well as BlackRock, State Street & Wells Fargo before the opening bell.
See you back here next week!
*** I DO NOT OWN SHARES OR OPTIONS CONTRACT POSITIONS IN SPY, QQQ, IWM OR DIA AT THE TIME OF PUBLISHING THIS ARTICLE ***